ScholarlyCommons
ScholarlyCommons
Wharton Pension Research Council Working
Papers Wharton Pension Research Council
5-2-2019
Is Rising Household Debt Affecting Retirement Decisions?
Is Rising Household Debt Affecting Retirement Decisions?
Barbara A. ButricaNadia S. Karamcheva
Follow this and additional works at: https://repository.upenn.edu/prc_papers Part of the Economics Commons
Butrica, Barbara A. and Karamcheva, Nadia S., "Is Rising Household Debt Affecting Retirement Decisions?" (2019). Wharton Pension Research Council Working Papers. 536.
https://repository.upenn.edu/prc_papers/536
This paper is posted at ScholarlyCommons. https://repository.upenn.edu/prc_papers/536
Abstract Abstract
Household debt among older Americans approaching retirement has increased dramatically over the past couple of decades. Older households have become increasingly more indebted and more leveraged. While mortgages remain the predominant type of debt among households in their 50s and 60s, in recent years, student loan debt has also risen among these households. Using household survey data to
examine how late life debt affects retirement decisions, we find that more indebted older adults are more likely to work, less likely to be retired, and on average expect to work longer than those with less debt.
Keywords Keywords
Older adults, household debt, mortgages, student loan debt
Disciplines Disciplines
Economics
Is Rising Household Debt Affecting Retirement Decisions?
Barbara A. Butrica and Nadia S. KaramchevaMay 2, 2019
PRC WP2019-14
Pension Research Council Working Paper Pension Research Council
The Wharton School, University of Pennsylvania 3620 Locust Walk, 3302 SH-DH
Philadelphia, PA 19104-6302 Tel.: 215.573.3414 Fax: 215.573.3418
Email: prc@wharton.upenn.edu http://www.pensionresearchcouncil.org
Barbara A. Butrica is a Senior Fellow at the Urban Institute in Washington, DC and Nadia S. Karamcheva is an Economist at the Congressional Budget Office in Washington, DC. The findings and conclusions are solely those of the authors and do not represent the views of the Congressional Budget Office, any agency of the Federal Government, or the Urban Institute, its board, or its sponsors. The authors would like to thank Bret Hammond, Joshua Mitchell, Kevin Moore, John Sabelhaus, Jason Seligman, and the participants of the 2019 Symposium of the Pension Research Council for thoughtful comments and suggestions. All errors are the authors’ own. All findings, interpretations, and conclusions of this paper represent the views of the author(s) and not those of the Wharton School or the Pension Research Council. © 2019 Pension Research Council of the Wharton School of the University of Pennsylvania. All rights reserved.
Is Rising Household Debt Affecting Retirement Decisions? Barbara A. Butrica and Nadia S. Karamcheva
Abstract
Household debt among older Americans approaching retirement has increased
dramatically over the past couple of decades. Older households have become increasingly more indebted and more leveraged. While mortgages remain the predominant type of debt among households in their 50s and 60s, in recent years, student loan debt has also risen among these households. Using household survey data to examine how late life debt affects retirement decisions, we find that more indebted older adults are more likely to work, less likely to be retired, and on average expect to work longer than those with less debt.
Keywords: Older adults, household debt, mortgages, student loan debt Barbara A. Butrica
Urban Institute BButrica@urban.org Nadia S. Karamcheva Congressional Budget Office Nadia.Karamcheva@cbo.gov
Labor force participation rates have been rising among older adults. Between 1990 and 2018, rates increased 5 percent for men ages 55-64 (from 68 to 71%) and 47 percent for men age 65+ (from 16 to 24%). Over the same period, labor force participation rates among older women skyrocketed—increasing 31 percent for women age 55-64 (from 45 to 59%) and 84 percent for those age 65+ (from 9 to 16 percent). In contrast, labor force participation rates declined 5 percent for men age 25-54 and increased only 2 percent for women age 25-54. 1
Possible explanations for the increase in work at older ages include increases in educational attainment, changes to social security policy and employer-provided pension plans affecting retirement incentives (Coile 2018), more people living longer and healthier lives2, declines in
physically demanding jobs (Johnson 2004; Johnson et al. 2007), and cohort effects, particularly among women (Goldin and Katz 2016). One important explanation that has received less attention is the rise in household debt. Although adults age 60+ hold less of the total US debt than most other age groups, their share of total debt has increased dramatically. Between 2003Q1 and 2018Q4, the share of debt held by adults age 60-69 increased 61 percent and the share held by adults age 70+ increased 90 percent. In contrast, the share held by adults age 50-59 was fairly constant and the share held by those age 18-40 declined (Federal Reserve Bank of New York 2019).3 Furthermore, new bankruptcies have increased for adults age 50+ since 2000—by 46
percent for adults age 50-59, 113 percent for adults age 60-69, and 67 percent for those age 70+. By comparison, new bankruptcies declined for all other ages (Federal Reserve Bank of New York 2019).4
Indebted older adults who are cash-strapped and unable to service their debt because they are not working (as a result of unemployment or poor health, for example) or because they do not earn much might claim their social security benefits as soon as they are eligible in order to obtain
the necessary cash to make their loan payments. Yet, if older adults are working longer and delaying social security benefit claiming to pay off their debts, then this could explain the increase over time in their labor force participation rates. While several experts argue that retirement security hinges on delaying retirement as long as possible (Butrica 2011; Butrica et al. 2007; Munnell and Sass 2009), if people are working longer to pay off their debts instead of saving for retirement, their prospects for a secure retirement may only improve marginally.
This chapter uses household survey data to examine how late-life debt affects retirement decisions and retirement income security. We explore the relationship between household debt and the decision to remain in the workforce, claim social security benefits, and retire. We examine those outcomes separately while also controlling for interactions resulting from Social Security’s program rules such as the early eligibility age (EEA), the full retirement age (FRA), and the retirement earnings test (RET).5 We also explore the relationship between household debt and
workers’ expected age of retirement for those who are younger than 62. We study how different types of debt such as mortgages, credit card debt, and student loans affect those decisions. We find that among those with debt, both the presence and level of debt increase the likelihood that older adults work, reduce the likelihood that they collect social security benefits, and reduce the likelihood that they are retired. Among older adults with debt, we find that credit card debt has a significantly larger effect on work, social security benefit receipt, and retirement than does mortgage debt and other types of debt. Whereas student loan debt has no statistically significant effect on older adults’ retirement behavior on average, both the presence and level of student debt reduce the likelihood of receiving social security benefits and the likelihood of being retired among older adults with the lowest wealth.
Background
In this section, we discuss findings from previous studies on debt among older adults and the factors influencing their work and retirement.
Debt at older ages. Recent studies have documented the rise in debt among older Americans (Brown et al. 2019; Butrica and Karamcheva 2013, 2018; Butrica and Mudrazija 2016; GAO 2014; Joint Center for Housing Studies of Harvard University 2014; Masnick et al. 2006; Karamcheva 2013; Lusardi et al. 2018; Munnell et al. 2016; Smith et al. 2010). Not only are older adults more likely to carry debt, but their level of indebtedness has increased substantially over time.
Mortgages are the most common and largest type of debt held by older adults. Although paying down a mortgage has traditionally been the norm, households have increasingly shifted their approach to homeownership toward refinancing (Masnick et al. 2006). Recent data show not only that today’s older Americans are more likely than their predecessors to have outstanding mortgages, but also that mortgages are the most significant source of debt among indebted older adults (Butrica and Karamcheva 2013; Butrica and Mudrazija 2016; Joint Center for Housing Studies of Harvard University 2014; Trawinski 2020). Furthermore, later generations of homeowners have taken on more mortgage debt and financed their homes for longer periods than earlier birth cohorts (Smith et al. 2010).
A GAO (2014) study also found that student debt is increasing among older Americans. Using data from the Survey of Consumer Finances (SCF), the authors found that the share of households age 65-74 with student loan debt quadrupled from less than 1 percent to 4 percent between 2004 and 2010. In comparison, the share of households with student debt increased by only 40 percent among those age 18-34 and by only 80 percent among those age 35-44. Data from the Consumer Credit Panel/Equifax Data, a longitudinal database constructed from a nationally
representative random sample of Equifax credit report data, shows the same trend. The share of total student debt held by adults age 50-59 increased from 9 percent in 2004 to 14 percent in 2018, while the share held by adults age 60+ increased from 2 percent in 2004 to 6 percent in 2018.6 By
2018, adults age 50+ held 20 percent of the 1.4 trillion dollars in student loans—representing 6 percent of total debt for adults age 50-59, 4 percent of total debt for those age 60-69, and 2 percent of total debt for those age 70+ (Federal Reserve Bank of New York 2019).7
Debt itself is not necessarily concerning, but it does become riskier as the amount of debt increases relative to income and assets. Unfortunately, studies find that older Americans have become increasingly more leveraged over time. Lusardi et al. (2018) find that the mean debt-to-asset ratio among adults ages 56-61 rose from 45 percent for the oldest birth cohort to 104 percent for the youngest cohort, and even the median debt ratio grew from 4 percent to 15 percent between birth cohorts. Butrica and Karamcheva (2018) find that the mean debt-to-asset ratio among adults age 62-69 increased from 10 percent in 1998 to 23 percent in 2014. Butrica and Mudrazija (2016) examine the circumstances of older homeowners with housing debt and find three things. First, their median loan-to-value (LTV) ratio—the ratio of housing debt to the home value— increased from 31 percent in 1998 to 45 percent in 2012. High LTV ratios signal homes that are risky assets. In fact, most lenders will charge higher interest rates or require private mortgage insurance on loans for more than 80 percent of the home’s value to cover the credit losses they expect because such loans are riskier. Second, the share with LTV ratios of at least 80 percent increased from 8 to 20 percent over the same time period. A homeowner’s mortgage is considered ‘underwater’ if the LTV ratio is more than 100 percent—meaning the homeowner owes more than the house is worth. Third, the share underwater nearly tripled from 2.9 percent in 1998 to 8.2 percent in 2012.
Using data from the Consumer Bankruptcy Project, Thorne et al. (2018) report that the share of new bankruptcy filers age 65+ more than doubled, and that the share of all bankrupt Americans age 65+ nearly quintupled, between 1991 and 2016. The Consumer Credit Panel/Equifax Data show that, between 2000Q1 and 2018Q4, the share of total new bankruptcies increased 59 percent for adults age 50-59, 132 percent for adults age 60-69, and 82 percent for those age 70+. In contrast, the share of total new bankruptcies increased only 4 percent for adults age 40-49 and declined 22 percent for adults age 30-39 and 47 percent for those under age 30.8
Those same data show that the share of total new foreclosures between 2003Q1 and 2018Q4 increased among adults age 50+ (48 percent for those age 50-59, 170% for those age 60-69, and 222% for those age 70+) but declined among adults below age 50.9 Furthermore, the GAO (2014)
report found that among those with student debt, older adults are significantly more likely than younger adults to be in default (19% of those age 50-64, 27% of those age 65-74, and 54% of those age 75+). By contrast, only 12 percent of adults age 25-49 with student loans are in default. Contrary to what one might think, the GAO study also reported that older adults are more likely to default on their own student loans but not on their children’s loans. The study also notes that, unlike other debt, student debt is generally not forgiven in bankruptcy cases. Moreover, defaulting on student loans can lead to reductions in certain federal payments such as social security benefits (GAO 2014).
To shed light on the determinants of household debt, Almenberg et al. (2018) developed a survey to measure attitudes toward debt. They combined survey responses from Swedes with administrative data on income, wealth and debt. They report that Swedes who say they are uncomfortable with debt have lower debt-to-income ratios. Comparing parents’ and their children’s attitudes toward debt, the authors find that parents are more uncomfortable with debt
than their children—suggesting that people are becoming more comfortable with carrying debt over time. Munnell et al. (2016) forecasts that the rise in student debt will increase the share of households at risk in retirement by 4.6 percentage points—directly by reducing savings in retirement plans and indirectly by reducing the home equity available in retirement.
Work and retirement decisions. Previous literature has identified a number of factors that influence work and retirement decisions, including job loss (Chan and Stevens 2004), health insurance (Johnson et al. 2003; French and Jones 2011), out-of-pocket health care costs (Johnson et al. 2008), housing wealth (Begley and Chan 2018; Ondrich and Falevich 2016), stock market performance (Goda et al. 2012), inheritances (Brown et al. 2010), and lottery winnings (Cesarini et al. 2017). Using the Health and Retirement Study (HRS), Begley and Chan (2018) find that older men who experience moderately negative shocks to their home values respond by delaying their retirement and their receipt of social security, and in some cases, if already retired, by reversing their retirement. The authors report similar results for some subgroups of women. Likewise, Ondrich and Falevich (2016) show that declines in housing wealth during the Great Recession lowered married men’s likelihood of retiring 14 to 17 percent. Brown et al. (2010) find that those who receive an inheritance are more likely to retire—especially when the inheritance is unexpected.
A few studies have also identified debt as a factor influencing work and retirement. Belkar et al. (2007), using the Household, Income and Labour Dynamics in Australia survey, find the strongest effect of indebtedness on individuals’ likelihood of labor force participation when using a debt-servicing ratio variable. In addition, the effects are larger for women than for men, and larger for women with young children than for those without. The authors suggest that this ordering reflects each group’s relative attachment to the labor force. Mann (2011) uses the HRS to analyze
the relationship between debt and retirement for older Americans and concludes that the level of debt reduces the likelihood of retiring. Also, using the HRS, Lusardi and Mitchell (2016) show that, among older women, mortgage debt is positively associated with both a higher propensity to be currently working and a higher expectation to be working at age 65.
Butrica and Karamcheva (2013; 2018) are the first known studies to explore the link between social security claiming decisions and household indebtedness. Using the HRS, the authors find that on average older adults with debt are more likely to work and less likely to receive social security benefits than those without debt. Indebted older adults are also more likely to delay fully retiring from the labor force and to delay claiming their benefits. The impact of debt on work and retirement decisions also differs by the type debt. Butrica and Karamcheva (2013; 2018) show that mortgage debt consistently has a stronger effect on labor supply and social security receipt than does other debt.10 Similarly, Lahey et al. (2006) report that higher mortgage balances
positively influence the decision to unretire. For those who are initially forced to retire, increases in the mortgage balance, reflecting home equity withdrawals, influence the decision to stay retired. Unfortunately the survey that those studies used did not separately identify student debt. To get around this, Handwerker (2011) indirectly controls for student debt using the total number of children who ever attended college and the total number of those whose college expenses are paid for by the parents. The author concludes that parents are more likely to work, less likely to collect social security benefits, and less likely to report that they are retired, if they are currently paying for a child's college education.
In what follows, we build on Butrica and Karamcheva (2013; 2018) and use the SCF from 1989-2016 to analyze trends in debt among older households between 1989 and 2016 and the relationship between debt, work, and retirement decisions. In addition, we separately examine the role of categories of debt such as credit card and student loan debt. The SCF is a nationally representative cross-sectional survey which is undertaken every three years by the Board of Governors of the Federal Reserve System in cooperation with the Statistics of Income Division of the Internal Revenue Service. The survey includes detailed information on families’ balance sheets, pensions, income, work, retirement status, social security receipt, and demographic characteristics.
Particularly relevant to our study is the information on mortgage debt, credit card balances, student debt, other debt, financial assets, housing wealth, and income. Mortgage debt is the outstanding mortgage on a primary residence; credit card debt refers to credit card balances carried over from one month to the next; student debt refers to loans for educational expenses (including for one’s children’s education); and other debt comprises of any other loans including vehicle loans, loans against pensions, outstanding mortgage on a secondary residence, other lines of credit, other installment loans, life insurance policy loans, and miscellaneous. The net worth (or wealth) concept in our analysis refers to marketable wealth, defined as the difference between a family’s marketable assets and its debt. Marketable assets are those that can be bought or sold and can outlive an owner. Nonmarketable assets such as defined benefit pension plans and future social security benefit payments are not included in the analysis.
The unit of analysis in our descriptive results is the family (or primary economic unit), whereas the unit of analysis in the regression results is the individual.11 This choice is motivated
limited information on the ownership of assets and liabilities within the primary economic unit, it is generally not possible to separately identify the financial characteristics of each individual in a household. Moreover, financial resources are typically shared within a household. That is why the estimated statistics of net worth, debt, and leverage are calculated on a family basis. The SCF does collect separate information on the employment, social security benefit receipt, retirement, and retirement expectation of both spouses in a household, which allows us to examine those decisions on an individual basis.
Both the descriptive and multivariate regression results restrict the sample to adults age 55-70. The results related to social security benefit receipt restrict the sample to adults age 62-70, because they are age-eligible to collect social security retired worker benefits, and the results related to retirement expectations restrict the sample to adults age 55-61 who can be considered to be of pre-retirement age. The age restriction in the family-level analysis is applied based on the age of the family head, regardless of the age of the spouse, and in the individual-level regression analysis the age restriction is applied based on the age of each individual. In addition, in the regression results, we restrict the sample to non-disabled persons who have at least 10 years of work experience, to exclude from the analysis individuals with weak lifetime attachment to the labor force for whom work, retirement, and social security claiming are less relevant. To mitigate the effect of outliers, we also drop observations in the top 0.5 percent of the distribution of per person debt (that corresponds to per person debt of $10 million or higher). We use the Consumer Price Index research series using current methods (CPI-U-RS) deflator to bring all values to 2016 dollars.
Work and retirement status are defined based on each respondents’ reported work status. An individual is considered to be working if he or she responds positively to being employed by
someone else or is self-employed. Retirement status is determined based on the individual’s response to whether he or she is retired, excluding those who indicate that they are not in the labor force. Individuals are also asked if they receive social security benefits, where we only consider social security retirement and survivors’ benefits and exclude disability or Supplemental Security Income (SSI) benefits.
The SCF oversamples families at the top of the wealth distribution to ensure representative coverage of the entire US population. In all descriptive and regression results we use the SCF survey weights in order to get population estimates.12,13
Methodology
Model specification. Our empirical specification examines how household debt affects retirement decisions by analyzing the relationship between debt and the decision to work, to retire, or to collect social security benefits. More specifically, we model the propensity to work, to collect social security benefits, or to be retired as a function of personal demographic and socio-economic characteristics 𝑿𝑿𝒊𝒊, and debt 𝑫𝑫𝑫𝑫𝑫𝑫𝑫𝑫𝒊𝒊 in a latent variable framework:14
𝑦𝑦𝑖𝑖∗ =𝑿𝑿
𝑖𝑖𝛽𝛽+𝐷𝐷𝐷𝐷𝐷𝐷𝐷𝐷𝑖𝑖𝛾𝛾+𝜀𝜀𝑖𝑖, where𝑦𝑦𝑖𝑖 = 1[𝑦𝑦𝑖𝑖∗> 0].
The regression analysis transforms the financial variables (net worth, debt, and other income) to a per person basis, by diving the family level values by 2 for individuals who are part of a couple. In addition, we use the inverse hyperbolic sine (IHS) transformation for other income, net worth, and value of debt. Except for very small values, the IHS approximates a logarithmic transformation and has the same interpretation. However, unlike a logarithmic transformation which is undefined for zero and negative values, the IHS is defined on the entire real line and
provides us with a way to estimate a percent change specification without excluding households with zero or negative net worth and those with zero debt, while also helping reduce the influence of outliers.15
Endogeneity concerns. The above-mentioned specifications assume that the incidence and amount of household debt are exogenous, but there are many reasons to think that indebtedness is not strictly exogenous either due to reverse causality or omitted variable bias. For example, reverse causality would be an issue if individuals who plan to spend many more years in the labor force and retire later are also the ones who are more likely to take out a bigger mortgage (or another loan) as they expect to have more time to repay it. Analogously, individuals already receiving social security benefits may be more likely to borrow or buy goods on credit since they can rely on social security income to cover their debt service payments. Omitted variable bias would be an issue if, for example, unobservable characteristics such as risk-aversion determine both how leveraged a person is and how long he or she decides to remain in the work force.
To address such potential endogeneity concerns, we propose using a set of instruments that are correlated with debt but are assumed to be uncorrelated with the individual’s propensity to work, to retire, or claim benefits.16 Specifically, we use the answers to several SCF survey
questions that relate to individuals’ attitudes towards debt.17 We use those debt attitudes to
instrument for the presence of any debt and the log level of total debt in our main specifications.18
Unfortunately, we do not have the necessary instruments to estimate such models on the detailed categories of debt.19
We estimate linear two-stage least squares (2SLS) as well as nonlinear instrumental variable procedures. The 2SLS models ignore the binary nature of the outcome variable in the structural equation but are easily interpretable and provide us with benchmark results. The two
nonlinear instrumental variable procedures that we estimate differ depending on whether the endogenous regressor is binary or continuous. To model the endogeneity of having debt, we estimate the latent variable model of our outcome variable (work, benefit receipt, or retirement) jointly with a latent variable model that determines the presence of debt, in a bivariate Probit setup.20 To deal with a continuous endogenous variable such as the log of the dollar value of the
debt, we apply a control function approach.21
Results
We begin with descriptive analyses that document trends in debt among older households between 1989 and 2016, including the share of households with debt, the amount and sources of debt, and the degree of indebtedness. We then present multivariate analyses that analyze the relationship between debt and work and retirement decisions.
Descriptive analyses. Leading up to the Great Recession of 2007, Americans were increasingly likely to have debt at older ages (Table 1, Panel A). The share of older households with debt increased steadily from 64 percent in 1989 to 77 percent during the Great Recession of 2007, declined slightly to 75 percent after 2007, and remained around there until 2016. Among households with debt, both the mean and median value of debt has declined somewhat since their peak right after the recession. Still, between 1989 and 2016, the mean value of debt more than doubled—from $48,800 to $125,300—and the median value more than quadrupled—from $14,500 to $61,000.
Table 1 here
Consistent with other data sources, we find that older households are increasingly likely to have all sources of debt—including mortgages, credit card balances, and student loans—and the
amount of debt they carry in these sources has also risen. Between 1989 and 2016, the share of households age 55-70 with mortgages, including home equity loans and HELOCs, increased 44 percent from 32 to 46 percent. The median amount of mortgage debt among those with mortgage debt, more than tripled over this period, increasing from $28,900 to $90,000. Although the share of older households who are homeowners has remained around 80 percent, the speed with which those households pay off their mortgages has slowed over time, with older homeowners in 2010 owning a smaller share of their homes than their counterparts in 1989—66 versus 89 percent (not shown). Since 2010, however, the share of older households with mortgages and the average amount of mortgage debt has declined, suggesting that the trend may be reversing.
Credit card debt and student loans also increased over the period. The share of older households with credit card debt increased 35 percent, from 31 to 42 percent, and the median credit card balance doubled from $1,400 to $2,800 (see Table 1, Panel A). Of the sources of debt we examined, the share of older households carrying student loan debt increased the most over this time period; it more than tripled from 3 to 10 percent, and the median amount owed more than tripled from $5,400 to $18,000.22
Overall, mortgages were the most significant source of debt for older households in 2016. They represented 69 percent of all debt, credit card debt accounted for 3 percent, student loans comprised 4 percent, and other debt accounted for 25 percent of total debt. However, the composition of debt varies notably by net worth (see Table 1, Panel B).
The share of total debt from mortgages was only 32 percent for households with negative net worth, but 67 percent for those in the bottom tercile, 77 percent for those in the middle tercile, and 66 percent for those in the top tercile. The share of total debt from student loans was 47 percent for households with negative net worth, but only 13 percent for those in the bottom tercile, 4
percent for those in the middle tercile, and 1 percent for those in the top tercile. Finally, the share of total debt from other sources was only 18 percent for households with negative net worth, 15 percent for those in the bottom tercile, and 14 percent for those in the middle tercile, but 31 percent for those in the top tercile.
It may seem surprising that older Americans have student debt. Upon closer examination, we find that, in the years following the most recent recession, older households with net worth in the bottom and middle terciles were most likely to still have student debt. Although student loan debt became more prevalent at all wealth levels, the increase was the highest among older households in the bottom and middle of the wealth distribution. Between 1989 and 2016, the share of households with student loan debt increased from 2 to 12 percent among households in the bottom tercile, from 4 to 12 percent among households in the middle tercile, and from 3 to 5 percent among households in the top tercile (not shown).
Moreover, households at the bottom wealth tercile were almost equally likely to have student loan debt for their children’s education as they were for their spouse’s education or their own (Table 1, Panel C). In contrast, those in the middle tercile and in the wealthiest households mostly had student loans for their children’s education.
Among households with student loans, the average amount owed does not vary much by the source of student debt or by household wealth (Table 1, Panel C). On average, households in the bottom of the wealth distribution with student loans for their own education owe about $40,500, whereas those in the top tercile owe about $30,000. The mean value of debt for children’s education is $33,600 for households in the bottom tercile and $38,700 for those in the top tercile.
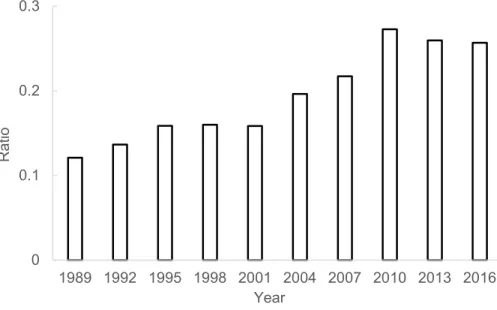
Next, we consider the degree of older Americans’ indebtedness using different measures, including the debt-to-asset ratio, debt-to-income ratio, and the share with negative net worth. These
measures also indicate that households age 55-70 have become increasingly leveraged over time. Between 1989 and 2016, their average debt-to-assets ratio increased from 12 to 26 percent (Figure 1, Panel A) and their average debt-to-income ratio increased from 45 to 107 percent (not shown). Even considering their usual income, we find that older households’ average debt-to-usual-income ratio increased from 57 to 98 percent between 1995 and 2016 (not shown). All three measures reached a peak right after the most recent recession and have declined somewhat since then. Figure 1 here
When comparing how leveraged households of different birth cohorts are at similar ages, we see higher average debt-to-asset ratios at almost every age for households in more recent cohorts compared with their counterparts in earlier cohorts (Figure 1, Panel B). A similar pattern emerges when we examine trends in average debt-to-income ratios (not shown). However, the debt-to-asset ratios of households headed by individuals born in the 1950s and later have been declining continuously since the most recent recession, suggesting a potential change in the trend (Figure 1, Panel B). The average debt-to-asset ratio, however, masks what is going on among households with negative net worth. While the share of households with negative net worth increased only slightly between 1989 and 2016 (from 3 to 5%), the level of negative net worth increased dramatically—from -$9,500 to -$24,800 at the mean and from -$1,600 to -$7,100 at the median (not shown). The driving factors behind this trend are the increase in negative home equity and other debt, and most recently the increase in student debt.
We also find that older adults with outstanding debt are significantly more likely to work and less likely to be retired—at all ages—than those without debt (see Figure 2). Those with debt are also slightly less likely to receive social security benefits than those without debt.
Multivariate analyses. To examine the relationship between household debt and retirement behavior in more detail, we next estimate multivariate models that allow us to control for factors that likely influence older adults’ labor supply, benefit receipt, and retirement decision. Even so, we find that having debt and the amount of debt (logged) are both positively and significantly correlated with respondents’ propensity to work, and negatively and significantly correlated with their likelihood of being retired (see Table 2).23 They are also negatively correlated with the
probability of receiving social security benefits, but only the amount of debt is marginally statistically significant.24
We find that those with debt are 11.2 percentage points more likely to work and 10.3 percentage points less likely to be retired, compared to those without debt (Table 2, columns 1 and 9). In addition, the amount of debt also has a statistically significant, although small in magnitude impact on older adults’ behavior. On average, a 100 percent increase (or doubling) of per person debt increases the likelihood of working by 1.1 percentage point and reduces the likelihood of being retired by 1.0 percentage point (Table 2, columns 3 and 11). For an individual with $53,000 per person debt, the average in the sample, a $10,000 increase translates to an increase of 0.2 percentage points in the propensity to work and a decrease of 0.2 percentage points in the likelihood of being retired, or a 0.3 percent increase in work and 0.5 percent decline in retirement. Table 2 here
Among the sources of debt, having mortgage debt consistently has a somewhat stronger impact on working and retirement than having outstanding credit card debt, student loans, or other debt. Older adults with a mortgage are 5.8 percentage points more likely to work, 3.1 percentage points less likely to receive social security benefits, and 4.8 percentage points less likely to be retired (Table 2, columns 2, 6, and 10). Aside from housing debt, having credit card debt and other
debt also have a significant impact on older adults’ labor supply, raising their probability of working by 4.5 and 4.3 percentage points respectively. These sources of debt also reduce older adults’ likelihood of being retired, although credit card debt has a somewhat smaller effect than other debt—3.0 and 4.4 percentage points, respectively. Although student loans are negatively correlated with being retired, their impact is not statistically different from zero. Distinct from all other categories of debt, having credit card debt appears to increase the likelihood of receiving social security benefits—by 4.5 percentage points.
Among the sample of individuals with debt, effects are somewhat stronger. A doubling of per person debt increases the probability of working by 1.5 percentage points and reduces the probability of being retired by 1.4 percentage points (Table 3, columns 1 and 11). For an individual with $32,000 per person in debt, the median amount for those in the sample with debt, a $10,000 increase translates to an increase of 0.5 percentage points in the propensity to work and a decrease of 0.5 percentage points in the likelihood of being retired, or a 0.7 percent increase in work and 1.4 percent decline in retirement.
We also find that the amount of debt is negatively associated with claiming social security benefits among households with debt (Table 3, column 6). A 100 percent increase (or doubling) of per person debt is associated with a 1.3 percentage point lower probability of receiving benefits. For an individual with $24,000 per person in debt, the median amount for those in the sample with debt, a $10,000 increase in debt reduces the likelihood of receiving benefits by 0.6 percentage points or 0.9 percent.25
Table 3 here
Examining how the value of various categories of debt affects older adults’ behavior reveals that the level of mortgage and credit card debt has considerably stronger impact than the
level of other debt or student loans. Despite some variation in coefficient estimates, overall we find that a 1 percent increase in the level of debt for each of these categories has a similar in magnitude effect on work, benefit receipt, or retirement as does a 1 percent increase in the amount of overall debt. In that sense, we find that the effect of debt is roughly the same regardless of which category it falls into.
Nevertheless, because a 1 percent increase in some debt categories (e.g., mortgages) corresponds to a larger dollar amount than a 1 percent increase in other categories of debt (e.g., credit card debt), a dollar increase in debt has a stronger impact on work or retirement when it comes from credit cards than from mortgages or other debt. For example, a $10,000 increase in credit card debt for a person with the median amount of credit card debt increases the likelihood of working by 9.4 percentage points, reduces the probability of receiving social security benefits by 9.1 percentage points, and reduces the likelihood of being retired by 11.0 percentage points. The corresponding effect of a $10,000 increase in mortgage debt for a person with the median amount of mortgage debt is a 0.3 percentage points higher propensity to work, 0.1 percentage points lower propensity to receive benefits (though not significant), and 0.4 percentage points lower propensity to be retired. Finally, the corresponding effect of a $10,000 increase in other debt for a person with the median amount of other debt is a 1.1 percentage points higher propensity to work, 1.7 percentage points lower propensity to receive benefits, and 0.9 percentage points lower propensity to be retired.
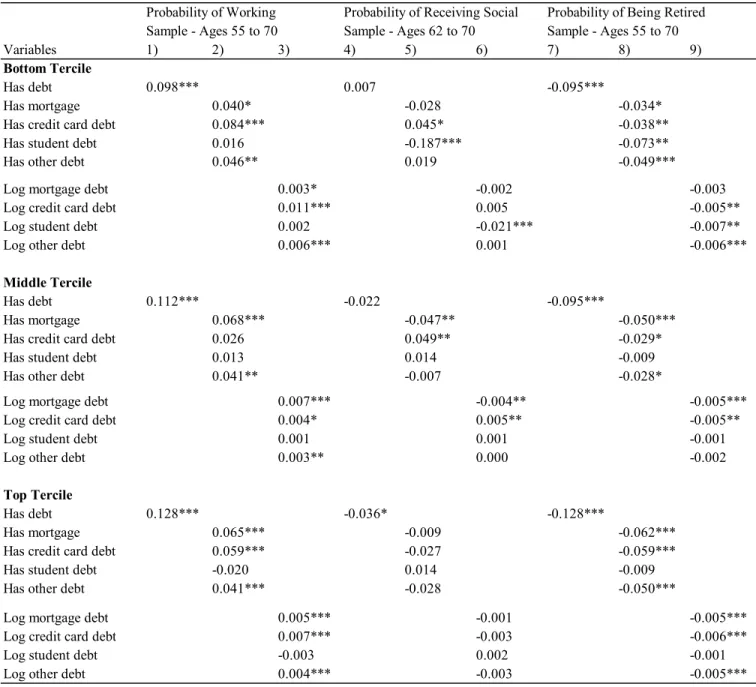
To test whether the effect of debt on work, retirement, and benefit receipt varies for households with different net worth, we perform the multivariate analyses separately for households in the bottom, middle, and top terciles of wealth. Results show that having debt increases the probability of working and reduces the probability of retirement for individuals
regardless of net worth (see Table 4). Although the coefficient estimates appear somewhat higher in magnitude for individuals in the top tercile, an explicit test on the difference in coefficients between net worth terciles through the use of interaction terms, finds no statistically significant differences (see Appendix Table A2). The only exception is the presence of student debt which has a strong negative effect on social security benefit receipt and retirement for individuals in the bottom tercile. In contrast, student debt does not seem to influence the work and retirement decisions of respondents in the middle and top wealth terciles. As we saw earlier, individuals in the bottom tercile are most likely to carry student loan debt into their retirement years.
Table 4 here
We also find that the effect of the amount of debt on work and retirement is comparable in magnitude and significance across net worth terciles (see Appendix Table A2). Again, the only exception is the level of student debt which is negatively linked the likelihood of receiving social security benefits and being retired among individuals in the bottom tercile of wealth, but not for individuals in the middle or highest wealth terciles.
To better capture how the debt and assets in a household’s portfolio affect retirement, we examine a few alternative measures of indebtedness reflective of household overall levels of financial strain.26 These measures reflect household leverage (debt-to-asset ratio), whether they
have more debt than assets (that is, negative net worth), and whether they have more debt than what can be covered by their liquid (or financial) assets. The estimated relationship between household’s leverage and the probability of work or retirement is statically significant, but with respect to social security receipt it is positive and significant, suggesting that a doubling of one’s leverage ratio is associated with a 4 percentage points higher propensity of receiving benefits on average (Table 5). Moreover, the results are driven primarily by individuals who have more debt
than financial assets. They are about 3.5 percentage points more likely to receive social security than those who have no debt, whereas individuals with debt but also enough financial assets to cover that debt are less likely to have claimed their social security benefits. With respect to the probability of working and being retired, we find that people with more debt than financial assets are more likely to be working and less likely to be retired than individuals who have enough financial assets to cover their debt, and individuals with no debt are least likely to work and most likely to be retired.
Table 5 here
Focusing only on workers of pre-retirement age—those between age 55-61—we also examine the relationship between indebtedness and retirement expectations (see Table 6). Respondents in the SCF currently working full-time are asked to identify the age at which they expect to stop working full-time and the age at which they expect to stop working altogether.27
Controlling for other factors, we find that having debt is associated with an expectation of about an extra 2.5 months of full-time work and about an extra year of overall work on average. The effect is stronger for individuals who have negative net worth (about two more years of work) and also for individuals whose debt is more than the value of their financial assets. Compared to workers who don’t have any debt, those with more debt than financial assets expect to spend 1.4 years more working full-time and 2.3 years more working overall on average. How leveraged a worker is also affects his expected age of retirement: a doubling of the leverage ratio is associated with an additional 2.6 years of expected years of work.
Table 6 here
Appendix Table A3 presents the results of an IV model on work, benefit receipt, and retirement, respectively, where we instrument the presence of debt and the log amount of debt
using attitudes towards borrowing and buying things on credit. Overall, estimated coefficients on debt and the level of debt retain their expected direction and significance from the previously estimated specifications on work and retirement. The coefficients on the presence of debt also increase considerably, whereas the coefficients on the log amount of debt remain similar in magnitude to the non-IV models. In the social security specifications, the coefficient estimates are not statistically significant.28, 29
Conclusion
Our earlier work used data from the HRS to show that Americans are increasingly likely to have debt at older ages (Butrica and Karamcheva 2013). We hypothesized that more indebted households, to the extent that they are more likely to face liquidity constraints, could respond to those constraints by increasing their labor supply (that is delaying retirement), claiming their social security benefits early, or both. Further, the more binding those liquidity constraints are (that is the more indebted the individual), the higher the individual’s incentive to either increase work, claim social security early, or both. Yet that prior study did not find that household debt was associated with early benefit claiming. Instead, we suggested that older adults may be dealing with their indebtedness by delaying their retirement and social security benefit receipt, with most of the effect driven by mortgage debt and less so by other forms of debt.
This chapter asks whether the trends in older households’ debt observed in the earlier work changed after the Great Recession. We also re-examine the relationship between household debt and retirement behavior while expanding the analysis to include detailed categories of debt not typically available in other surveys (such as credit card and student loan debt). We find, using the
SCF, that the prevalence as well as the absolute and relative value of debt among adults age 55-70 rose considerably between 1989 and 2016. This trend is likely to continue, recent cohorts appear to be more leveraged at every age leading up to and in retirement, compared to older cohorts at similar points in time. However, unlike the HRS, the SCF data suggests a slowing down or a potential reversal of the trend in the years following the Great Recession. With the exception of student loan debt which has been increasing sharply since 2001, the average levels of other categories of debt have declined somewhat for households in this age range particularly after 2010. We also confirm findings from the HRS that some older adults are dealing with their indebtedness by working more and delaying retirement. We document that both the presence and level of debt, among those with debt, are associated with a higher likelihood that older adults work and lower likelihood that they are retired. Additionally, those of pre-retirement age anticipate spending more years working, the more debt they carry relative to their assets. We also find that, among older adults with debt, the effect of a percentage increase in the amount of debt on the propensity to work or retire is similar, regardless of the type of household debt. Yet, because households carry considerably less credit card debt than mortgage or other debt on average, those results translate to a dollar increase of credit card debt having a considerably larger effect on work, and retirement than do similar dollar increases of mortgage or other debt. Because student debt is still relatively rare among older households and is concentrated at the bottom of the wealth distribution, we only find statistically significant effects of student debt on retirement behavior for those in the bottom tercile of the wealth distribution.
Our findings regarding the relationship between household debt and social security benefit receipt are more nuanced. There is a negative association between the level of debt and benefit receipt among those who have debt, but the overall association between benefit receipt and the
presence of debt is insignificant. Individuals who have mortgage and other debt are less likely to have claimed their benefits, but those who have credit card debt are more likely to have done so. Moreover, the degree of leverage (debt to asset ratio) is on average positively associated with social security receipt. We also find that, compared to households with no debt, those with some degree of indebtedness (households whose financial assets cover their debt) are more likely to delay claiming their benefits, while households with a high degree of indebtedness (households whose financial assets do not cover their debt) appear more likely to claim early.
The rise in debt among older Americans is potentially concerning because the likelihood of experiencing a negative event that jeopardizes ones’ financial security increases with age. The onset of health problems, losing a job, or becoming widowed or divorced can have serious negative effects on retirement assets. Additionally, time spent caregiving for older parents or frail spouses can leads to slower asset building when approaching retirement, and an increased risk of falling into poverty (Butrica and Karamcheva 2014). Older adults who are particularly unlucky might experience multiple negative events at the same time. Johnson et al. (2006) find that three-quarters of adults age 51-61 and more than two-thirds of those age 70+ experience a negative event over a nine- or 10-year period and simultaneously have a large decline in wealth. Starting retirement with more debt could exacerbate the impact of impending negative shocks. Such shocks could be particularly detrimental for people with low incomes since they are disproportionately more likely to be over-indebted (see Lusardi et al. 2020). Further research into debt, debt management, and household behavior would help policymakers design policies to address retirement security in an aging society.
Barbara A. Butrica is a Senior Fellow at the Urban Institute in Washington, DC and Nadia S. Karamcheva is an Economist at the Congressional Budget Office in Washington, DC. The findings and conclusions are solely those of the authors and do not represent the views of the Congressional Budget Office, any agency of the Federal Government, or the Urban Institute, its board, or its sponsors. The authors would like to thank Bret Hammond, Joshua Mitchell, Kevin Moore, John Sabelhaus, Jason Seligman, and the participants of the 2019 Symposium of the Pension Research Council for thoughtful comments and suggestions. All errors are our own.
References
Almenberg, J., A. Lusardi, J. Save-Soderbergh, and R. Vestman (2018). ‘Attitudes Toward Debt and Debt Behavior.’ NBER Working Paper No. 24935. Cambridge, MA: National Bureau of Economic Research.
Belkar, R., L. Cockerell, and R. Edwards (2007). ‘Labour Force Participation and Household Debt.’ Research Discussion Paper No. 2007-05. Sydney: Reserve Bank of Australia. Begley, J. and S. Chan (2018). ‘The Effect of Housing Wealth Shocks on Work and Retirement
Decisions.’ Regional Science and Urban Economics, 73: 180-195.
Bricker, J., L. J. Dettling, A. Henriques, J. W. Hsu, L. Jacobs, K. B. Moore, S. Pack, J.
Sabelhaus, J. Thompson, and R. A.Windle (2017). ‘Changes in U.S. Family Finances from 2013 to 2016: Evidence from the Survey of Consumer Finances.’ Federal Reserve Bulletin, 103: 1-40. (September).
Brown, J. R., C. C. Coile, and S. J. Weisbenner (2010). ‘The Effect of Inheritance Receipt on Retirement.’ The Review of Economics and Statistics, 92(2): 425-434.
Brown, M., A. Haughwout, D. Lee, J. Scally, and W. van der Klaauw (2019). ‘The Graying of American Debt.’ In O.S. Mitchell and A. Lusardi (eds.), Remaking Retirement: Debt in an Aging Economy. Oxford, UK: Oxford University Press, pp. xxx-xxx.
Brown, M., A. Haughwout, D. Lee, J. Scally, and W. van der Klaauw (2015). ‘The Student Loan Landscape.’ New York, NY: Federal Reserve Bank of New York.
Burbidge, J. B., L. Magee and A. L. Robb (1988). ‘Alternative Transformations to Handle
Extreme Values of the Dependent Variable.’ Journal of the American Statistical Association, 83(401): 123-127.
Report, 21(2): 22-26.
Butrica, B. A. and N. S. Karamcheva (2018). ‘In Debt and Approaching Retirement: Claim Social Security or Work Longer.’ AEA Papers and Proceedings, 108: 401-406.
Butrica, B. and N. S. Karamcheva (2014). ‘The Impact of Informal Caregiving on Older Adults’ Labor Supply and Economic Resources.’ Department of Labor Policy Report.
Butrica, B. A., and N. S. Karamcheva (2013). ‘Does Household Debt Influence the Labor Supply and Benefit Claiming Decisions of Older Americans?’ Working paper 2013-22. Chestnut Hill, MA: Center for Retirement Research.
Butrica, B. A. and S. Mudrazija (2016). ‘Home Equity Patterns among Older American Households.’ Washington, DC: Urban Institute.
Butrica, B. A., K. E. Smith, and E. Steuerle (2007). ‘Working for a Good Retirement.’ In D. B. Papadimitriou, ed. Government Spending on the Elderly. New York, NY: Palgrave Macmillan, pp.
141-174.
Case, A., and A. Deaton (2015). ‘Rising Morbidity and Mortality in Midlife among White Non- Hispanic Americans in the 21st Century.’ Proceedings of the National Academy of Sciences, 112(49): 15078–83.
Cesarini, D., E. Lindqvist, M. J. Notowidigdo, and R. Ostling (2017). ‘The Effect of Wealth on ‘Individual and Household Labor Supply: Evidence from Swedish Lotteries.’ American Economic Review, 107(12): 3917-3946.
Chan, S., and A. H. Stevens (2004). ‘How Does Job Loss Affect the Timing of Retirement?’ Contributions to Economic Analysis and Policy, 3(1): 1-24.
Coile, C. (2018). ‘Working Longer in the U.S.: Trends and Explanations.’ NBER Working Paper No. 24576. Cambridge, MA: National Bureau of Economic Research.
Del Boca, D. and A. Lusardi (2003). ‘Credit Market Constraints and Labor Market Decisions.’ Labour Economics, 10(6): 681–703.
Federal Reserve Bank of New York. (2019). ‘Quarterly Report on Household Debt and Credit: 2018:Q4.’ New York, NY.
French, E. and J. B. Jones (2011). ‘The Effects of Health Insurance and Self-Insurance on Retirement Behavior.’ Econometrica,79(3): 693-732.
United States Government Accountability Office (GAO) (2014). Older Americans: Inability to Repay Student Loans May Affect Financial Security of a Small Percentage of Retirees. Testimony Before the Special Committee on Aging, U.S. Senate. GAO-14-866T. Washington, DC.
Goda, G. S., J. B. Shoven, and S. N. Slavov (2012). ‘Does Stock Market Performance Influence Retirement Intentions?’ Journal of Human Resources, 47(4):1055-1081.
Goldin, C. and L. F. Katz (2016). ‘Women Working Longer: Facts and Some Explanations.’ NBER Working Paper No. 22607. Cambridge, MA: National Bureau of Economic Research.
Handwerker, E. W. (2011). ‘Delaying Retirement to Pay for College.’ Industrial and Labor Relations Review, 64(5): 921-948.
Heckman, J. (1978). ‘Dummy Endogenous Variables in a Simultaneous Equation System.’ Econometrica, 46: 931-959.
Joint Center for Housing Studies of Harvard University (2014). ‘Housing America’s Older Adults: Meeting the Needs of an Aging Population.’ Cambridge, MA: Joint Center for Housing Studies of Harvard University.
Johnson, R. W. (2004). ‘Trends in Job Demands Among Older Workers, 1992–2002.’ Monthly Labor Review, July 2004.
Johnson, Richard W., Amy J. Davidoff, and Kevin Perese (2003). ‘Health Insurance Costs and Early Retirement Decisions.’ Industrial and Labor Relations Review 56(4): 716-729. Johnson, R. W., G. B.T. Mermin, and M. Ressenger (2007). ‘Employment at Older Ages and the
Changing Nature of Work.’ AARP Public Policy Institute Report No. 2007-20. Washington, DC: AARP.
Johnson, R. W., G. B.T. Mermin, and C. E. Uccello (2006). ‘When the Nest Egg Cracks: Financial Consequences of Health Problems, Marital Status Changes, and Job Layoffs at Older
Ages.’ Washington, DC: Urban Institute.
Johnson, R. W., R. G. Penner, and D. Toohey (2008). ‘Do Out-of-Pocket Health Care Costs Delay Retirement?’ The Retirement Policy Program Discussion Paper No. 08-02. Washington,
DC: Urban Institute.
Karamcheva, N. (2013). ‘Is Household Debt Growing for Older Americans?’ Program on Retirement Policy, Issue in Brief No.33. Washington, DC: Urban Institute.
Lahey, K. E., D. Kim, and M. L. Newman (2006). ‘Full retirement? An Examination of Factors That Influence the Decision to Return to Work.’ Financial Services Review, 15: 1–19. Lusardi, A., O. S. Mitchell, and N. Oggero (2020). ‘Financial Vulnerability of Americans in Later
Life and its Implications for Retirement Well-being.’ In O.S. Mitchell and A. Lusardi (eds.), Remaking Retirement: Debt in an Aging Economy. Oxford, UK: Oxford University Press, pp. xxx-xxx.
Lusardi, A., O. S. Mitchell, and N. Oggero (2018). ‘The Changing Face of Debt and Financial Fragility at Older Ages.’ AEA Papers and Proceedings, 108: 407-411.
Lusardi, A., and O. S. Mitchell (2016). ‘Older Women’s Labor Market Attachment, Retirement Planning, and Household Debt.’ GFLEC Working Paper Series, WP 2016-3.
Lyons, A. C. and T. Yilmazer (2005). ‘Health and Financial Strain: Evidence from the Survey of Consumer Finances.’ Southern Economic Journal, 71(4):873-890.
Mann, A. (2011). ‘The Effect of Late-Life Debt Use on Retirement Decisions.’ Social Science Research, 40: 1623-1637.
Masnick, G. S., Z. X. Di, and E. S. Belsky (2006). ‘Emerging Cohort Trends in Housing Debt and Home Equity.’ Housing Policy Debate,17 (3): 491–527.
Munnell, A. H., W. Hou, and A. Webb (2016). ‘Will the Explosion of Student Debt Widen the Retirement Security Gap?’ Issue Brief 16-2. Chestnut Hill, MA: Center for Retirement Research at Boston College.
Munnell, A. H. and S. A. Sass (2009). Working Longer: The Solution to the Retirement Income Challenge, Washington, DC: The Brookings Institution.
Ondrich, J. and A. Falevich (2014). ‘The Great Recession, Housing Wealth, and the Retirement Decisions of Older Workers.’ Public Finance Review, 44(1): 109-131.
Pence, K. M. (2006). ‘The Role of Wealth Transformations: An Application to Estimating the Effect of Tax Incentives on Saving.’ Contributions to Economic Analysis & Policy, 5(1), Article 20.
Smith, K. E., M. Favreault, B. Butrica, and P. Issa (2010). Final Report: Modeling Income in the Near Term, Version 6. Washington DC: Urban Institute.
Solon, G., S. J. Haider, and J. M. Wooldridge (2015). ‘What Are We Weighting For?’ Journal of Human Resources, 50(2):301-316.
Thorne, D., P. Foohey, R. M. Lawless, and K. Porter (2018). ‘Graying of U.S. Bankruptcy: Fallout from Life in a Risk Society.’ Indiana Legal Studies Research Paper No. 406. Available at SSRN: https://ssrn.com/abstract=3226574
Trawinski, L. (2020). ‘Older Americans and the Mortgage Market Crisis: An Update.’ In O.S. Mitchell and A. Lusardi (eds.), Remaking Retirement: Debt in an Aging Economy. Oxford, UK: Oxford University Press, pp. xxx-xxx.
Wooldridge, J. M. (2002). Econometric Analysis of Cross Section and Panel Data, Cambridge, MA: MIT Press.
Endnotes
1Authors’ calculations using data from the Bureau of Labor Statistics.
2However, Case and Deaton (2015) find evidence of increased mortality and morbidity among
middle-aged white non-Hispanic men and women.
3Authors’ calculations from Chart 20 (Federal Reserve Bank of New York 2019). 4Authors’ calculations from Chart 30 (Federal Reserve Bank of New York 2019).
5Individuals who claim social security benefits but continue to work are potentially subject to the
Retirement Earnings Test. Workers below the FRA face a benefit reduction of $1 for each $2 of earnings above an exempt amount, which in 2019 is $17,640. For workers above the FRA, the withholding rate was historically lower and the exempt amount higher. In addition, in 2000, the RET was eliminated for workers above the FRA. To account for these interacting effects, our models include a full set of age dummies and indicators of whether individuals are older than their FRA and whether they reach their FRA after 2000.
6 Authors’ calculations from Chart 2 data (Brown et al. 2015) and Chart 21 data (Federal Reserve
Bank of New York 2019).
7Authors’ calculations from Chart 21 (Federal Reserve Bank of New York 2019). 8Authors’ calculations from Chart 30 (Federal Reserve Bank of New York 2019). 9Authors’ calculations from Chart 29 (Federal Reserve Bank of New York 2019).
10The authors also find suggestive evidence that the effect of other debt is driven by credit card
debt and that the amount of debt impacts older adults’ work and benefit receipt most strongly if it is in the form of credit card balances. However, in that study, the data on credit card debt was restricted to only two years that also coincided with the timing of the Great Recession making the results less generalizable.
11Family is defined by the SCF as the ‘Primary Economic Unit’, or PEU in a household. The actual
unit of observation in the SCF is the PEU, which is somewhere between the Census ‘family’ and ‘household’ concepts. In this context, a family consists of a single person or a couple and all other people in the household who are financially interdependent with that person or couple. See the appendix to Bricker et al. (2017) for a precise definition.
12Whereas weighting in descriptive survey statistics is a widely-accepted practice, weighting in
regression analysis is more nuanced (see Solon et al. 2015). As a sensitivity test, we also estimated all models unweighted. Whereas the magnitude of the main coefficient estimates and their standard errors are smaller in the unweighted regressions, we did not observe any differences in direction or significance of the coefficient estimates. To mitigate potential biases due to heteroscedasticity or endogenous sampling (e.g., the SCF oversamples high income individuals) we consider the weighted models to be our preferred specifications.
13In addition, the SCF creates five imputations for variables that originally contained a missing
value code. This multiple imputation process results in five successive replicates of each original data record. All five replicates are used in our descriptive results. However, to avoid understating the standard errors and wrongly inflating the reported statistical significance in our regression results, we use only one implicate by observation.
14 Our default specification is a linear probability model, but results from an alternative Probit
specification are similar and available from the authors upon request. In addition to providing us with a valuable benchmark against which to compare the nonlinear model results, linear models also allow us to straightforwardly apply instrumental variables analysis. We do, however, also estimate Probit IV models that accommodate nonlinearity in both the outcome variable and the endogenous regressor.
15 The inverse hyperbolic sine (IHS) transformation is defined as ln(z+(z2+1)1/2) and is an
alternative to a log transformation. Except for very small values of z, it is approximately equal to ln(2)+ln(z) so it can be interpreted the same way as a logarithmic transformation. Unlike a log variable, the inverse hyperbolic sine is defined on the whole real line including negative values and zero. IHS(z) is symmetric function which is linear around the origin and approximates the logarithm in its right tail. For most positive values of z, the derivative of IHS(z) approximates the derivative of the log, 1/z. An alternative transformation that can handle both negative and positive values is the Box-Cox transformation. However, the IHS is preferable in our estimation because Box-Cox is not defined at zero. See Burbidge et al. (1988) and Pence (2006) for a discussion and application of the IHS.
16Endogeneity might also result from measurement error in our debt variables. The instrumental
variable models could help identification in that case as well, as long as the measurement error is classical.
17One question asks ‘In general, do you think it is a good idea or a bad idea for people to buy
things by borrowing or on credit?’. The individual can respond with ‘good idea’, ‘good in some ways, bad in others’, or ‘a bad idea’. Another set of question asks ‘For each of the reasons I read, please tell me whether you feel it is alright for someone like yourself to borrow money…’ Individuals can only respond with a ‘yes’ or a ‘no’ and the list of reasons includes ‘... to cover expenses of a vacation trip’, ‘…cover living expenses when income is cut’, ‘…to finance the purchase of a car’, ‘…to finance educational expenses’.
18Our choice of instruments is also informed by a recent study by Almenberg et al. (2018) who
19The cross-sectional nature of our data does not allow us to mitigate those endogeneity concerns
by applying techniques such as fixed effects models that control for endogeneity of the type of individual-specific time-invariant unobservable factors or event study analysis that would allow us to explore the variation in the timing of taking on debt and the timing of retirement or social security claiming. Such techniques were applied in earlier papers on debt and the timing of retirement and social security claiming using the Health and Retirement Study (Butrica and Karamcheva 2013; 2018).
20This specification was first proposed by Heckman (1978) and was also applied in Del Boca and
Lusardi (2003) to instrument the effect of the propensity to hold a mortgage on female labor supply in Italy.
21We implement this model using the ivprobit command in Stata; see Wooldridge (2002).
22 The share of older households with other debt also increased from 40 to 43 percent and the
median amount increased from $7,200 to $15,000 (not shown). Other debt includes debt secured by other residential properties, other lines of credit not secured by primary residences or real estate, installment loans (excluding student loans), and all other debt (e.g., loans against pensions or life insurance, margin loans, etc.).
23The regression coefficients have the expected signs and significance with respect to most control
variables in our model (available upon request). Specifications in which we control for total assets instead of net worth reveal similar results (see table A1 in the appendix).
24We have some concerns about how well we can identify social security receipt in the SCF and
whether the indicator that we use potentially conflates social security with SSI, dependents’ benefits, or railroad retirement benefits.
25 The hyperbolic sine transformation of the level of per person debt leads to an interpretation
similar to a log transformation, that is, how a percentage change in the value of debt affects work, benefit receipt, and retirement. To see how these results compare to Butrica and Karamcheva (2013), who use data from the HRS, we also estimated specifications with levels of per person debt in dollars, constraining both the work and social security receipt sample to those age 62-70. Those results, available from the authors upon request, show that a $10,000 increase in per person debt is associated with a 0.4 percentage points higher probability of working and 0.2 percentage point lower probability of receiving social security. The corresponding findings from Butrica and Karamcheva (2013) are similar but marginally stronger—0.7 percentage points increase in work and 0.3 percentage points decline in social security receipt.
26 Similar measures have been used in previous literature, for example when examining the
relationship between health and financial strain (Lyons and Yilmazer 2005).
27For individuals who answered that they will never stop working full-time or they will never stop
working altogether, we assumed that their expected age of death is their expected age of stopping work.
28The instruments seem to be strong determinants of the probability of having debt and the amount
of debt, as they pass all weak-instrument and over-identification tests. The Wald test of exogeneity, however, could not reject the null hypothesis of no endogeneity in the models with the weak exception of the specifications on the probability of working. Overall, that makes the non-IV models our preferred specifications.
29 We believe these instruments are theoretically sound and directly relate to the propensity to carry
debt, but they do not directly affect the respondent’s work, retirement or social security claiming other than through the debt channel. After testing different combinations of the debt attitude
variables our proposed final set of instruments consists of two variables which we found to be empirically the strongest: (1) a dummy variable separating individuals who think that it is a ‘good idea’ to borrow vs those who think that it is a ‘bad idea’ or ‘good in some ways, bad in others’ to borrow, and (2) a variable that combines the answers from the other four debt attitude questions into a score of 0 to 4. With these instruments, we pass the joint significant test in the first-stage regression with an F-stat of at least 10 in all specifications, and we fail to reject the Sargan-Hansen test of over-identifying restrictions, which boosts our confidence in the validity of the instruments. Yet a caveat is that the debt attitude questions in the SCF were asked only of the respondent. In order to keep both individuals of coupled households in the analysis, we assumed that the debt attitude of the spouse coincides with that of the respondent. (Notice that the presence and value of debt is defined on a household basis). To test the sensitivity of our result to this assumption, we estimated all specifications on just the respondents and we found almost no change in the significance or magnitude of the results. Ultimately the identifying assumption about the validity of the instruments is untestable. The debt attitude questions at best capture the respondent’s current attitude towards debt. Overall, the first stage regressions show a positive correlation between positive attitude toward buying thing on credit and the likelihood and amount of debt. However, the validity of the instruments might be compromised if current attitude toward debt is itself influenced by prior debt use or current work and benefit claiming status. Unfortunately, we are not able to test this hypothesis.
Panel A: Average ratio of debt to assets of older households by calendar year
Panel B: Average ratio of debt to assets by age and birth cohort
Figure 1. Average ratio of debt to assets among older households
Notes: Sample in Panel A includes households in which the head is between ages 55 and 70. The top 1 percent of the sample with the highest leverage ratios was excluded from the calculation in both figures to mitigate the effect of outliers.
Source: Authors’ calculations using 1989 - 2016 SCF. 0 0.1 0.2 0.3 1989 1992 1995 1998 2001 2004 2007 2010 2013 2016 R at io Year 0 0.2 0.4 0.6 0.8 1 20 25 29 33 37 41 45 49 53 57 61 65 69 73 77 81 85 89 R at io Age 1980-1989 1970-1979 1960-1969 1950-1959 1940-1949 1930-1939 1920-1929
Figure 2. Work, social security receipt, and retirement among older individuals, by age and debt Note: Sample includes individuals between ages 55 and 70. Debt is defined on a household basis. Source: Authors’ calculations using 1989-2016 SCF.
0 20 40 60 80 100 Per cent (% ) of P eopl e Age
Panel A. Percent of people working
No Debt 0 20 40 60 80 100 Per cent (% ) of P eopl e Age
Panel B. Percent of people receiving Social security
No Debt 0 20 40 60 80 100 Per cent (% ) of P eopl e Age
Panel C. Percent of people retired
No Debt