i
A Data-driven Framework for
Investigating Customer Retention
A thesis submitted for the degree of Doctor of
Philosophy
by
Chidozie Simon Mgbemena
Department of Computer Science
Brunel University
Abstract
This study presents a data-driven simulation framework in order to understand customer behaviour and therefore improve customer retention. The overarch-ing system design methodology used for this study is aligned with the design science paradigm. The Social Media Domain Analysis (SoMeDoA) approach is adopted and evaluated to build a model on the determinants of customer satisfaction in the mobile services industry. Furthermore, the most popular ma-chine learning algorithms for analysing customer churn are applied to analyse customer retention based on the derived determinants. Finally, a data-driven approach for agent-based modelling is proposed to investigate the social effect of customer retention.
The key contribution of this study is the customer agent decision trees (CADET) approach and a data-driven approach for Agent-Based Modelling (ABM). The CADET approach is applied to a dataset provided by a UK mo-bile services company. One of the major findings of using the CADET approach to investigate customer retention is that social influence, specifically word of mouth has an impact on customer retention. The second contribution of this study is the method used to uncover customer satisfaction determinants. The SoMeDoA framework was applied to uncover determinants of customer satis-faction in the mobile services industry. Customer service, coverage quality and price are found to be key determinants of customer satisfaction in the mobile
iii services industry. The third contribution of this study is the approach used to build customer churn prediction models. The most popular machine learn-ing techniques are used to build customer churn prediction models based on identified customer satisfaction determinants. Overall, for the identified deter-minants, decision trees have the highest accuracy scores for building customer churn prediction models.
ABBREVIATIONS
ABM: Agent Based Modelling
ABMS: Agent Based Modelling and Simulation
AUC: Area Under ROC
B2B: Business to Business
CADET: Customer Agent Decision Trees
CART: Classification and Regression Trees
CDR: Call Detail Record
CRISP-DM: Cross-Industry Standard Process-Data Mining
CRM: Customer Relationship Management
CSD: Customer Satisfaction Determinant
CSDO: Customer Satisfaction Determinants Ontology
DM: Data Mining
DSR: Design Science Research
DT: Decision Trees
FN: False Negative
FP: False Positive
GTM: Grounded Theory Method
IS: Information Systems
MNO: Mobile Network Operator
MSI: Mobile Services Industry
ROC: Receiver Operating Characteristics
OO: Object Oriented
SoMeDoA: Social Media Domain Analysis
SMS: Short Message Service
SNA: Social Network Analysis
SVM:Support Vector Machine
TN: True Negative
List of Figures
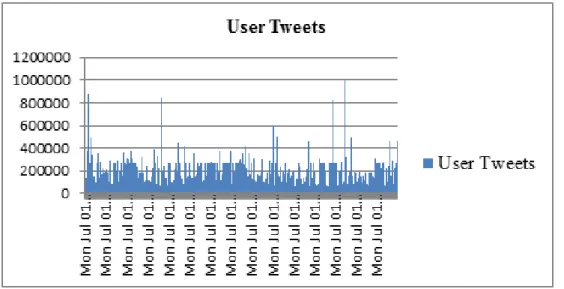
1.1 Overview of the Thesis . . . 18 3.1 DSR Phases . . . 43 3.2 Research Iterations in line with DSR . . . 47 4.1 Tweet frequency from 8am to 8pm on Wednesday 3rd July. . . . 64 4.2 Tweet frequency from 8am to 8pm on Saturday 29th June . . . 64 4.3 Tweet frequency from 8am to 8pm on Monday 1st July . . . 65 4.4 Tweet frequency from 8am to 8pm on Tuesday 2nd July . . . . 65 4.5 Daily Sentiment Analysis scores . . . 67 4.6 The process of importing and categorising Tweets into Nvivo10 69 4.7 Results derived from the first round of performing word
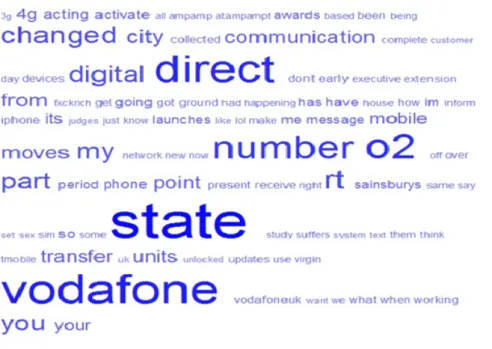
fre-quency on tweets . . . 69 4.8 Results derived from the second round of performing word
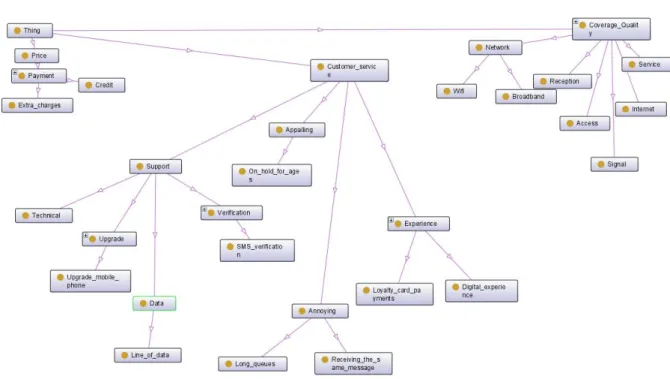
fre-quency on tweets . . . 70 4.9 The process of deriving CSDs . . . 72 4.10 Customer satisfaction determinants ontograph (CSDO)- An
on-tograph that shows the relationship between CSDs and related words . . . 73 4.11 Customer satisfaction determinant model . . . 78
LIST OF FIGURES vii
5.1 Decision Tree Classification Process . . . 83
5.2 An example of the ROC Curve . . . 90
5.3 An example of the Lift Curve . . . 91
5.4 Graphic representation of CSDs derived from iteration one . . . 95
6.1 An example of deriving attributes for the CADET approach . . 117
6.2 The CADET Model . . . 118
6.3 Conceptual Architecture for the CADET Approach and the TEA-SIM Tool . . . 121
6.4 Decision Tree Analysis . . . 125
6.5 Init.json File . . . 126
6.6 Model.json File . . . 126
6.7 Stepper function . . . 127
6.8 Agent Interaction Process . . . 127
7.1 Data-driven Simulation Framework . . . 141
7.2 CADET Approach in R . . . 142
7.3 ROC curves for Customer Service (Twitter Dataset) . . . 163
7.4 ROC curves for Coverage Quality (Twitter Dataset) . . . 163
7.5 ROC curves for Coverage Quality (Twitter Dataset) . . . 163
7.6 ROC curves for Customer Service (Twitter Dataset) . . . 164
7.7 ROC curves for Coverage Quality (Twitter Dataset) . . . 164
7.8 ROC curves for Coverage Quality (Twitter Dataset) . . . 164
7.9 ROC curves for Customer Service (Telco Dataset) . . . 165
7.10 ROC curves for Coverage Quality (Telco Dataset) . . . 165
7.11 ROC curves for Coverage Quality (Telco Dataset) . . . 166
7.12 ROC curves for Customer Service (Telco Dataset) . . . 166
LIST OF FIGURES viii 7.14 ROC curves for Coverage Quality (Telco Dataset) . . . 167 7.15 Snapshot of R code for Churn Analysis . . . 168
List of Tables
2.1 Review of significant studies on customer churn on mobile services 32
3.1 Research Framework (March and Smith, 1995) . . . 40
3.2 DR Artefact Evaluation Criteria (von Alan et al., 2004) . . . 45
3.3 Steps for conducting iteration 1 . . . 49
3.4 Steps for conducting iteration 2 . . . 52
3.5 Steps for conducting iteration 3 . . . 56
4.1 The SoMeDoA Research Framework (Bell and Shirzad, 2013) . . 61
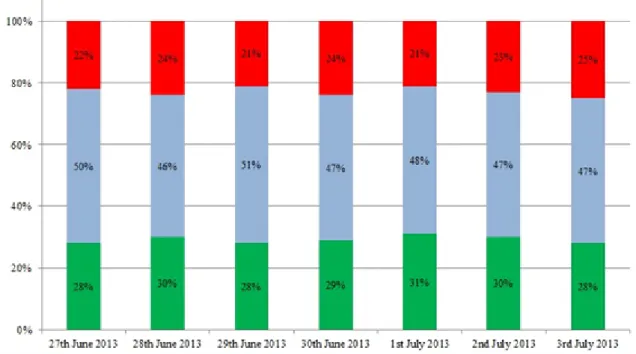
4.2 Distribution of sentiment score for MNOs . . . 66
4.3 Distribution daily sentiment scores . . . 67
4.4 Senti-Average of the derived Themes (CSDs) . . . 76
5.1 An Example of Logistic Regression on Customers and their probability to Churn . . . 85
5.2 Confusion Matrix . . . 87
5.3 Confusion Matrix for lift chart example . . . 91
5.4 CSD and related terms . . . 94
5.5 Telco Dataset Description . . . 97
5.6 Comparison of Decision Trees techniques for predicting churn on the Twitter and Telco datasets . . . 100
LIST OF TABLES x
5.7 Logistic Regression Churn Prediction Results . . . 102
5.8 SVM churn prediction results . . . 103
5.9 Model Comparison on Twitter and Telco Datasets . . . 104
5.10 Lift scores on CSDs for Twitter and Telco datasets . . . 106
5.11 AUC scores on CSDs for Twitter and Telco datasets . . . 107
5.12 Limitations of Data for churn analysis (Hassouna et al., 2015) . 108 6.1 Steps to identifying Customer Types from DT . . . 116
6.2 Steps for Decision Tree Analysis . . . 124
Dedication
This thesis is dedicated to my Dad and my Mum for their endless support and prayers in making sure that I complete my PhD.
Declaration
The following papers have been published as a result of the research conducted in this thesis.
• Mgbemena C,. Bell, D (2016) ’Data-driven Customer Behaviour Model Generation for Agent Based Exploration’,Proceedings of the 2016 Spring Computer Simulation Conference, Pasadena, CA, USA.
• Mgbemena C., Bell, D., Shirzad S.R. (2016) ’Social Media: A source for uncovering the determinants of customer satisfaction in the Mobile Services Industry’, Proceedings of the 2016 UKAIS conference, Oxford, UK.
• Mgbemena C., Bell D., Saleh N. (2016) ’A Data-driven Methodology for Agent Based Exploration of Customer Retention’, Proceedings of the 2016 DS-RT conference, London, UK.
• Bell D., Mgbemena C. (2016) ’A Data-driven Approach to Agent Based Exploration of Customer behaviour’Submitted to the Transactions of the Society for Modelling and Simulation International.
• Mgbemena C., Bell D., (2016) ’A Novel Approach to Customer Churn Prediction in the Mobile Services Industry’, To be submitted to expert Systems with Applications.
Acknowledgments
I would like to thank God almighty for giving me life and good health through-out the process of my PhD. This was a challenging journey but I was able to finish the journey as a result of the endless support I received from my super-visors, colleagues and friends.
A big thank you goes to my first supervisor, Dr David Bell for his endless support throughout this journey. I’d also like to use this medium to thank my second supervisor, Prof. Mark Lycett for his support in making sure I was well prepared for my viva. Finally, I’d like to thank my siblings, Gloria Ikeaba and Emeka Mgbemena. My in-laws, Ejikeme Ikeaba, and Joy Mgbemena. My friends and colleagues, Fadzai Hezel Nkwenzi, Alla, Huda, Tomaso, Sara, Roja, Boyce, Fatima, Zainab, Neda, Masoud Fakhimi and all the students/staff who supported me through this process. May God bless you all.
Contents
1 Introduction 8
1.1 Overview . . . 8
1.2 Background and Motivation . . . 9
1.3 Research Aims and Objectives . . . 11
1.4 Research Approach . . . 11
1.5 Thesis Structure . . . 15
2 Literature Review 19 2.1 Overview . . . 19
2.2 Customer Relationship Management . . . 19
2.2.1 Customer Satisfaction . . . 20
2.2.2 Customer Retention . . . 23
2.3 Customer Modelling Behaviour . . . 24
2.3.1 Traditional Modelling Approaches . . . 25
2.3.2 Social Impact on Customer Retention . . . 33
2.3.3 Agent Based Modelling and Simulation . . . 34
2.4 Summary . . . 36
3 Research Methodology 38 3.1 Overview . . . 38
CONTENTS 5
3.2 Research Approaches in Information Systems (IS) . . . 39
3.3 Design Research Background . . . 39
3.3.1 The Design Science Research Process . . . 41
3.3.2 Design Science Research Evaluation . . . 43
3.4 Applying Design Science Research . . . 44
3.5 Research Iterations . . . 47
3.5.1 Iteration 1 . . . 48
3.5.2 Iteration 2 . . . 52
3.5.3 Data Mining Development Cycle . . . 53
3.5.4 Iteration 3 . . . 54
3.6 Summary . . . 57
4 Customer Satisfaction Determinants 59 4.1 Overview . . . 59
4.2 Towards the DSR Output Artefact . . . 60
4.3 Analysis and Results . . . 60
4.3.1 Dataset Description . . . 62
4.3.2 Twitter Temporal Separation . . . 62
4.3.3 Tweets Per Day . . . 63
4.3.4 Sentimental Average Per Day . . . 66
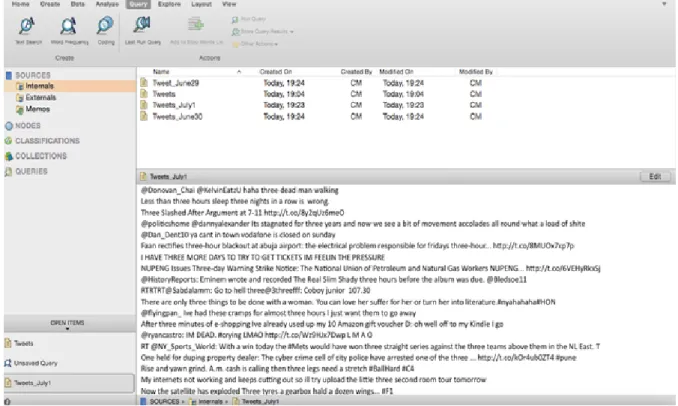
4.4 Temporal Coding . . . 68
4.4.1 Tweet Per Word . . . 68
4.4.2 Reporting Determinants with an Ontology-Based Con-cept Network . . . 71
4.4.3 Sentimental Average Per Word . . . 74
4.5 Evaluation . . . 75
CONTENTS 6
5 Machine Learning for Churn Analysis 80
5.1 Overview . . . 80
5.2 Churn Modeling Techniques . . . 81
5.2.1 Decision Trees . . . 81
5.2.2 Logistic Regression . . . 84
5.2.3 Support Vector Machines . . . 86
5.3 Classification Model Evaluation . . . 86
5.3.1 Binary Classification . . . 87
5.3.2 Classification Accuracy . . . 88
5.3.3 Sensitivity and Specificity . . . 88
5.3.4 Receiver Operating Characteristics . . . 89
5.3.5 Lift Chart . . . 90
5.4 Churn Modelling Experiments and Results . . . 92
5.4.1 Data mining process . . . 92
5.4.2 Datasets Description . . . 92
5.4.3 Twitter Dataset Description . . . 93
5.4.4 Telco Dataset Description . . . 96
5.4.5 Data Preparation . . . 98
5.4.6 Data Modelling . . . 99
5.4.7 Decision Trees Analysis . . . 99
5.4.8 Logistic Regression Analysis . . . 101
5.4.9 SVM Analysis . . . 102
5.4.10 Evaluation of Models and Discussion . . . 103
5.4.11 Model Evaluation Metrics . . . 103
5.5 Limitations to Data Mining . . . 105
CONTENTS 7
6 Data-Driven Approaches for ABM 111
6.1 Introduction . . . 111
6.2 Purpose of Model . . . 112
6.3 Customer Behaviour Modelling . . . 113
6.4 The CADET Approach . . . 114
6.5 CADET Model Validation . . . 118
6.5.1 The TEA-SIM Tool . . . 119
6.5.2 Applying the CADET approach to the Telco dataset . . 120
6.5.3 Agent Attributes and Behaviour . . . 122
6.5.4 Dataset Description . . . 122
6.5.5 Model Structure . . . 122
6.6 Conclusion . . . 128
7 Conclusion and Discussion 129 7.1 Overview . . . 129
7.2 Research Summary . . . 129
7.3 Research Contributions and Conclusions . . . 135
7.4 Summary of Design Artefacts . . . 140
Chapter 1
Introduction
1.1
Overview
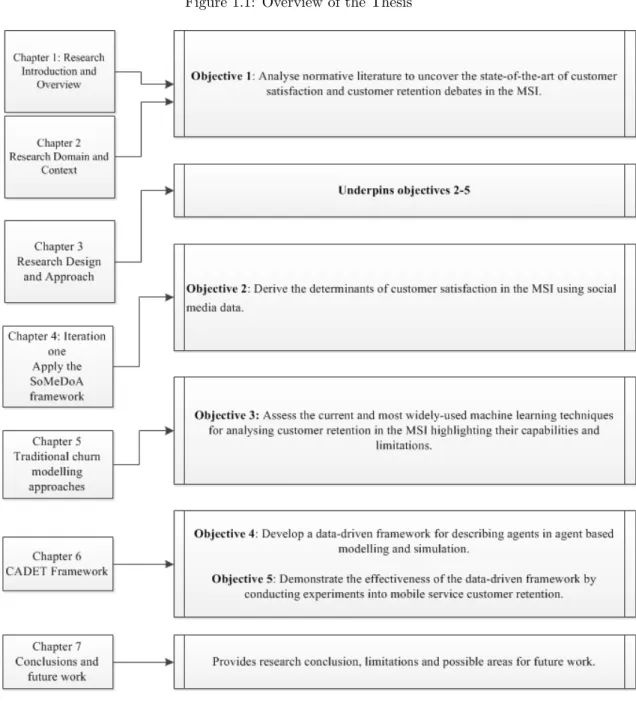
This chapter presents a description of the whole thesis, which investigates customer retention in the mobile services industry (MSI) using selected tools and techniques. After providing a background on customer retention, the aims and objectives of this thesis are presented. The research approach applied to achieve the aims and objectives are explained, followed by a synopsis of the thesis chapters. A diagrammatic representation of this thesis is also presented as a guide for the reader.
This chapter is structured as follows; Section 1.2 presents the background of the research problem domain and the motivation for carrying out the study. Section 1.3 outlines the research aims and objectives derived from the research problem and motivation. Section 1.4 presents a description of the research approach utilised for conducting this study. Section 1.5 provides the structure of this thesis and a diagram that summarises the contents of the thesis.
CHAPTER 1. INTRODUCTION 9
1.2
Background and Motivation
Customer retention is key in customer relationship management (CRM). Cus-tomer retention primarily focuses on building a long-lasting relationship with customers. Customer retention strategies are essential for businesses to gain a competitive advantage and to survive in the market place. Therefore, develop-ing an effective customer retention strategy is critical for businesses especially for mobile network operators (MNOs) because of the fierce competition in the market place. In addition, it is crucial for MNOs to develop an effective cus-tomer retention strategy due to the high churn rate (mobile cuscus-tomers leaving their MNO for a competitor) and the cost of gaining new customers (Gerpott and Ahmadi, 2015; Vafeiadis et al., 2015)
In developed countries, mobile services companies struggle to acquire new customers due to saturation in the market (Verbeke et al., 2012). As a re-sult, customer retention receives a growing amount of attention from MNOs. The high penetration rates have also inspired many management scholars to focus on customer retention strategies in the MSI (Lee et al., 2015; Min et al., 2015). While the concept of customer retention has been previously presented in the literature, more research needs to be conducted to uncover effective strategies for addressing customer retention. This forms the motivation for this research. Many published studies have shown that customer retention is profitable to a company because: (1) acquiring new customers cost five times more than retaining existing customers (Keramati and Ardabili, 2011), (2) existing customers generate higher profits, become less costly to serve, and may provide new referrals by providing positive word-of-mouth while dissatis-fied customers might spread negative word of mouth (Alexandrov et al., 2013; Jones et al., 2014), and (3) loosing customers may lead to opportunity costs because of reduced sales (Verbeke et al., 2012).Importantly, a little
improve-CHAPTER 1. INTRODUCTION 10 ment in customer retention can lead to a significant increase in profit (Epstein and Westbrook, 2012).
The competition in the MSI makes the need to understand customer be-haviour crucial because understanding customer bebe-haviour is a fundamental element for the success of a business (Kang et al., 2012). Understanding cus-tomer behaviour will also help with the identification of dissatisfied cuscus-tomers who are likely to churn. However, the increasing number of customers in the mobile services market can make it even more challenging for MNOs to un-derstand and effectively cater to customer needs (Schaarschmidt and Kilian, 2014). Customer churn is a challenging issue in the mobile services market (Seo et al., 2008). As a result, various tools and techniques have been utilised to ad-dress customer churn including data mining (DM) and statistical approaches. Customer satisfaction and customer retention are often studied simultane-ously because of the relationship between both conceptual elements (Johnson et al., 2012). In addition, customer satisfaction is often seen as a motivator for customer retention (Ribeiro Soriano et al., 2012). While it seems that satisfied customers will remain with their mobile service provider, this is not always the case because satisfied customers can defect while dissatisfied customers can be retained (Ribeiro Soriano et al., 2012). Many published studies investigating customer retention using customer data provided by MNOs primarily focused on the characteristics of customers and customer interaction with their MNO, while ignoring social effects that are likely to cause customer churn (Haenlein, 2013). In addition, many of these studies are predictive in nature and do not give possible reasons on customer decision to churn (Coussement et al., 2015).
CHAPTER 1. INTRODUCTION 11
1.3
Research Aims and Objectives
This research aims to develop a set of methods that enable evidence based, in-depth understanding of customer satisfaction, thereby enhancing customer retention. A mobile services industry context is used to test and evaluate the framework. In order to achieve this aim, the following objectives are set forth:
Objective 1: Analyse the normative literature to uncover the state-of-the-art of customer satisfaction and customer retention debates in the MSI.
Objective 2: Derive the determinants of customer satisfaction in the MSI using social media data.
Objective 3: Assess the current and most widely-used machine learning techniques for analysing customer retention in the MSI highlighting their ca-pabilities and limitations.
Objective 4: Develop a data-driven framework for describing agents in agent based modelling and simulation.
Objective 5: Demonstrate the effectiveness of the data-driven framework by conducting experiments into mobile service customer retention.
1.4
Research Approach
The design science research (DSR) approach is utilised to carry out this study as the study seeks to provide insights into customer retention. The application of DSR seeks to provide insights in forms of models, methods and instantiations (Peffers et al., 2007). Furthermore, the design science approach is suitable for carrying out this study as a set of analytical techniques are utilised to understand the problem domain better. Thereby, providing insights while seeking to make a valid contribution in the problem domain. The DSR process is different compared to other design activities because it involves building,
CHAPTER 1. INTRODUCTION 12 capturing and communicating knowledge acquired during the design process (Vaishnavi and Kuechler, 2015). March and Smith (1995) describe the DSR approach as both a product and a process. The process integrates a number of design and behavioural science activities i.e. build, evaluate, justify and theorise (March and Smith, 1995), while the products are classified according to the following product classification points (March and Smith, 1995):
• Constructs involve concepts that are used to describe problems within the domain of interest and to specify their solutions.
• Models represent real-world problems in specific domains.
• Methodsare a sequence of steps taken to solve specific problems. These steps are based on constructs and models (March and Smith, 1995).
• Instantiations are the execution of constructs, models and methods and evaluating the effectiveness of the design research artefact.
DSR must be carried out as a process of establishing the most effective solution to a problem while applying the laws of a problem domain. To es-tablish the effectiveness of a DSR solution, a rigorous validity measure must be carried out to evaluate the effectiveness of the artefact (von Alan et al., 2004). DSR seeks to accomplish an effective solution to a design problem in an iterative manner whereby each iteration accomplishes the build and execute cycle, contributing new knowledge that is utilised to execute further iterations (Peffers et al., 2007).
Four consecutive design research phases were applied to the design and implementation process to achieve the aims and objectives of this study. These phases are:
CHAPTER 1. INTRODUCTION 13 1. Problem awareness and motivation involves conducting an extensive re-view into the customer retention domain, identifying a problem and pro-viding a justification for addressing the selected problem.
2. Solutions selection and suggestion involves introducing possible ideas for solving the identified problems with the chosen approaches or frame-works. This phase is carried out in the three iterations of this theses. Different approaches are used to address the objectives of each iteration in this study and the knowledge derived from each iteration is fed into the next iteration while attempting to solve the problem identified in phase one.
3. Development is accomplished by building research artefacts. Artefacts developed in this study are the customer satisfaction determinants ontol-ogy (CSDO) and the customer agent decision trees (CADET) framework. CSDO comprises of the identified determinants of customer satisfaction in iteration one. The CADET framework is a data driven approach for describing agents in agent based modelling. The CADET framework is explained in chapter 6.
4. Evaluation is performed by validating the effectiveness of the chosen frameworks adopted to address a research problem. In this research, var-ious evaluation techniques are utilised to validate the chosen approaches used to achieve the objectives of this research. These evaluation tech-niques are presented in chapters 4 to 6.
5. Conclusion presents the research outputs. In addition, the evaluation results are presented. The limitations to the research are presented and areas for future work are also suggested.
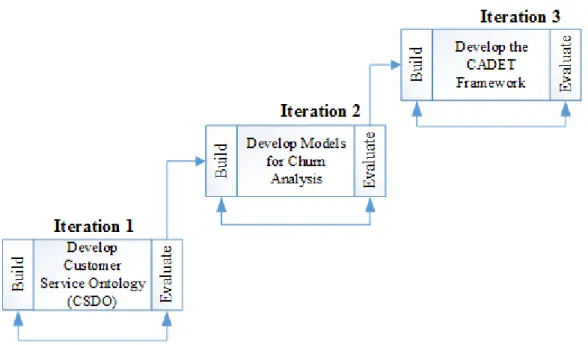
CHAPTER 1. INTRODUCTION 14 In order to achieve the main artefact for this research, the following activi-ties are conducted in an iterative DSR manner. The activiactivi-ties consist of three iterations and these iterations are briefly summarised below.
Iteration 1: This iteration is achieved by synthesising and analysing the customer satisfaction literature. Furthermore, the SoMeDoA framework (Bell and Shirzad, 2013) is used to address customer satisfaction and an evalua-tion method is used to validate the SoMeDoA framework for identifying the determinants of customer satisfaction in the MSI. The customer satisfaction determinants ontology (CSDO) is derived from this iteration.
Iteration 2: This iteration seeks to investigate and analyse churn using the most popular churn modelling techniques. The analysis is carried out based on the established determinants of customer satisfaction derived from iteration one. The popular techniques used for analysing each determinant are compared to obtain the best technique for predicting churn based on each customer satisfaction determinant (CSD). This iteration contributes to the literature by highlighting the best technique for building churn prediction models based on customer satisfaction determinants. The scores derived from the validation tests are also presented.
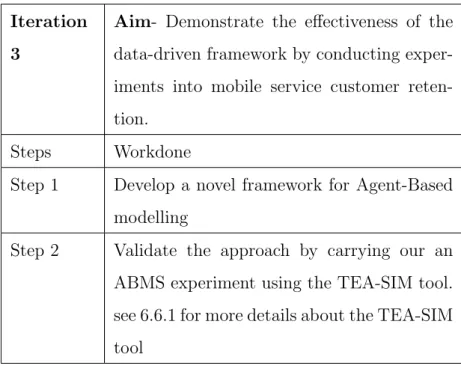
Iteration 3: As a means of addressing the limitations highlighted in it-eration 2, itit-eration 3 seeks to provide a novel approach for conducting agent based modelling. The CADET approach for Agent Based Modelling (ABM) is derived from automated decision trees. The CADET framework is validated by conducting an ABMS experiment. The experiment was conducted to un-derstand the influence of word of mouth (WOM) from close friends and family to customer retention. This iteration contributes to DSR by providing the CADET framework. The CADET framework is discussed in chapter 6.
CHAPTER 1. INTRODUCTION 15
1.5
Thesis Structure
The rest of this thesis is structured as follows:
Chapter 2 presents a literature review focusing on the key areas of this study: customer satisfaction, customer retention and customer behaviour mod-elling. This chapter is organised into four main sections. The first section in-troduces the concept of customer relationship management (CRM) and high-lights the relationship between customer satisfaction and customer retention to CRM. The second section provides a review of customer retention in the MSI, exploring the main factors that drive churn. The third section presents a critical review of the key studies in customer retention, highlighting their ben-efits and limitations to this study. This section also provides the most popular techniques used in customer retention analysis. The final section explores stud-ies on the use of Agent-Based modelling and simulation (ABMS) in customer retention analysis and how ABMS can overcome the highlighted limitations. A popular study is that of Gimblett (2002) who applied ABMS to model decision making while incorporating heterogeneity and interaction/feedback.
Chapter 3proposes and describes the use of the DSR approach to address the research problem. This chapter presents a background on design research. In addition, methods and techniques adopted to conduct the study, along with the justification for adopting these techniques are presented. The chapter concludes by explaining the steps and phases carried out to meet the aim and objectives of this study.
Chapter 4 presents iteration one of this study, which focuses on identify-ing customers’ perception about their MNO usidentify-ing social media. Social media is selected as a means to gather more information from a larger audience. The SoMeDoA approach is adopted for the purpose of extracting and analysing data from the selected domain as a means to uncover the determinants of
cus-CHAPTER 1. INTRODUCTION 16 tomer satisfaction. During the analysis of this phase, more knowledge is gained about the problem domain. In addition, the knowledge gathered during the execution of this iteration was fed into subsequents iterations. The SoMeDoA approach, which was used to develop the CSDO artefact in this iteration is evaluated by conducting interviews with a random selection of mobile net-work customers who represent all the companies included in the analysis. The findings of the interviews were positive and confirmatory in terms of the sig-nificance of the determinants of customer satisfaction. However, the dominant view of the respondents was that the characteristics of the people should also be investigated.
Chapter 5presents an empirical evaluation of four widely used techniques for analysing customer retention: classification and regression trees (CART), random forests, logistic regression and support vector machines (SVM). A the-oretical background on the selected customer retention analysis techniques are also presented. Subsequently, a classification model evaluation section detail-ing the evaluation metrics used in this phase is presented. Furthermore, the experiments conducted are reported. Finally, evaluation of the experiments conducted are presented. The results derived in this chapter provide a moti-vation for the final findings chapter.
Chapter 6 proposes a data-driven framework for ABM. This chapter fo-cuses on describing the components of this framework, how it can be applied and justification for proposing the framework. A validation of the CADET framework is also presented. The validation is carried out using the TEA-SIM tool. Details about the TEA-SIM tool are also presented in this chapter.
Chapter 7concludes the research and presents key contributions and find-ings. It summarises how the research achieves the aims and objectives. In addition, the contributions made by the study are presented, along with the
CHAPTER 1. INTRODUCTION 17 limitations to drive further research.
CHAPTER 1. INTRODUCTION 18
Chapter 2
Literature Review
2.1
Overview
This chapter seeks to explore the state-of-the-art of studies in customer satis-faction and customer retention in the MSI. The chapter is organised as follows. Section 2.2 presents background on CRM, customer satisfaction and customer retention. Section 2.3 reviews the literature on consumer modelling behaviour, focusing on the traditional methods for modelling customer behaviour, social impacts of customer retention and ABM. Finally, Section 2.4 provides a sum-mary for the chapter.
2.2
Customer Relationship Management
Historically, organisations had close relationships with their customers. This was as a result of knowing each customer individually and offering them per-sonal customised service (Benoit and Van den Poel, 2012). The provision of these customised services earned such organisations greater levels of loyalty (Coelho and Henseler, 2012). Over the years, as the market became more
CHAPTER 2. LITERATURE REVIEW 20 petitive, customers interchanged personalised services for anonymity, reduced variety and lower prices (Peppard, 2000). The current business environment is characterised by fierce competition and saturated markets.
Mutanen et al. (2006) argue that the mass marketing approach, where each individual customer receives equivalent treatment from the company, cannot succeed in today’s diversity of consumer business. Hence, organisations are practising an approach to marketing described by Peppard (2000) as the cus-tomer relationship management (CRM) approach. This approach uses continu-ously refined information about current and potential customers for businesses to anticipate and respond to their needs. CRM entails structuring and man-aging relationships with customers (Kim et al., 2003), covering the processes related to customer acquisition, customer cultivation, customer retention and the reactivation of defected customers (Benoit and Van den Poel, 2012).
2.2.1
Customer Satisfaction
Customer satisfaction is regarded as the central element in maintaining long-term customer relationship in the literature of relationship marketing (Siu et al., 2013). Therefore, when customers experience a bad service, it is a crucial challenge to re-establish customer satisfaction and retain unsatisfied customers. Researchers have explored customer satisfaction in various fields and have come up with various definitions for customer satisfaction. A widely used definition in the literature is that of Kotler (2009) who defined customer satisfaction as a person’s feeling of pleasure or displeasure resulting from capturing a product’s perceived performance (or outcome) in relation to his or her expectations. Kotler (1994) further stated that the key to customer retention is customer satisfaction.
indus-CHAPTER 2. LITERATURE REVIEW 21 tries. Hanif et al. (2010) investigated the factors affecting customer satisfaction in the telecommunications sector in Pakistan using price fairness and customer services as predicting variables. They found that both variables are not only independently important for satisfying customers but they also complement each other. Bamfo (2009) reports that factors such as: friendly, courteous, knowledgeable and helpful employees, accuracy of bills, competitive pricing, and service quality enhance customer satisfaction. Rahman et al. (2011) found that price plays an important role in the choice criteria for mobile telephone operators in Malaysia.
In the telecommunications sector, a number of researchers have found that satisfied customers tend to increase their usage and have the intention to pur-chase that particular product in the future (Santouridis and Trivellas, 2010; Lee, 2013; Choi et al., 2008). Satisfied customers will repeat the purchase, be brand loyal, and convey positive word of mouth. These will potentially enhance sales and bring about more profit (Oliver, 2010). Leelakulthanit and Hongcharu (2011) investigated the determinants of customer satisfaction by interviewing 400 mobile phone users in Thailand. They found that promo-tional value, quality of customer service at shops and corporate image play the most important role in determining customer satisfaction.
Mobile service providers have to monitor the market continuously to ensure that their offers, charges, signal coverage, and quality of services are better than their competitors (Almossawi, 2012). Das Gupta and Sharma (2009) found that in order to retain customers and attract new customers, mobile service providers must provide service with reasonable quality without any hidden price, as these are the two most important determinants of customer satisfaction. Despite the cost and difficulty in measuring customer satisfaction, it is still considered an important method of securing a competitive advantage
CHAPTER 2. LITERATURE REVIEW 22 (Mittal et al., 2005). In order to gain a competitive edge, organisations need to seek the determinants of customer satisfaction and provide them.
The aforementioned studies investigated customer satisfaction with tradi-tional data collection methods such as interviews and questionnaires. How-ever, the area of customer satisfaction is increasingly gaining more audience and researchers are seeking alternative approaches to investigating customer satisfaction.
Agnihotri et al. (2015) investigated the impact of social media on influenc-ing customer satisfaction in business to business (B2B) sales. They found that social media use has an influence on customer satisfaction and customers value interaction with companies on social media. In addition, they found a positive relationship between responsiveness and customer satisfaction, implying that customers also value timely responses from companies.
The use of social media by companies is gradually increasing. As a result, social media is becoming an integral part of companies success. Social media provides an opportunity for companies to gain more exposure, increase traf-fic and gain more insights in the marketplace (Stelzner, 2011). From a sales force perspective, social media allows sales people to engage customers and develop social grounds where companies can encourage customers to interact and establish relationships with their customers (Agnihotri et al., 2012). Social media offers platforms where companies can communicate with customers en-abling a better sales person responsiveness. The extensive use of social media platforms by companies, with increased interaction with companies is causing buyers to gain equal power with sellers in the market place (Prahalad and Ramaswamy, 2004). Consequently, customers have a higher expectation from sellers and sellers are at risk of losing their customer base if an effort is not made to satisfy customers (Agnihotri et al., 2015). The next section presents
CHAPTER 2. LITERATURE REVIEW 23 a review of some key studies on customer retention.
2.2.2
Customer Retention
Over the last decade, the number of mobile phone users has increased reaching an overwhelming number of 7 billion (Ozcan, 2014). In developed countries, telecommunication companies have mobile penetration rates above 100% with no new customers (Verbeke et al., 2012). As a result, customer retention receives a growing amount of attention from MNOs, and management scholars are increasingly conducting more research in customer retention (Backiel et al., 2016; Jahromi et al., 2016). It has been shown in the literature that customer retention is profitable to a company because:
1. Acquiring new customers cost five times more than retaining existing customers (Keramati and Ardabili, 2011).
2. Existing customers generate higher profits, become less costly to serve, and may provide new referrals through providing positive WOM while dissatisfied customers might spread negative word of mouth (Jones et al., 2014).
3. Loosing customers may lead to opportunity costs because of reduced sales (Itzkowitz, 2013).
A number of studies in the area of customer retention have revealed that customer satisfaction is a strong predictor of customer retention (Baumann et al., 2012).
Customer churn is a term widely used in the area of customer retention to describe customers who switch to a different mobile service provider or leave the market entirely. The main factors that influence customer churn in the
CHAPTER 2. LITERATURE REVIEW 24 mobile services market are: (1) customer satisfaction, (2) switching costs, (3) relationship quality and (4) price (Hanif et al., 2010; Silva and Yapa, 2013; Svendsen and Prebensen, 2013). In addition, social influence is another key driver to customer churn in the MSI (Phadke et al., 2013; Verbeke et al., 2014). Price is the most important factor for customer churn, followed by customer service, service quality and coverage quality (Chu et al., 2007). Most MNOs already have a customer churn prediction model that gives information on the customers with the highest propensity to churn (Verbeke et al., 2012). This enables efficient customer management, and a better allocation of resources for customer retention campaign. There are two basic approaches that can be used to address customer churn namely, untargeted and targeted approaches (Khan et al., 2010). Untargeted approaches rely on outstanding product and mass advertising to increase brand loyalty and retain customers while targeted approaches rely on identifying customers who are likely to churn and then providing them with either a direct incentive or a customised plan for them to stay (Khan et al., 2010). Various types of information can also be used to predict customer churn, such as information on socio-demographic data (e.g. sex, age, or post code) and call behaviour statistics (e.g. the number of international calls, billing information, or the number of calls to the customer helpdesk). Alternatively, social networks information extracted from call detail records can also provide insights on churn prediction (Dasgupta et al., 2008).
2.3
Customer Modelling Behaviour
Customer retention can be achieved if a company is able to understand pat-terns in which customers behave and the likely triggers for such behaviour. Understanding customers, managing interactions and relationships with them
CHAPTER 2. LITERATURE REVIEW 25 is a vital part of CRM. A company with a good CRM should be able to predict customer behaviour. Predicting customer behaviour can be achieved through customer behaviour modelling (Ottar Olsen et al., 2013). Customer behaviour modelling entails applying tools and techniques to gain a better insight on cus-tomer behavioural patterns and in turn predict future behaviour. Neslin et al. (2006) characterised CRM models as either analytical or behavioural models. Analytical models involve large datasets that are stored in data warehouses. These datasets require models that can easily scale the dataset and provide re-sults to increase company revenue. Behavioural models make use of surveys to analyse cognitive responses to services provided (Neslin et al., 2006). Furness (2001) classified customer behaviour modelling into (1) descriptive modelling, (2) predictive modelling and (3) a combination of descriptive and predictive modelling. Descriptive modelling describes models that attempt to answer ‘why’ questions. An example of descriptive modelling is clustering. When a customer clustering exercise is conducted, customers belong to a certain cluster because they collectively possess similar attributes or behaviours. Predictive modelling describes models that answer the ‘who’ questions. For example who will buy a product or service? In the context of customer churn, predictive models can give insight on who is likely to churn. Predictive models work by predicting future customer behaviour based on their past behaviour. Finally, the combination of descriptive and predictive modelling addresses problems by integrating both descriptive and predictive models to provide a more concise answer on ‘who’ and ‘why’ questions at the same time (Verbeke et al., 2012).
2.3.1
Traditional Modelling Approaches
Numerous methods have been applied to analyse and investigate customer retention. These methods can generally be classified as statistical analysis
CHAPTER 2. LITERATURE REVIEW 26 methods and data discovery methods. Statistical analysis for modelling cus-tomer retention includes correlation analysis, ANOVA analysis and chi-square test. Data discovery methods for modelling customer retention include data mining techniques. Data mining simply means extracting hidden knowledge from data. The use of data mining techniques is popular in the area of cus-tomer retention to understand cuscus-tomer behaviour from raw data. Data min-ing methods are widely used in the literature for analysmin-ing and investigatmin-ing customer churn for two main reasons: they have better prediction results than traditional statistical techniques (Ye et al., 2008) and they are more suitable for analysing large data sets (Lemmens and Croux, 2006). Hence, this study focuses on exploring data mining techniques for customer churn analysis.
Numerous industries have attempted to study customer churn. These in-dustries include banking (He et al., 2014; Raju et al., 2014), insurance (Sun-darkumar and Ravi, 2015) and retail (Migu´eis et al., 2012, 2013). Customer churn has also been applied into different areas such as economics, and be-havioural studies (Neslin et al., 2006). Consequently, there is substantial lit-erature uncovering factors that drive customer retention. These factors have been investigated using various tools and techniques (Ahn et al., 2006).
Gerpott and Ahmadi (2015) explored the capability of socio-demographic, contract and service usage characteristics of MNO subscribers as well as their stated reason for contract termination to predict the likelihood of an entirely successful win back. How customer service usage characteristics and the cause for termination reflect on the MNO’s effort to win back customers. This study also explored the outcomes of company programs attempting to motivate cus-tomers to withdraw contract cancellation request. The data utilised to conduct this study was collected from the billing system of one of the four mobile net-work operators that were competing in the German market, with a sample of
CHAPTER 2. LITERATURE REVIEW 27 305,466 post-paid residential customers. The primary objective of the study is to understand the factors that are associated with the success of an MNO’s effort to regain customers who terminated their mobile contract but are still legally bound to their MNO until the end of their contract. The results derived from the study enabled MNO representatives to develop profiles of two distinct target groups. The first group consist of customers who are likely to withdraw their prior termination notice. The MNO’s win-back practices appear to fit well with specific needs of the target audience. Hence, MNO executives can make a decision to focus on win-back activities.
Vafeiadis et al. (2015) carried out a comparison of machine learning tech-niques for customer churn prediction. The machine learning techtech-niques cov-ered in this study are artificial neural networks, SVMs, decision tree learning, na¨ıve bayes and logistic regression analysis. The churn dataset is a telecom dataset obtained from the UCI machine learning repository which is included in package C5.0 and used to evaluate the performance of the tested classifiers. The dataset contains 19 predictors and a binary(yes/no) churn variable. The dataset contained 5000 samples of telecom customer data. The experiments in this study were carried out in two phases; without boosting and with boost-ing. The top performing method without boosting is the decision trees with an accuracy of 94%. The SVMs classifiers (RBF and POLY kernels) obtained accuracy of 93%. Boosting was carried out using the AdaBoost.M1 algorithm. Na¨ıve bayes and logistic regression classifiers were unable to be boosted be-cause they lack free parameters to be tuned. Hence, the results show that for the three remaining classifiers, artificial neural networks, decision trees and SVMs, accuracy was improved between 1% and 4%. Overall, the boosted SVM was the best classifier with accuracy of almost 97%. The primary benefit of this work is that it provided additional insight on the performance of the most
CHAPTER 2. LITERATURE REVIEW 28 popular churn prediction techniques for predicting churn in the telecommuni-cation sector. It also sheds light on the applitelecommuni-cation of boosting techniques. The limitations of this work are: 1) more customer data should be tested with the boosting method, 2) other boosting methods other than AdaBoost should be explored, and 3) there is need for a larger and more detailed dataset from the telecom industry to maximise the statistical significance of the result.
Huang and Kechadi (2013) carried out a study for predicting customer behaviour by utilising a novel-hybrid based learning system which integrates supervised and unsupervised techniques for predicting customer behaviour. The applied system combines a modified k-means clustering algorithm and a classic inductive rule technique (FOIL). Three experiments were conducted in this study. The aim of experiment 1 was to verify if the weighted k-means clustering is able to lead to a better data partitioning result. Experiment 2 involved evaluating classification results and comparing them to other well-known modelling techniques. Experiment 3 compared the proposed-hybrid model system with several other recently proposed hybrid classification ap-proaches. The experiments were conducted using a telecom dataset consisting of 104,199 customer records with 6,056 churners and 98,143 non-churners. The attributes in the dataset mainly consist of demographic profiles, account in-formation and call details. The 5-fold cross validation model was used in this research. The results show that the hybrid model-based learning system is very promising and outperforms other models. This work was carried out to understand customer behaviour, however, the limitations of this work are that it did not consider eliminating redundant data and outliers before performing the experiments. This could affect the effectiveness of the model. Furthermore, other clustering algorithms can also be applied to gain more information about customers in several clusters.
CHAPTER 2. LITERATURE REVIEW 29 Kirui et al. (2013) predicted churn using a dataset that was provided by a European telecommunications company. The dataset was collected for three months with 112 attributes and 106,405 instances. 5.6% of the customers on the dataset were churners while the rest of the dataset consists of active users. In order to make the churn customer data recognised by the mining algorithms, additional features were derived and then added to the dataset. Stratified random sampling was carried out and then added to the original dataset. The problem of imbalance was handled by applying stratified random sampling to both the original and modified datasets. Random sampling was used in each stratum independently to the required data sample size. A new set of features were proposed in this study to improve prediction rates for churn recognition. The results show that most of the feature subsets perform almost equally using Na¨ıve Bayes. The results also show that as sample size increases, the ratio of churn to active also increases. The probabilistic classifiers (Na¨ıve Bayes and Bayesian network) achieved better results when compared to the a decision tree (C4.5). The results also show that the prediction rates on the modified dataset are better than the original dataset. The improvement in the results is attributed to the features of the new dataset which signifies the benefits of new features. The new features added to the dataset are contracted related features, call pattern description features and calls pattern changes. The initial features of the dataset are call profiles and call traffic details. The limitations of this study is that the authors did not attempt to understand customer behaviour, and the imbalance in data may have affected the performance of the modelling results.
Verbraken et al. (2013) proposed a new framework, the cost benefit analysis framework to define performance measures associated with profit maximisa-tion. The authors applied this framework to customer churn with its particular
CHAPTER 2. LITERATURE REVIEW 30 cost benefit structure. Companies benefit from this approach as it provides an insight on selecting the best classifier for maximising profit. The proposed framework also provides guidance on which customer base should be involved in the customer retention campaign. A case study was carried out by apply-ing 21 techniques to 10 different customer churn datasets. The results show that area under the ROC (AUC) makes incorrect implied assumptions about misclassification costs. Hence, the use of this performance evaluation metric in a business environment may lead to suboptimal profits. The benefit of the EMPC measure is that it maximises profit and provides an insight on the cus-tomer base that needs to be targeted for cuscus-tomer retention campaigns. The limitation of this framework is that it is only applicable to a specific business problem, maximising profit. The authors created the H-measure to address the limitation of the AUC measure in their study. The H-measure benefits from the ability to select the most profitable classifier. However, the H-measure does not provide guidance on the optimal fraction of customer base to be included in the retention campaign.
Kim et al. (2014) proposed a new method for churn prediction by analysing how subscribers communicate and considering a propagation process in a net-work based on call detail records which transfers churning information from churners to non-churners. The dataset used to conduct this study was ob-tained from a telecommunications company and it includes customer personal information and call detail records (CDR) data. In addition, the dataset con-sisted of 89,412 customers and 36 variables that include customer personal variables such as demographic information, product details (cell phone types and performance, duration from the last change of cell phone), service satisfac-tion factors (number of complaints, service quality score, and loyalty score), propensity to telephone calls (proportion of non-voice calls and proportion
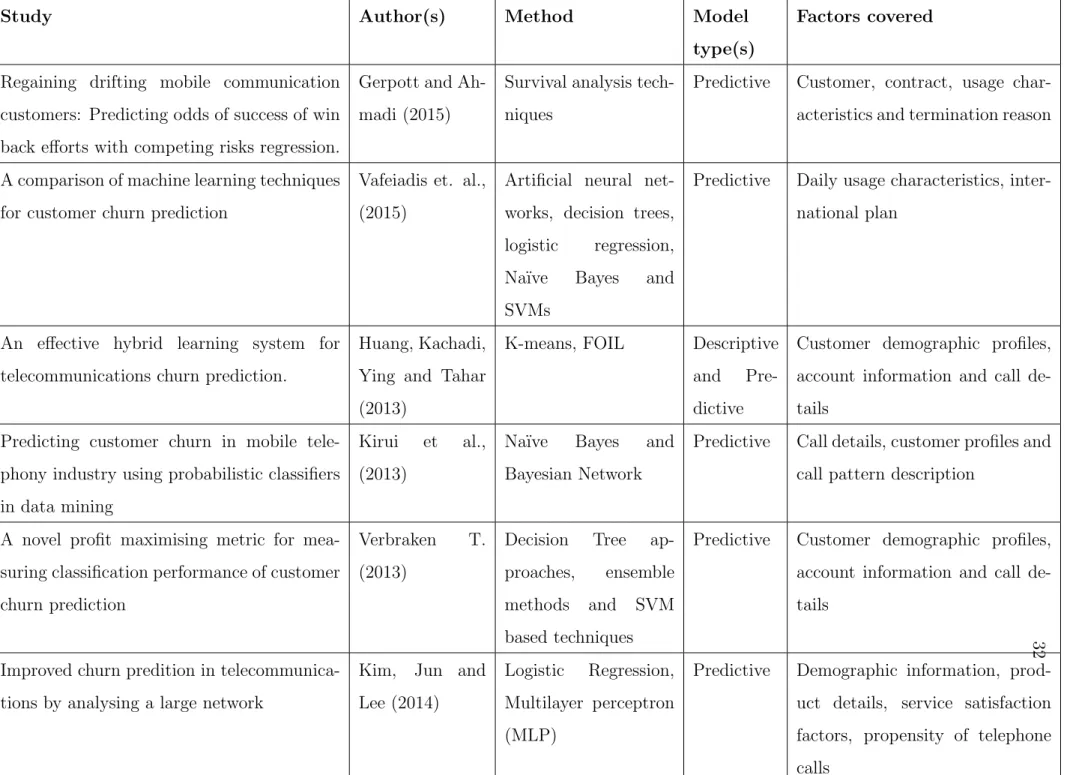
CHAPTER 2. LITERATURE REVIEW 31 of calls during the day time). The authors introduced network analysis and accomplished further improvement in churn prediction compared with the tra-ditional machine learning approach that handles personal information stored in companies. The network variable was generated from SPA, one of the prop-agation processes, and combined with traditional personal variables to train a model. The authors highlight that for the purpose of future study, a larger dataset which spans across a longer period should be used with the proposed method for churn prediction. Table 2.1 presents a review of some significant studies on customer churn in the MSI.
CHAPTER 2. LITERA TURE REVIEW 32
Table 2.1: Review of significant studies on customer churn on mobile services
Study Author(s) Method Model
type(s)
Factors covered
Regaining drifting mobile communication customers: Predicting odds of success of win back efforts with competing risks regression.
Gerpott and Ah-madi (2015)
Survival analysis tech-niques
Predictive Customer, contract, usage char-acteristics and termination reason
A comparison of machine learning techniques for customer churn prediction
Vafeiadis et. al., (2015)
Artificial neural net-works, decision trees, logistic regression, Na¨ıve Bayes and SVMs
Predictive Daily usage characteristics, inter-national plan
An effective hybrid learning system for telecommunications churn prediction.
Huang, Kachadi, Ying and Tahar (2013)
K-means, FOIL Descriptive and Pre-dictive
Customer demographic profiles, account information and call de-tails
Predicting customer churn in mobile tele-phony industry using probabilistic classifiers in data mining
Kirui et al., (2013)
Na¨ıve Bayes and Bayesian Network
Predictive Call details, customer profiles and call pattern description
A novel profit maximising metric for mea-suring classification performance of customer churn prediction
Verbraken T. (2013)
Decision Tree ap-proaches, ensemble methods and SVM based techniques
Predictive Customer demographic profiles, account information and call de-tails
Improved churn predition in telecommunica-tions by analysing a large network
Kim, Jun and Lee (2014)
Logistic Regression, Multilayer perceptron (MLP)
Predictive Demographic information, prod-uct details, service satisfaction factors, propensity of telephone calls
CHAPTER 2. LITERATURE REVIEW 33
2.3.2
Social Impact on Customer Retention
More recently, social networks’ influence have been found to be a key con-tributing factor to customer retention (Zhang et al., 2010; Risselada et al., 2014). Social networks’ influence is typically carried out with the use of word of mouth. word of mouth is the informal communication between private par-ties regarding evaluations of goods and services (Anderson, 1998). 75% of defected customers spread a negative word of mouth to one or more customers (Keaveney, 1995). The following section presents some relevant studies on the impact of social influence on customer retention.
Phadke et al. (2013) developed a model that integrates social network anal-ysis with traditional churn modelling concepts. The model was applied to a dataset of over half a million subscribers, provided by a large mobile net-work provider. The dataset contained customer call detail records (CDR). To compute social tie strength, the authors used three attributes namely: 1) the number of calls placed between two users, 2) the total duration of calls between two users and 3) neighbourhood overlap of the two connected users. This study found users that make phone calls to numbers on a different network are likely to churn in future to save costs.
Similarly, Verbeke et al. (2014) conducted a study investigating the impact of social networks on customer retention. However, the latter differs from the former in that it uses both networked and non-networked (customer-related) information about millions of users. The key finding of this study was that churn not only had an impact on customers’ friends, it also had an impact on friends of friends.
Although the studies mentioned above have contributed to the knowledge of customer retention, however, they do not capture the possible factors as to why customers made their decision to churn. This study applies the
SoMe-CHAPTER 2. LITERATURE REVIEW 34 DoA framework to understand the key factors of customer satisfaction. Fur-thermore, the classification churn prediction models are built based on these factors. In addition, a novel framework for describing agents in ABM is pre-sented and the model is evaluated with an ABMS experiment.
2.3.3
Agent Based Modelling and Simulation
Over the years, researchers and industry practitioners have attempted to apply different techniques to understand customer behaviour in the market place. The ABMS approach is a typical example of one of these techniques (Twomey and Cadman, 2002). ABMS provides an understanding of how systems work under certain conditions. ABMS works by creating scenarios that imitate real life conditions for example carrying out an ABMS exercise with customers who walk into a retail store. ABMS can be used in this context to derive insights on customer behaviour in the retail store. This process provides an explanation of the relationship between elements in a complex system. ABMS is made up of two main parts: modelling and simulation. Modelling is the process of representing real life events into a model while simulation is the process of executing represented models such that they imitate the proposed system. Agent based models are composed of agents and a structure for agent based interaction.
Agents can represent anything from a number of patients in a hospital to consumers of a product or service. ABMs are often characterised by rules and these rules define the behaviour of agents in the system (Macal and North, 2010). These behaviours are often influenced by agent interactions with other agents in the system, making the outcome difficult to predict. In such cases, a balance may be difficult to reach, making the ability to study the underlying system and the dynamics of the behaviour imperative. ABM is distinct from
CHAPTER 2. LITERATURE REVIEW 35 traditional modelling approaches where characteristics are often aggregated and manipulated (Baxter et al., 2003). Traditional modelling techniques for modelling maybe suitable for their purposes but they may not be able to provide adequate level of details in regards to the independent behaviours of agents. Although the commonly used traditional techniques for modeling consumer markets (discussed in the previous section) are powerful with regard to their purposes, they are generally not able to provide sufficient levels of detail with regard to the interdependent behaviors of consumers, retailers, and manufacturers.
In addition, ABM is able to sufficiently represent interdependent systems even on a large scale i.e. incorporating a high number of factors, with each factor’s level of detail and the behavioral complexity of those factors North et al. (2010). ABM is a widely used for modelling complex systems that are composed of interacting independent elements (Macal and North, 2010). The ABM technique can be applied to any aspect of a phenomena. ABM has been applied in various areas including economics (Farmer and Foley, 2009), health-care (Epstein, 2009), management science (Macal and North, 2010) and geography (Heppenstall et al., 2011). In business, ABM has been applied to help decision makers understand underlying market structures and anticipate dynamics in the market place (Macal and North, 2010). ABM has also been utilised in artificial life research, to explore life in order to uncover how it might be, rather than how it actually is (Adami, 1998). ABM is also used in consumer modelling to understand and to predict consumer modelling process (Zhang and Zhang, 2007). Consumers are represented as independent agents with individual characteristics and an independent decision making process (Gilbert, 2008). Sellers are represented as agents who present their products with different characteristics into the market (Roozmand et al., 2011).
CHAPTER 2. LITERATURE REVIEW 36 In the study of social behaviour and interactions, ABM starts with a set of assumptions derived from the real world (deductive), and produces simulation-based data that can be analysed (inductive) (An, 2012). ABM must create a clear representation of what happens in reality so that every agent performs a task of an individual as if it is happening in social reality (Roozmand et al., 2011).
ABM has a number of benefits such as the ability to model individual deci-sion making while incorporating heterogeneity and interaction/feedback (Gim-blett, 2002). Additionally, ABM has the ability to incorporate social/ecological processes, structures, norms and institutional factors (Deadman et al., 2004). These advantages make it possible to couple human and natural systems in an ABM.
Despite the strengths of ABM, it also has some limitations. These limita-tions include lack of predictive power, difficulty in validation and verification (Matthews et al., 2007).
2.4
Summary
This chapter provides the foundation for this research. Customer satisfaction is vital to the success of any business. Customer satisfaction is one of the key drivers of customer retention, and customer retention is one of the fundamen-tal elements of CRM. Traditional approaches and ABM approaches have been applied to study customer churn in the literature. As reported in the litera-ture, data mining is a popular technique for analysing customer churn in the MSI. This chapter provides some relevant studies of churn analysis using tra-ditional methods, data mining techniques and ABM. This chapter also shows that majority of the studies that applied data mining to address customer
CHAPTER 2. LITERATURE REVIEW 37 churn did so using decision trees, logistic regression and SVMs. The major-ity of the studies on customer retention have two common limitations; firstly, they focused on investigating certain factors such as customer satisfaction and customer retentions while neglecting the possible effects of social ties on cus-tomer retention (Hanif et al., 2010; Edward and Sahadev, 2011). Secondly, they focus on customer interaction with the network operator (Richter et al., 2010; G¨unther et al., 2014), neglecting the fact that customers often interact amongst themselves. To overcome these limitations, this study proposes an approach to analysing churn and a novel approach to agent-based modelling. The next chapter presents the methodology for conducting this research.
Chapter 3
Research Methodology
3.1
Overview
This chapter describes the research approach chosen to investigate customer retention in the MSI. It also provides a description of methods utilised to carryout studies in iterations in this study. Furthermore, an explanation of the research development phases are presented. Design Science ResearcDSR is utilised as the general methodological framework to conduct this study. DSR is selected because it allows knowledge gained from one iteration to be applied to subsequent iterations. This chapter is organised as follows. It begins by highlighting research approaches in information systems (IS) in section 3.2. Section 3.3 provides a background knowledge on design research. Section 3.4 explains how DSR is applied to achieve the aim and objectives of this research. Section 3.5 provides a description of how the iterations in this study are carried out and how the artefacts generation in each iteration are achieved. Finally, section 3.6 presents an overall summary for this chapter.
CHAPTER 3. RESEARCH METHODOLOGY 39
3.2
Research Approaches in Information
Sys-tems (IS)
Information systems is a multidisciplinary field which spans across disciplines such as computer science, management science, engineering and others (Baskerville and Myers, 2002). IS research can be conducted using a variety of research approaches, techniques, methods, methodologies and paradigms. The design research is a popular research approach in conducting IS research because it provides a means for IS researchers to create or improve existing artefacts (Hevner and Chatterjee, 2010). The next section presents a background on design research.
3.3
Design Research Background
Design research (DR) is an innovative means of problem solving (von Alan et al., 2004). It is a broad area of research that spans across all design fields but importantly does not have the distinct feature of DSR; learning through building thereby creating an artefact (Kuechler and Vaishnavi, 2008). The term ‘science’ was incorporated into design research when IS researchers dis-covered that the term ‘design research’ had a past history as the study of design and designers, including, their methods, cognition and education (Kuechler and Vaishnavi, 2008). DR is a research into design or about design while DSR primarily uses design as a research method or technique to solve a problem and learn from the process of solving that problem (Kuechler and Vaishnavi, 2008). DSR is also widely adopted in other fields such as education, engineering, and health-care (Hevner and Chatterjee, 2010). March and Smith (1995) describe DSR as a research methodology that allows research to produce relevant and
CHAPTER 3. RESEARCH METHODOLOGY 40
Build Evaluate Theorise Justify Construct
Model Method Instantiation
Table 3.1: Research Framework (March and Smith, 1995)
improved effectiveness by strategically combining research output (product) and research processing (activities) from both natural and design science in a two-dimensional framework. The design science output or artefacts includes constructs, models, methods and instantiations while the natural science ac-tivities include build, evaluate, theorise and justify March and Smith (1995) (see table 3.1). The application of the two-dimensional framework can be described as applying natural science activities to produce design science arte-facts; constructs, models, methods and instantiations. Design science achieves satisfactory results to a design problem by process of iterative knowledge re-finement (Hevner and Chatterjee, 2010).
The DSR output classification defined by March and Smith (1995) can help establish appropriate measures to build, evaluate, theorise and justify a DSR. The four research outputs are described below:
Constructs: Constructs are a set of concepts that are used to describe prob-lems within a domain and specify their solutions. Constructs also form the vocabulary of a discipline.
Models: Are a set of statements which express relationships among con-structs and represent real-world design activities in a domain (March and Smith, 1995). Models can also be used to suggest solutions to problems in a solution space.
CHAPTER 3. RESEARCH METHODOLOGY 41
Methods: Are a sequence of steps used to execute a task. These steps provide guidelines on how to solve problems with the use of constructs and models. Furthermore, methods can be described as a set of methodological tools that are created by design science and applied by natural science (March and Smith, 1995).
Instantiations: Are the utilisation of constructs, models and methods to showcase an artefact in a domain. They demonstrate the effectiveness of the constructs, models and methods (March and Smith, 1995). Newell et al. (1972) describe the importance of instantiations in computer science by explaining how they offer a better understanding of a problem domain, and as a result, provide improved solutions. Instantiations provide working artefacts that can drive significant advancement improvement in both design and natural sci-ences. A DSR methodology incorporates five stages of a design cycle to address design research problem. These phases are designed to aid sustainable devel-opment during the research and transfer of knowledge from one iteration to the next iteration until a desired result is achieved. The next section explains the DSR processes.
3.3.1
The Design Science Research Process
The DSR process follows a stepwise approach structured as five phases.
Awareness of problem: The DSR process begins by identifying the problem under study. The identified problem may arise from multiple sources such as the literature or current problems in the industry. The research problem needs to be clearly defined and articulated. The output of this phase is a formal or informal proposal for new research.
Suggestion: This phase is explored when a research proposal has been pre-sented. Possible solutions about the research problem are explored and
evalu-CHAPTER 3. RESEARCH METHODOLOGY 42 ated, leading to the acquisition of further insights to the domain under study. The specifications of the appropriate solutions to the research problem are defined. The output of this phase is a conditional design or representation of proposed solutions.
Development: This phase involves further developing and implementing the DSR artefacts based on the suggestions from the previous phases. The outputs of this phase are the artefacts, which are core elements of the DSR process. March and Smith (1995) described DSR artefacts into four categories: Con-structs, models, methods and instantiations.
Evaluation: The developed artefacts are analysed and evaluated according to the criteria set in phase 1 (awareness of problem phase). Deviations and expectations should be noted and explained in this phase. If the outcomes de-rived from the development or evaluation phase do not meet the objectives of the problem, the design cycle returns to the first phase, along with the knowl-edge gained from the process of the first round of work. These phases may be iterated until the evaluation of the artefacts meets the solution requirements. The outputs of this phase are performance management that should improve the efficiency and effectiveness of the artefact.
Conclusion: This is the last phase of the DSR cycle. The results of the re-search are written up and communicated to a wider audience in forms of profes-sional publications and scholarly publications (Peffers et al., 2007). Kuechler and Vaishnavi (2008) categorise the knowledge gained in this phase as either firm or loose ends. Firm knowledge are facts that have been learned and can be repeatably applied or behaviour that can be repeatably invoked, while loose ends are anomalous behaviour that defies explanation and may well service as the subject of further research (Kuechler and Vaishnavi, 2008)
CHAPTER 3. RESEARCH METHODOLOGY 43
Figure 3.1: DSR Phases
3.3.2
Design Science Research Evaluation
Evaluation is an integral part of the DSR process. It is an avenue to validate the performance of an artefact and measure progress according to the defined metrics (March and Smith, 1995).
Artefacts are constructed to carryout specific problems, thereby, demon-strating their effectiveness in solving the problems. The process of developing an artefact may result in deviations from expectations. In this case, these devi-ations should be properly explained (Kuechler and Vaishnavi, 2008). Knowl-edge gained from the evaluation phase of one iteration can be applied into further iterations. Evaluation plays an essential role in DSR as it is iterative in manner. Hence, it is important to develop appropriate evaluation metrics to assess artefact performance and to measure the efficiency and effectiveness of artefacts (March and Smith, 1995). The criteria for evaluating the quality of an artefact depends on the artefact type (March and Smith, 1995). Table 3.2 presents types of artefacts as described by (March and Smith, 1995) and their evaluation criteria.
Usually, evaluation is concerned with answering the question ’How well does the artefact work?’ (March and Smith, 1995). This question can be answered by identifying a suitable evaluation measure to validate the effectiveness of the artefact. An appropriate evaluation method is selected once the evaluation metrics and criteria are identified (March and Smith, 1995). The selection of an evaluation method should be carefully considered, and when suited with an