Karlsruhe Reports in Informatics 2019,1
Edited by Karlsruhe Institute of Technology,
Faculty of Informatics
ISSN 2190-4782
Characterization of the Bitcoin
Peer-to-Peer Network (2015-2018)
Till Neudecker
2019
KIT – University of the State of Baden-Wuerttemberg and National Research Center of the Helmholtz Association
Please note:
This Report has been published on the Internet under the following Creative Commons License:
Characterization of the Bitcoin
Peer-to-Peer Network (2015-2018)
Till Neudecker
Institute of Telematics, Karlsruhe Institute of Technology, Germany
till.neudecker@kit.edu
Abstract. Based on measurements performed between 2015 and 2018 we provide a characterization of the Bitcoin P2P network. The character-ization enables the parametrcharacter-ization and validation of simulation models and the assessment of the reliability of real-world experiments. Further-more, the network characterization provides insights into the behavior of peers and their operators. For instance, we provide evidence that Sybil events happened in the past in the Bitcoin P2P network. Additionally, our measurements show that the performance and anonymity of trans-action and block propagation has been improved by implementation and protocol changes.
Please note: This a a slightly edited excerpt from the publicly available1
dis-sertation Security and Anonymity Aspects of the Network Layer of Permission-less Blockchains [16]. This excerpt is intended as a reference for the collected dataset on the Bitcoin peer-to-peer network, which is published at https: //dsn.tm.kit.edu/bitcoin.
1
Introduction
The Bitcoin P2P network is real-world phenomenon, which is used as a basis for processing financial transactions in the range of several billion Euros per day.2
Its structure and behavior is subject to continuous variation and is influenced by numerous internal and external factors. First, the usage of Bitcoin on the application layer (i.e., the creation of transactions by users) varies, thus the information propagated through the network varies. Furthermore, the behavior of those users operating their own Bitcoin peer influences the network, e.g., by creating churn. Many client implementations that are used to connect to the network are actively developed and, therefore, their behavior changes over time. Finally, the underlying network infrastructure, which influences IP routes and network latencies, varies over time.
There are several reasons, why a characterization of the network is required in order to perform research on the network layer of permissionless blockchains. First, in order to perform simulations that produce results, which are applicable
1
http://dx.doi.org/10.5445/IR/1000089033
2
to the real-world system, the simulated network should resemble the real-world network. Therefore, a model of the real-world network has to be created. Sec-ondly, even when performing experiments directly in the real-world network, an ongoing characterization of the network is required to assess the reliability of the performed experiments. For instance, in order to avoid experiments being per-formed during periods with very unusual user or network behavior, an ongoing characterization is required. Furthermore, an ongoing network characterization helps in monitoring the effects of changes to client implementations. For instance, if changes are made, which aim at reducing propagation delays, the comparison of the observed propagation delay at different points in time can help monitor-ing the success of the implemented modification. Finally, by characterizmonitor-ing the network, insights on the human activity, which in the end creates the network, can be gained.
In this paper we will first describe the methodology used to characterize the network. Then, the network is characterized regarding its general, long-term properties. Finally, an analysis of a selection of unusual events and a discussion is presented.
2
Methodology
In order to characterize the Bitcoin P2P network, observations from the opera-tion of the network have to be made. Without access to link level data between remote peers of the network (e.g., obtained by packet sniffing at ISPs or internet exchange points), participating in the P2P network with a modified client is a common way to make observations from the network’s operation. We will now describe the system architecture and software design used to participate in the network and perform measurements. Furthermore, a description of the collected data and the accessibility and usage of the collected data is given.
2.1 Architecture & Software
The main idea of our measurement system is to run a modified client (monitor peer), which connects to all reachable remote peers and observes and logs the announcements of transactions and blocks made by other peers. One important principle in the design of our measurement infrastructure is to minimize the effect we have on other peers of the network. Specifically, we aim to reduce resources like bandwidth and processing power required by other peers to serve our measurement infrastructure. We acknowledge that while we participate in the network, we do not provide any service directly to the network and only consume resources.3 Scaling our approach to a large number of monitor peers to obtain more measurements could be considered a DoS attack on the network. We also chose to make our monitor peer not reachable by other peers, to avoid
3 This behavior is quite common in public P2P networks, such as filesharing systems,
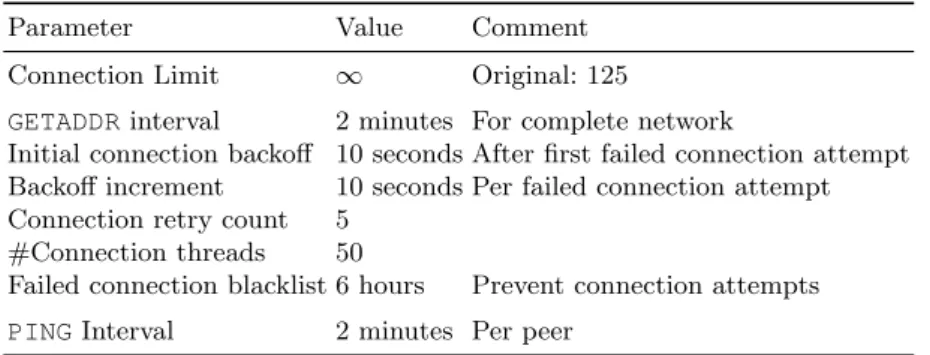
Table 1.Measurement system parameters.
Parameter Value Comment
Connection Limit ∞ Original: 125
GETADDRinterval 2 minutes For complete network
Initial connection backoff 10 seconds After first failed connection attempt
Backoff increment 10 seconds Per failed connection attempt
Connection retry count 5
#Connection threads 50
Failed connection blacklist 6 hours Prevent connection attempts
PINGInterval 2 minutes Per peer
other (non-reachable) peers to establish connections to our monitor peers, which do not provide any service to them.
The monitor peer has several functional and non-functional requirements. First, it needs to be able to establish and maintain connections to several thou-sand Bitcoin peers. In order to do that, it also needs to discover IP addresses of remote peers to connect to. Furthermore, it has to monitor and persistently log inbound messages from its neighbors. Finally, it should measure the latency to remote peers, which is a parameter usually required to perform network simula-tions.
In addition to these functional requirements, there are also non-functional (i.e., performance) requirements. First, the discovery of reachable IP addresses and the successful establishment of connections should be fast. This is especially important, because the number of reachable peers is much smaller than the total number of IP addresses obtained through the peer discovery mechanism. Furthermore, the monitor peer has to be capable of processing and storing a large amount of inbound data (in the range of several gigabytes per hour). Finally, inbound messages have to be timestamped precisely, i.e., the logged time of reception of a message should be close to the actual reception of the messageon the wire.
We rejected the option to write a monitor client implementation from scratch, because of the required effort. Instead, we chose to base our monitor peer im-plementation on the Bitcoin reference client imim-plementation bitcoind (version 0.10) to ensure compatibility of our monitor peer with other peers. We will now describe the changes made to the client implementation in order to satisfy all requirements listed above.4 Furthermore, we will describe the used parameters, which are also summarized in Table 1.
Connection Limit The maximum number of connections in bitcoind is limited by two independent factors. First, the number of connections is limited to 125 by default by a configured constant value, which we simply removed. Secondly,
4 Many aspects of bitcoind have been changed in newer releases of bitcoind. Therefore,
bitcoind 0.10 uses the POSIXselectAPI5in order to access its network
sock-ets. However, selectonly supports up to 1024 sockets, i.e., the total number of connections is limited to 1024. While later versions of bitcoind abandoned the select API in favor of a completely asynchronous software architecture, we opted for a less invasive change and replacedselectby the epollsystem call.epollprovides a similar interface as select, and allows more than 1024 concurrent connections.
Peer Discovery & Connection Attempts In order to receive IP addresses of other peers to connect to, a client can sendGETADDRmessages to its neighbors, which in turn respond with a list of up to 1000 IP addresses. The interval with which our monitor peer sends out these GETADDRmessages is a tradeoff between the number of available IP addresses (and, therefore, the number of connections that can be established) and the effort (e.g., bandwidth usage) created at remote peers. In accordance to our principle of minimizing the effect on other peers, we configured our monitor peer to send on average one GETADDRmessage every 2 minutes to one of the connected peers (i.e., at 10,000 connected peers, one peer receives oneGETADDRmessage every 2 weeks on average). Because IP addresses are also announced unsolicited by other peers, the configured request frequency turned out to be sufficient to supply enough IP address for the establishment of connections.
Received IP addresses are stored in a local database and used for connection requests. The strategy used for the establishment of connections has to account for several aspects: First, only a very small share of the announced IP addresses are actually reachable (e.g., because peers are located behind NAT routers or peers terminating their client), i.e., a large number of connection attempts has to be made for a small number of successful connection establishments. Secondly, even reachable peers can be temporarily not reachable, because the remote peer already has hit its own configured limit on the number of connections. Finally, connection attempts should be rate limited in order to avoid being classified as abusive traffic and in order to conform to the principle of least effect on other peers.
We implemented the connection establishment strategy as a parallelized sys-tem using a configurable number of threads, which continuously try to establish connections. Rate limitation is implemented as a linear backoff, i.e., the minimum interval between two connection attempts increases with every failed connection attempt by 10 seconds. After a certain number of failed connection attempts, an IP address is removed from the database and blacklisted for a certain duration. The IP address will be added once the blacklist period expired and it is again announced by another peer. The strategy has many configuration parameters listed in Table 1, which all balance the speed of connection establishment and the bandwidth usage of our monitor peer and of other peers. The operation of the monitor peer shows that a high degree of parallelization (e.g., 50 threads establishing connections) is beneficial for a fast establishment of connections.
Contrary, the minimum interval between connection attempts as well as the maximum number of connection attempts was set quite low (e.g., 10 seconds initial backoff, at most 5 connection attempts).
Message Logging The main message type that is monitored by our monitor peer are INV messages, which announce blocks and transactions by their hash value. In order to estimate propagation delays, a precise timestamping of these messages is required. Therefore, it is important to avoid any processing delay between the reception of a message and its timestamping. bitcoind 0.10 sepa-rates the processing of messages into two threads: ThreadSocketHandler reads incoming data from the sockets into queues for later processing by ThreadMes-sageHandler. We chose to keep this software architecture, as it enables a fast timestamping directly after reading a message from the socket in the Thread-SocketHandler. In order to avoid any delays in ThreadSocketHandler, we also removed any functionality that requires the acquisition of locks, which might be held by slower threads.
ThreadMessageHandler processes the messages written into queues for each neighbor peer.INVmessages are directly written to permanent storage in binary format containing the announced hash value, the announcing IP address, and the timestamp as set by the ThreadSocketHandler. ADDRmessages are used as input to the modified peer discovery mechanism (see above). PING messages triggerPONGreplies according to the protocol specification, in order to prevent connections from being closed. The processing of all other message types has been removed to avoid unnecessary delays and complexity. All further processing of the measured data is done independently from the monitor peer.
Latency Measurement Our monitor peer uses three distinct methods for the mea-surement of latencies to remote peers. First, the Bitcoin protocol PING/PONG
messages are used to measure the time between sending a PING message and receiving a PONG message. One advantage of these messages is that all peers respond to these messages. Because the messages are handled by the Bitcoin client itself, this method measures not only the network link latency, but also the delay introduced by the client software such as processing times and waiting times for the acquisition of locks. The second method we use is sending ICMP echo messages. In contrast to the Bitcoin protocol PING messages, responses to ICMP messages are sent by the underlying operating system, hence no ap-plication delays are introduced.6 One drawback of ICMP echo messages is that a substantial number of peers do not respond to ICMP echo messages because of firewalls or network stack configuration. Therefore, the third method we em-ploy are TCP SYN pings: A TCP SYN packet is sent to a peer’s port running Bitcoin and the time until either a RST or a SYN/ACK packet is received is measured as a round-trip time. This method is commonly used by network scan-ners (e.g., nmap), and has the advantage that almost all peers respond to TCP SYN messages.
6 Delays can be introduced by the operating system, if the complete system is
All three methods are implemented within the monitor application as three additional threads, which regularly send all types of pings to remote peers and monitor the reception of the responses. In order to avoid storing the sending time of all sent ping messages, the sending time of the messages are stored in the ICMP payload and in the TCP sequence number, respectively. The measured round-trip times of all methods are stored as-is, i.e., no aggregation or combination is performed during the monitoring process, as such processing can be performed later in the analysis process (cf. Section 3.3).
2.2 Dataset
We will now describe the acquired dataset. Measurements initially started in July 2015, however, several features of the monitor peer were added subsequently. As of April 2018, the measurements are ongoing. During the observation period there are several short measurement gaps, e.g., because of maintenance events, network outages, and system restarts. Furthermore, there is one larger measure-ment gap (December 21st 2015 until January 29th 2016) due to a unrecoverable disk system failure. As of April 2018 the total amount data accumulates to around 12 terabytes per monitor peer, i.e., 24 terabytes in total.
Aggregated data including continuously generated statistics have been made available to the research community7 under a Creative Commons license.8
Fur-thermore, anonymized snapshots of the network are provided. The data has been used in several scientific publications, e.g. [13,8].
Our monitor peers collect data from four different categories. We will now briefly describe the collected raw data.
Churn The collected churn data consists of tuples containing the current times-tamp, the IP address of the remote peer, and the event to be logged. Logged events are the establishment of a connection, the closing of a connection, and the reception of a version message from a remote peer. Since April 2016, the logged version event also contains the announced client version string. Furthermore, since April 2016 the monitor peers also regularly log the set of all connected peers. Since May 2017 the logged version event additionally contains the an-nounced services and version bits.
Latency As described above, the monitor peers regularly send various types of ping messages to their peers. The collected data consists of tuples containing the current timestamp, the IP address of the remote peer, the type of the ping message, and the measured latency. For every reception of a pong message, such a tuple is created. Failed ping attempts, i.e., sending a ping message without receiving a corresponding pong message, are not logged.
7 https://dsn.tm.kit.edu/bitcoin
INV The reception of INV messages is logged as tuples consisting of the current timestamp, the IP address of the remote peer, and the announced hash value. While one INV message can announce multiple single hash values, each hash value is logged individually, but with the same timestamp.
ADDR The reception of each ADDR message is logged using the the current timestamp, the IP address of the remote peer, and the list of announced IP addresses including the nTime parameter for each announced address.
3
General Network Properties
We will now describe and discuss the long-term results of our measurements since July 2015. A detailed analysis of certain short-term events will be presented in Section 4.
3.1 Connections
We will first analyze properties of the connections established to other peers, specifically, the number of established connections, the connection duration, and the churn.
Connection Count The number of peers participating in a P2P network is of interest, because it indicates user adoption of the system and is also important when assessing the possibility of certain types of attacks on the network. Because we can only connect to reachable peers, we do not know the total number of peers on the Bitcoin P2P network. However, the number of reachable peers can be approximated by the number of established connections by our monitor peers. Fig. 1 shows the number of connections maintained by our monitor peers between July 2016 and April 2018. For earlier dates, the number of connections can only be unreliably approximated, because of missing data.9 The plot shows the number of IPv4 and IPv6 connections, and the total number of connections, which is the sum of IPv4 and IPv6 connections. Furthermore, the number of
Sybil connections is displayed. Sybil connections refer to multiple established connections by the same IP address, i.e., the number of Sybil connections is the difference between the total number of connections and the number of unique IP addresses we are connected with.10
Data from both monitors overlap generally overlap closely, with only a few exceptions (e.g., in October 2017). The total number of connections varied be-tween less than 6,000 connections in late 2016 and around 14,000 connections
9 Until July 2016 only the establishment and closing of connections was logged, which
would be only sufficient to derive the number of established connections, if the monitor peer was continuously running.
10
Sybil here refers to a very simple and easy to detect form of a Sybil attack. Of course, a single person running a large number of peers with different IP addresses would still be considered a Sybil attack, but would not be detected that easily.
0 2000 4000 6000 8000 10000 12000 14000 16000
Jul’16 Sep’16 Nov’16 Jan’17 Mar’17 May’17 Jul’17 Sep’17 Nov’17 Jan’18 Mar’18
Numb er of Connections Total IPv4 IPv6 Sybil
Fig. 1.Measured number of connections between July 2016 and April 2018 for both monitor peers. The same line colors are used for both monitor peers, because of pre-dominantly overlapping graphs.
in 2018. The number of IPv4 connections increased at a relatively constant rate during 2017 (with the exception of a few peaks). The number of IPv6 connec-tions increased from less than 2,000 to 4,000 until September 2017, but started to oscillate between 4,000 and 2,000 connections. This oscillation is caused by IPv6 tunneling protocols, as we will discuss later (cf. Fig. 6).
The number of Sybil peers is generally very low (less than 50 prior to July 2017, less than 200 after August 2017), with the exception of short events in June 2017 and August 2017. We will discuss these events in detail in Section 4.1. In order to assess the validity of our measurement, we compare our results to available results obtained by independent measurements. We are aware of two projects, which perform similar measurements: Bitnodes11uses a Python based
monitor implementation12to connect to peers of the Bitcoin network. It also
ob-tains IP addresses of reachable peers using the in-band peer discovery mechanism and establishes connections them. Coindance13 also publishes measurements on
the total number of peers, however, no differentiation for IPv4 and IPv6 con-nections are made. Furthermore, no information on the used methodology is provided.
Fig. 2 shows a comparison of the number of connection as measured by us (KIT), Coindance, and Bitnodes. The Bitnodes IPv4 connection count follows very closely the IPv4 connection count measured by us. Even short peaks are congruent in both datasets. However, the Bitnodes IPv6 connection count shows a larger deviation to our measurements, with a consistently smaller number of IPv6 connections reported by Bitnodes (ranging from a minimum difference of 11
https://bitnodes.earn.com/
12https://github.com/ayeowch/bitnodes
0 2000 4000 6000 8000 10000 12000 14000 16000
Jul’16 Sep’16 Nov’16 Jan’17 Mar’17 May’17 Jul’17 Sep’17 Nov’17 Jan’18 Mar’18
Numb er of Connections Total (KIT) Total (Coindance) IPv4 (KIT) IPv4 (Bitnodes) IPv6 (KIT) IPv6 (Bitnodes)
Fig. 2. Comparison of the number of connections according to our measurements
(KIT), and the number of connections reported byCoindance andBitnodes.
200 in Feb 2017 to a maximum difference of more than 2,000 connections during summer 2017 and January 2018).
The total number of connections reported by Coindance lies between our mea-sured total number of connections and the number of IPv4 connections. Since August 2017, the number reported by Coindance is very close to our number of IPv4 connections, leading to the guess that Coindance only establishes IPv4 connections (or a very small number of IPv6 connections). Until August 2017, Coindance could have either established a similar number of IPv6 connections as we and Bitnodes, or Coindance could have established more IPv4 connections than we did. While there are differences between all three measurements, we emphasize that all measurements deviate only to a reasonable extend, all mea-surements reproduce the same general trends, and all meamea-surements show the same short-term effects.
Churn & Connection Duration Besides the size of the P2P network, the churn is an important property of P2P networks. Peers entering and leaving the network can be a representation of user behavior [11]. However, we cannot directly measure churn, as connections established between two remote peers are not observable to us. The only events we can observe, are the establishment and closing of connections to or from our monitor peers. These events, however, can be used to gain insights on the churn of the network.
One important observation is the duration for which peers stay connected to our monitor peer. There are two ways to sample this value: First, we can select a random point in time and create a statistic over the connection durations of all peers that are connected to our monitor peer at that point in time. Secondly, we can consider a time interval and create a statistic over the connection durations of all peers that were connected during that period. Both approaches differ in the statistical population, with long connection durations dominating the first
0 0.1 0.2 0.3 0.4 0.5 0.6 0.7 0.8 0.9 1
Jul’16 Sep’16 Nov’16 Jan’17 Mar’17 May’17 Jul’17 Sep’17 Nov’17 Jan’18 Mar’18
Sha re of Conn ected P eers ≥1 min ≥1 hour ≥1 day ≥1 week ≥1 month
Fig. 3.Share of connected peers with a connection duration longer than one minute, hour, day, week, or month, respectively. Every data point shows the average per day (48 measurements). The lines show moving averages over the range of one month.
population, whereas short connection durations dominate the second popula-tion. Furthermore, the composition of the second population depends on the considered time interval. Therefore, we chose to sample the connection duration of peers connected at distinct points in time.
Fig. 3 shows the share of peers connected for at least a certain duration to our monitor peer since July 2016. Each data point is the average of 48 measurements (i.e., 24 measurements per day for two monitor peers), the lines are moving averages over a period of one month. Consistently, around 99 % of peers are connected for at least one minute. Between 90 % and 95 % of connected peers are connected for at least one hour. The average share of peers connected for at least one day varies between 55 % and 75 %, the share of peers connected for at least one week varies between 20 % and 50 % Finally, between 0 % and 20 % of connected peers are connected for more than one month.
The large variance in the share of peers connected for more than one month is caused by the regular loss of connections because of system restarts or network outages. After such an event, it takes one month until peers are connected for one month again. Therefore, the share of peers being connected to the Bitcoin network for more than one month, can be expected to be close to the maximum observed share (i.e., around 20 %).
Compared to measurements of churn in P2P networks primarily used for file sharing (e.g., Kademlia [11]), many peers are connected to the Bitcoin network for a very long duration. This indicates that running a peer is not directly as-sociated with user activity in Bitcoin. Users of file sharing systems usually run their clients on their desktop computers, start the client when downloading a file, and quit the client after finishing the download. In contrast, operators of Bitcoin peers often seem to continuously run their clients on hosted machines (cf. Fig. 8). Furthermore, while the estimated total number of Kademlia peers
0 5000 10000 15000 20000 25000 30000 35000 40000 45000
Jul’16 Sep’16 Nov’16 Jan’17 Mar’17 May’17 Jul’17 Sep’17 Nov’17 Jan’18 Mar’18
Numb er of (Dis-)Connects p er Hour Connect Disconnect
Fig. 4. Number of connections established and closed, respectively, per hour. Points show data averaged per day. Lines show moving averages over the range of one week.
oscillated with a frequency of 24 hours, indicating human behavior, the total number of Bitcoin peers does not show such an oscillation.
As previously discussed, the used sample method favors connections with long connection durations. Therefore, Fig. 4 shows the number of connections established per hour, and the number of connections closed per hour. This gives a complementary view on churn, because it completely ignores the duration of connections, but only focuses on the establishment and loss of connections. Each data point shows the daily average, the lines indicate moving averages (one week). The average number of established and closed connections per hour, respectively, varies between a few hundred and several thousand. Furthermore, the moving averages of connect and disconnect events seem to overlap perfectly during the displayed interval.
Both observations seem to contradict the previously presented measurements regarding the total number of connections (which increased from 6,000 and 14,000), and the long durations of connections. However, the results are not con-tradicting but show different aspects of churn: First, while there is an increase in the number of connections, it is too small to be visible as a difference in the number of connects and disconnects at the scale of the shown plot. Secondly, the majority of connections established by our monitor peers are closed within a few seconds. Often, connections to one single remote peer are established and closed on a continuous basis.14 Although only few such connections are established at
any single point in time, they account for the majority of (dis-)connect events.
Client Versions After establishment of a new connection, both clients send a
version message to the remote peer to indicate their version string, their pro-tocol version number, and their services. The main goal of the exchange of this
14Remote peers may chose to disconnect from our monitor peer after detecting that
0 1000 2000 3000 4000 5000 6000 7000
Apr’16 Jul’16 Oct’16 Jan’17 Apr’17 Jul’17 Oct’17 Jan’18
Numb er of Connections /Satoshi:0.12.1/ /Satoshi:0.13.2/ /Satoshi:0.14.1/ /Satoshi:0.14.2/ /Satoshi:0.15.0.1/ /Satoshi:0.15.1/ /Satoshi:0.16.0/ /Bitcoin ABC:0.16.1(EB8.0)/
Fig. 5.Number of peers announcing displayed version string for the top eight version strings between April 2016 and April 2018.
information is to ensure compatibility between both clients of a connection. For instance, clients that support the Bitcoin Cash fork and are, therefore, incom-patible with clients supporting the Bitcoin main chain, announce a distinguished set of services. Furthermore, certain protocol extensions such asBloom filters[4] andSegregated Witnesses [12] are encoded in the announced services.
Fig. 5 shows the number of peers announcing a certain client version between April 2016 and April 2018 for the eight most common version strings during that period. Except for one version of the Bitcoin ABC client, which supports the Bitcoin Cash fork, all most common version strings belong to different versions of the Bitcoin reference client implementationbitcoind, announced as/Satoshi:xx/
(xx denoting the client version number). Whenever new versions of bitcoind
are released, the deployment of these versions at the monitored peers can be observed. Usually, there is an increase in the number of peers running a new version in the first two months after the release of the new client version. This gradual adoption of new client versions is likely caused by peers being operated by a large number of distinct users. Each user chooses their own time to upgrade on a new client version based on factors like importance of the update to the user, available time to actually perform the upgrade, and reluctance to use a new version because of possible bugs. As these factors are highly subjective and vary from user to user, the deployment of a new client version takes the observed time.
Contrary, the number of peers using the Bitcoin Cash client Bitcoin ABC
increased from 0 to more than 700 within one day. A thorough discussion of the Bitcoin Cash fork will be presented in Section 4.1.
3.2 IP Properties
So far we have only considered information directly obtained from the estab-lishment and closing of connections to remote peers. Because all connections are
0 500 1000 1500 2000 2500
Jul’16 Sep’16 Nov’16 Jan’17 Mar’17 May’17 Jul’17 Sep’17 Nov’17 Jan’18 Mar’18
Numb er of P eers Native Teredo 6to4
Fig. 6.Number of IPv6 peers using native IPv6, Teredo, and 6to4 between July 2016 and April 2018.
established using TCP and peers are addressed using their IP addresses, the characterization of the Bitcoin P2P network can also rely on information that can be associated to remote IP addresses. In the remainder of this subsection we will look at the usage of IPv6 tunneling protocols, and the countries and autonomous networks associated with the IP addresses of remote peers.
IPv6 Tunnel In order to allow hosts that are connected only via IPv4 to communicate with IPv6 hosts, several tunneling protocols exist, withTeredo [10] and 6to4 [2] being the most prominent ones. The use of both protocols by a remote host becomes evident, because both protocols use a specified range of dedicated IPv6 addresses. Therefore, based on the IP address of a remote peer, we can determine whether the remote host is using native IPv6 or one of the tunneling protocols for its IPv6 communication.
Fig. 6 shows the number of IPv6 peers using native IPv6, Teredo, and 6to4, respectively. During the displayed period, the number of native IPv6 peers in-creases from less than 1,000 in late 2016 to more than 1,500 in 2017 and 2018. The number of 6to4 peers remains at a low level between 50 and 150. The num-ber of Teredo peers shows several abrupt rises and declines during the displayed period. For instance, it increases from less than 100 to more than 1,000 within a few days in March 2017, falls from more than 2,000 peers to almost zero (around 10) several times in 2017 and 2018, and increases back to more than 2,000 peers. The increases and drops in the number of Teredo peers correspond to the observed changes in IPv6 connections in Fig. 1. We will discuss possible reasons for this observation in Section 4.1.
Countries During the assignment process of IP addresses, information about the assignee is stored in databases of organizations such as ICANN and RIPE. This information can be retrieved using the WHOIS protocol [5], in order to
0 1000 2000 3000 4000 5000 6000
Jul’15 Oct’15 Jan’16 Apr’16 Jul’16 Oct’16 Jan’17 Apr’17 Jul’17 Oct’17 Jan’18
US DE CN FR NL CA RU GB
Fig. 7.Number of peers per country for the eight countries with the most peers.
determine the countries, to which the IP addresses were registered. Although this information is not 100 % accurate, it gives a reasonable impression of the geographic distribution of peers among various countries.
Fig. 7 shows the eight countries, with the most peers during the displayed period from July 2015 until April 2018. Consistently, most peers are located in the US (ranging from around 1,500 to more than 5,000). Between 500 and 1,800 peers were located in Germany during the observed period. The number of peers located in China increased from less than 400 in April 2017 to more than 2,500 in April 2018.
As peers from the US account for roughly one third of all reachable peers, and many peers are located in Western Europe, the geographical and politically distribution of peers can be regarded as somehow centralized, although there are peers from other continents as well.
Autonomous Systems For internet routing purposes, a set of IP addresses under a single technical administration (e.g., under the control of one ISP) is grouped into oneautonomous system (AS) [9]. The AS of an IP address can be resolved using BGP data or using the WHOIS protocol.
Fig. 8 shows the number of peers per AS for the eight most common AS’s. As of April 2018, the two AS’s with the most peers both are assigned to Chinese ISPs (Chinanet and Alisoft). The number of peers in the Chinanet AS increased from zero in January 2018 to more than 1,200 within less than two month. All of the Chinanet peers (with the exception of two peers) are announcing the same client version (Satoshi 0.15.1), which leads to the guess that those peers are administrated by one single party. The AS with the third most peers (AT-88-Z) is assigned to the US based company Amazon. The number of peers in the Amazon AS shows some short peaks, e.g., in June and November 2017.
The data shows that a large number of peers is located at cloud and host-ing providers, i.e., many peers are run on hosted servers and not at home. For
0 200 400 600 800 1000 1200 1400 1600
Jul’15 Oct’15 Jan’16 Apr’16 Jul’16 Oct’16 Jan’17 Apr’17 Jul’17 Oct’17 Jan’18
CHINANET-JS ALISOFT AT-88-Z OVH CONTABO GOOGLE-CLOUD OVH-200141d00000 LINODE-US
Fig. 8.Number of peers per AS for the eight AS’s with the most peers.
40 50 60 70 80 90 100 110 120
Oct’15 Jan’16 Apr’16 Jul’16 Oct’16 Jan’17 Apr’17 Jul’17 Oct’17 Jan’18
Average Median Latency [ms] BTC Ping ICMP/SYN Ping
Fig. 9.Average median measured latency from monitor peers to remote peers.
instance, the largest AS from the ISP Verizon only has 72 peers.15 In general,
the data shows a similar centralization as seen on the country level, but on a more fine grained level and focusing on internet structure instead of political structure. It has been shown that this AS-level centralization makes the Bitcoin P2P network vulnerable to routing attacks [1].
3.3 Latency
Besides properties of the remote client and their IP addresses, our monitor peers also perform regular estimations of the latencies to their neighbors. As previously described, latencies are measured using Bitcoin protocol ping messages, ICMP echo messages, and TCP SYN messages.
15Verizon manages a large number of different AS’s, which might reduce the number
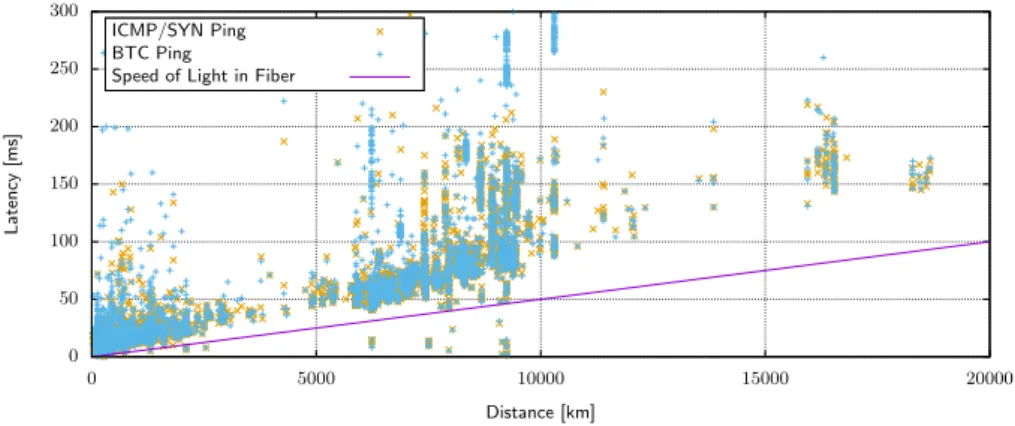
0 50 100 150 200 250 300 0 5000 10000 15000 20000 Latency [m s] Distance [km] ICMP/SYN Ping BTC Ping
Speed of Light in Fiber
Fig. 10. Average measured latency per remote peer w.r.t. distance to remote peer.
Data from 1st July 2017. Furthermore, the speed of light in fiber (200.000 km/s) is
displayed.
Fig. 9 shows the development of theaverage median latency from July 2015 until April 2018: First, the median of all measured latencies within one hour (typically 30 to 60 single measurements) of each peer is calculated. Then, the average of these medians over all peers is calculated and displayed as one data point in the plot. Finally, the lines show moving averages over one month of data points. Measured latencies using the ICMP echo method and using the TCP SYN method are regarded as one measurement, because of their similar handling by the operating system network stack, and their resulting similar measured latencies.
The measured latency using ICMP/SYN remains relatively constant between 50 ms and 60 ms until October 2017. From October 2017 until April 2018, the observed latencies as well as their variance increase drastically. We will now discuss possible reasons for this increase in the measured latency.
First, the measured latencies seem to originate from a bimodal distribution: While many data points still show a latency of about 60 ms, other data points indicate latencies of more than 100 ms. A closer look into the collected data reveals that starting in September 2017, the measured latencies strongly vary in the course of a day, with high measured latencies during working hours (around 6am to 6pm, weekdays only), and low measured latencies at night. Because both monitor peers show the same behavior and run on different hardware, we can exclude a saturation of the monitor peers itself as the cause of the increased measured latency. Furthermore, we also see the effect of an increased measured latency to peers that are topologically close to our monitor peer, e.g., a peer located at the University of Erlangen, which is connected with KIT directly through theGerman National Research and Education Network (DFN). Hence, we suspect that saturation of the KIT network may cause the increased observed latency.
Fig. 9 also shows that the latencies measured using Bitcoin protocol pings increased much less since October 2017. In contrast to ICMP and TCP SYN packets, these messages are transmitted through an existing TCP connection. Upon reception of a packet, stateful firewalls usually try to match packets to an existing connection, which can be done very fast. If no such connection exists, the firewall has to evaluate the packet against its ruleset, which can be much slower. Therefore, a saturation of the ruleset evaluation of a stateful firewall at KIT could cause the observed effect. We contacted the technical staff in charge of the network infrastructure at KIT, however, no data was available to confirm our observation.
The latency between two hosts on the internet is the sum of all processing delays of all routers on the path between and the hosts, and the transmission delays of all links between routers. A lower bound on the possible latency between two hosts can be calculated as the quotient of the distance between both hosts and the speed of light in fiber. Fig. 10 shows the average measured latency for every remote peer depending on its distance to our monitor peers in Karlsruhe, Germany. The location of remote peers is obtained using the Maxmind GeoIP Database.16Furthermore, the speed of light in fiber (200.000 km/s) is displayed.
As can be seen, a small number of peers seem to have a latency that is lower that what is physically possible. There are two possible reasons for these errors: First, the distance estimation can be wrong, caused by a wrong mapping between IP address and location. As IP address ranges are frequently transferred between ISPs, such inaccuracies are quite common.17 Secondly, we cannot exclude the possibility of wrong measurements.
Fig. 10 also shows that the latency to many peers is only slightly larger than the physically possible minimum latency. This means that the overall latency to these peers is dominated by the limited propagation velocity, and not by processing delays or queuing times. This observation is coherent to our previous observation that many peers are hosted at hosting providers and not connected via consumer ISPs, where a larger effect of thelast mile, i.e., the communication link to the consumer’s home, could be expected.
3.4 Propagation of Transactions and Blocks
So far we have only focused on (derived) properties of remote peers, but not on the behavior of the peers and the network in general. We will now look at the announcement and propagation of information (i.e,, transaction and blocks) over the Bitcoin P2P network.
INV Announcements per Hour Fig. 11 shows the total number of received INV announcements per hour per monitor peer since July 2015. One INV an-nouncement means the anan-nouncement of a single hash value, multiple of which
16http://dev.maxmind.com/geoip/
0 5×10⁷ 1×10⁸ 1.5×10⁸ 2×10⁸ 2.5×10⁸
Oct’15 Jan’16 Apr’16 Jul’16 Oct’16 Jan’17 Apr’17 Jul’17 Oct’17 Jan’18 0 50000 100000 150000 200000 250000 300000 350000 400000 450000 Observed INV Announcements p er H o ur Confirmed T ransactions p er Da y TX INV
Fig. 11.Total number of observed INV announcements per hour per monitor peer from July 2015 until April 2018. For comparison, the number of confirmed transactions (i.e., the number of transactions included in the blockchain) is also displayed.
can be announced within one single INV message. The lines indicate moving av-erages over the time interval of one week. In addition to the number of received INV messages, Fig. 11 also shows the number of transactions included in the blockchain per day.
Every valid transaction published on the network should be announced by every peer to all of their neighbors. Therefore, the number of received INV an-nouncements should be equal to the number of published transactions multiplied by the number of connections (cf. Fig. 1). As can be seen from the plots, this relationship roughly holds.18In detail, the relationship does not hold because of several reasons: First, peers may stay passive and not announce transactions at all to our monitor peer. This behavior can be observed for several hundred peers. Secondly, peers may also announce a single transaction hash more than one time. This behavior can be observed for around 50 peers. Peers may also come to dif-ferent decisions whether transactions should be forwarded or not, depending on the fee specified in the transaction, or depending on the used scripts. Further-more, a transaction may be published on the P2P network, but not included in the blockchain, e.g., because its fee is too low.
During the considered time interval, the number of received INV announce-ments varied between less than 30 million per hour in 2015, and more than 150 million per hour in late 2017. Because of the limited capacity of Bitcoin blocks, the fee required for transactions to be included in a block increases, if more transactions are published than can be included in blocks in a timely manner.
18For instance, there were roughly 260,000 transactions included in the blockchain in
January 2017, i.e., 11,000 transactions per hour. Our monitor peer had around 6,000 connections at that time, hence around 65 million INV announcements per hour can be expected, which is coherent to the number of received INV announcements.
0 5 10 15 20 25 30
Oct’15 Jan’16 Apr’16 Jul’16 Oct’16 Jan’17 Apr’17 Jul’17 Oct’17 Jan’18
Seconds
90% Block Percentile 50% Block Percentile 90% TX Percentile 50% TX Percentile
Fig. 12. Bitcoin propagation delay for block and transaction propagation (50 % and 90 % percentiles).
This effect can be seen during the period of in late 2017.19 It was speculated,
whether the large number of transactions was intentionally created, in order to increase the required fee for transactions to be included into the blockchain. Furthermore, a relation to the fork of the Bitcoin Cash blockchain is subject of discussion.20.
Propagation Delay As transactions and blocks are flooded through the net-work, we can indirectly observe this flooding process by observing the announce-ments made by remote peers to our monitor peers. Upon reception of an INV announcement from a remote peer, we can conclude that this peer has previously received the corresponding transactions or block. However, we cannot precisely estimate the exact time a remote peer has received a specific message, because of delays between the reception of messages and their announcement to other peers. This effect is stronger for transactions, because the announcement of transac-tions is deliberately delayed by longer periods, whereas blocks are announced immediately after validation.
A common measure, which reflects the propagation delay in a network, is the time between the start of information dissemination and the time until a certain percentage (e.g., 50 %) of peers have received the information. In order to calculate that value, we use the timestamp of reception of INV announcements by remote peers as the assumed time of reception of information by the remote peers. Then, the time between the first reception of an announcement with a specific hash and the reception of announcements containing that hash value by 50 % of peers is measured. Fig. 12 shows the resulting propagation delays for blocks and transactions (for 50 % and 90 % percentiles) since July 2015. 19
https://jochen-hoenicke.de/queue/#1,all
20
0 2 4 6 8 10 12
Oct’15 Jan’16 Apr’16 Jul’16 Oct’16 Jan’17 Apr’17 Jul’17 Oct’17 Jan’18
Seconds
50% Percentile (KIT) 50% Percentile (bitcoinstats) 50% Percentile (bitnodes)
Fig. 13. Comparison of the 50 % block propagation percentile of our measurements
(KIT), and the measurements performed bybitcoinstats andbitnodes.
Since 2015, block propagation delay has decreased from more than six sec-onds in 2015 until 50 % of peers have announced a block, to less than one second in 2018. Consistently, the 90 % percentile decreased from more than 15 seconds in 2015 to around two seconds in 2018. There are two main reasons for this increase in block propagation speed: First, relay networks, such as FIBRE21, transmit blocks using forward error correction and UDP communication at transmission rates close to physical limits (i.e., speed of light in fiber). Secondly, extensions to the Bitcoin protocol itself enable a faster transmission of blocks by only sending transactions IDs instead of the complete transaction, which is possible because most transactions have been previously received by peers through the transac-tion propagatransac-tion process [3]. Furthermore, performance improvements in client implementations (e.g., using hardware optimization for SHA256 hashing) also decrease the required time to verify new blocks, which reduces overall propaga-tion delay.
On the other hand, transaction propagation delay decreased until February 2016 (to around one second for the 50 % percentile) and increased since then to around 5 second for the 50 % percentile. Transaction propagation delay is mostly caused by deliberately delaying the forwarding of transactions to enhance anonymity and topology hiding. In bitcoind versions prior to 0.12, a change to the software architecture rendered the implemented transaction delay mecha-nism useless, effectively forwarding transactions immediately. bitcoind 0.12 was released in February 2016 with a modified transaction delay mechanism, which delayed transaction forwarding by a longer duration.22 These changes are well
reflected in the observed transaction propagation delay, especially in the 90 % percentile.
21http://bitcoinfibre.org/stats.html
In order to assess the validity of our measurement, we compare our results to available results obtained by independent measurements. We are aware of two projects, which perform similar measurements, namely Bitnodes, which was described in Section 3.1, and bitcoinstats23, which is operated by the authors of [6]. In contrast to our measurements, Bitcoinstats connects only to 250 to 1,000 randomly selected peers and monitors INV announcements from these peers.
Fig. 13 shows a comparison of the 50 % block propagation percentile for all three data sources. In order to enhance readability, single data points were omitted for our measurements, and only the moving average is displayed. No data prior to April 2016 was available for bitnodes. In general a high correspondence between all three datasets can be seen: The long-term trend as well as short-term variations (e.g., a decrease in March/April 2017 followed by an increase in May 2017) are mostly congruent among all measurements.
However, there are also systematic differences in the collected datasets: Until mid-2017, bitnodes reported the fastest transaction propagation, often around 2 seconds faster than our measurements, which makes a significant difference if the measurements are 3 or 5 seconds, respectively. The transaction propagation delay reported by bitcoinstats is only slightly lower than the one observed by us, and higher than the one reported by bitnodes.
We will now discuss possible reasons for these deviations. All results were obtained using monitor peers located in Europe, hence, no significant difference in latencies to other peers should exist among the three measurements. Further-more, even if measurements were conducted from other continents, the expected latency difference would be in the range of a few hundred milliseconds (cf. Sec-tion 3.3), which is not enough to explain the observed differences. As discussed in Section 3.1, the number of connections differs between our measurements and the measurement performed by bitnodes. Being connected to a different subset of peers can make a difference in the observed propagation delay, depending on how fast each subset of peers forward transactions. However, the monitor peer operated by bitcoinstats establishes only 250 to 1,000 connections to random peers and the results are still very similar to the other results. Hence, we sus-pect that the effect of which peers are selected on the propagation delay to be negligible.
A possible explanation for the deviating results could be the method of cal-culating the percentile values from the collected raw data, i.e., all three projects observe the similar raw data, but might process them slightly differently. Al-though the calculation of a percentile seems straightforward, there are several parameters, which can affect the output. The main question is which remote peers constitute the statistical population. An obvious answer would be to use the set of connected peers as the statistical population. This approach comes with several problems: The set of connected peers is not constant over time. Furthermore, the set of connected peers includes peers that do not announce a single transaction or block, i.e., that stay completely passive. If more than 10 % of all connections are to such passive peers, we will not receive INV
4.6 4.7 4.8 4.9 5 5.1 5.2 5.3 5.4
24-Mar’18 25-Mar’18 26-Mar’18 27-Mar’18 28-Mar’18 29-Mar’18 30-Mar’18 31-Mar’18
4×10⁷ 5×10⁷ 6×10⁷ 7×10⁷ 8×10⁷ 9×10⁷ 1×10⁸ 1.1×10⁸ Propagation D e la y [Seconds] Observed INV Announcements p er Hou r 50% TX Percentile INV
Fig. 14.Total Number of observed INV announcements per hour and the 50 % trans-action propagation percentile between March 24th, 2018, and March 31st, 2018.
ments from 10 % of peers, hence, we cannot even calculate a 90 % percentile. This means that the statistical population has to be reduced to the set of peers, which actually announce a new message within a certain interval after the first observation of a new message. The choice of that interval determines the number of outlier peers (i.e., peers which announce a hash many seconds, minutes, or even hours after its first reception) in the statistical population. For instance, choosing a small interval reduces the number of peers with high propagation delays, hence reducing the measured percentiles. We suspect that differences in the choice of parameters cause the deviation between the measurements. We also emphasize that apropagation percentile is not a directly measured value, but is derived from measurements, which can be influenced by the measured system, the measurement, and the derivation method.
While Fig. 12 shows the long-term changes in the propagation delay, there are also short-term changes caused by varying user behavior. Fig. 14 shows the 50 % transaction propagation percentile for the duration of one week in March 2018. The plot shows that the percentile oscillates between 4.8 seconds and 5.3 seconds with a frequency of 24 hours. Furthermore, Fig. 14 shows the number of observed INV announcements per hour, which also oscillates between 50 million and 100 million, and correlates to the propagation delay. The minimum number of INV announcements per hour was observed on a Sunday (March 25th).
Because no such oscillation can be seen in the number of peers, we suspect that the variation in propagation delay is actually caused by the variation in network traffic. Please note that while there is an oscillation observable, the amplitude is very small (i.e., below 200 ms for most days). Such a variation can be caused by the transaction delay mechanism in bitcoind: The maximum number of hashes announced in one single INV message is limited to 35. Therefore, if more than 35 transactions are to be announced to a remote peer, the transactions in excess of 35 are further delayed, increasing the overall propagation delay.
0 2000 4000 6000 8000 10000 12000 14000 16000 18000
29-Jul 30-Jul 31-Jul 01-Aug 02-Aug 03-Aug 04-Aug 05-Aug
Numb er of Connections Total IPv4 IPv6 Sybil
Fig. 15.Measured number of connections around August 1st, 2017 [15]. 0 1000 2000 3000 4000 5000
01-Aug:00h 01-Aug:12h 02-Aug:00h 02-Aug:12h 03-Aug:00h
Numb er of Connections Bitcoin ABC:0.14.6(EB8.0) BUCash:1.1.0(EB12; AD12) Bitcoin ABC:0.14.5(EB8.0) Bitcoin ABC:0.14.3(EB8.0) Bitcoin ABC:0.14.4(EB8.0)
Fig. 16.Announced client version strings of Sybil peers [15].
4
Case Studies
In the previous section we characterized the Bitcoin P2P network by looking at the long-term changes of network properties. In addition to the general charac-terization, we also identified several short-term events, which we will now further analyze.
4.1 Bitcoin Cash Sybil Peers
The following case study has been previously published as a technical report [15]. As described in Section 3.1, there were several short periods, during which a large number of connections from a small number of IP addresses could be observed. One such event took place on August 1st, 2017. This event is of particular inter-est, because it happened during the fork of the Bitcoin Cash (BCH) Blockchain.24
Bitcoin Cash is a modification to Bitcoin, which allows block sizes to be larger than 1 MB. Because such blocks are rejected by miners, who follow the tradi-tional consensus rules, the blockchain permanently forks into two independent branches.
Fig. 15 shows the total number of connections from our monitor peers be-tween July 29th and August 5th, 2017. As in Section 3.1, the number of Sybil peers is calculated as the difference between the total number of connections and the number of unique IP addresses we are connected to. While the number of connections is quite constant until August 1st, on August 1st, 2017, the number of Sybil peers increased to up to 5,000. After a period of about 12 hours, the number of Sybil peers decrease to almost zero. The total number of IPv4 con-nections remains slightly above its previous level (from 6,800 IPv6 concon-nections to 7,400).
Because a relation to the Bitcoin Cash fork seems likely, we analyzed the version strings announced by the Sybil peers. Fig. 16 shows the number of peers announcing version strings of Bitcoin Cash clients on August 1st. Bitcoin ABC as well as BUCash are clients for the Bitcoin Cash system. Most Sybil peers announced the version string Bitcoin ABC:0.14.6(EB8.0), however, some peers
24
0 1000 2000 3000 4000 5000
01-Aug:00h 01-Aug:12h 02-Aug:00h 02-Aug:12h 03-Aug:00h
Numb er of Connections AMAZON-02 AMAZON-AES DIGITALOCEAN-ASN HETZNER-AS OVH
Fig. 17. Connections per AS, only AS’s with most connections shown [15].
0 1000 2000 3000 4000 5000
01-Aug:00h 01-Aug:12h 02-Aug:00h 02-Aug:12h 03-Aug:00h
Observed
INV
Announcements
Fig. 18.Number of INV announcements received for BCH blocks [15].
also announced BUCash:1.1.0(EB12; AD12) and Bitcoin ABC:0.14.5(EB8.0). The number of peers announcing Bitcoin ABC:0.14.6(EB8.0) was below 100 before, and at around 400 after the Sybil period.
The fact that the Sybil peers did not all use the same client version string can be interpreted in multiple ways: First, Sybil peers could be spawned by inde-pendent parties, using different client versions. Secondly, different client versions could have been used in order to make the Sybil peers look more natural, i.e., caused by normal user behavior. Finally, different client versions could have been used to prevent a single point of failure caused by a potentially existing bug in one client implementation.
Fig. 17 shows the change in the number of peers with IP addresses from the top five autonomous systems during that period. A steep incline in the number of peers from the AS from Amazon (AMAZON-02 and AMAZON-AES) during the considered period can be seen. The total number of connections to peers in Amazon’s AS matches the total number of Sybil peers, i.e., all Sybil peers originated from Amazon’s AS. This observation suggests that all Sybil peers were spawned by one single party, although it cannot be excluded that several parties independently started a large number of Bitcoin Cash clients on Amazon’s hosting services.
Finally, the question arises what the purpose of the large number of Sybil peers was. Sybil peers can be used to attack the anonymity of users, or to perform a DoS attack (e.g., eclipsing) on the network. However, correctly operating Sybil peers can also support the network and defend the network against attacks by increasing the number of peers.
Fig. 18 shows how many INV messages announcing each Bitcoin Cash block our monitor peers received. The first BCH block was mined on August 1st and announced by 3,583 peers. The following blocks on August 1st were all announced by roughly 3,500 peers, the blocks on August 2nd were announced by roughly 800 peers. No BCH block was mined during a 13 hour period on August 2nd. The number of observed INV messages for each block corresponds well to the total number of Sybil peers. The fact that the Sybil peers actually announced BCH blocks, suggests that the peers should support the BCH network during the critical period of the fork. As the total number of reachable BCH peers is relatively low, a DoS attack on those peers could be easily executed and could have resulted in a partitioned network. The Sybil peers temporarily increased
the number of reachable BCH peers by a factor of about four. Finally, it is also possible that the Sybil peers were spawned by mistake, e.g., by misconfiguration of Amazon cloud instances.
4.2 IPv6 Teredo
As discussed in Section 3.2, the number of connections to peers using the Teredo IPv6 tunnel mechanism varied abruptly several times, with periods with more than 2,000 Teredo connections, immediately followed by periods with almost zero connections to Teredo IPv6 addresses. This raises two questions: First, what causes the abrupt changes in the number of connections to Teredo hosts? Secondly, are Teredo peers different from the peers that are connected via IPv4 or via native IPv6?
Before addressing both questions, we will now briefly introduce the Teredo tunneling protocol [10]. A host (Teredo client) that is connected via IPv4 to the internet and wishes to communicate with an IPv6 host via Teredo, contacts a
Teredo server, which provides the configuration required for the establishment of the tunnel. After the establishment of the tunnel, traffic relaying is done by
Teredo relays. Every Teredo client has a unique, routable IPv6 address, which encodes the IPv4 addresses of the Teredo client as well as the Teredo server. Furthermore, because IPv6 packets are encapsulated in IPv4 UDP packets, a traversal of NAT routers is possible.
In order to answer both questions, we analyzed a single snapshot of con-nections from one monitor peer from January 1st, 2018. At that point in time, a total of 13,885 connections were established, out of which 2,102 connections were made to Teredo IPv6 addresses. The 2,102 connections can be mapped to 2,059 unique IPv4 addresses. This means, that only a small number of peers establish multiple connections via different Teredo tunnels, i.e., we can rule out attempted Sybil attacks using Teredo tunneling as an amplifier for the number of IP addresses available as a cause for the abrupt changes in the number of Teredo connections. Furthermore, out of the 2,059 unique IPv4 addresses, only 239 peers were also connected via native IPv4.
In contrast to the previous case study, the effect does not seem to be caused by a single instance establishing a large number of connections. Furthermore, we contacted KIT’s network infrastructure administrator to rule out the possibility that changes to the local network infrastructure caused the effect. Therefore, we suspect that the effect is caused by changes to the Teredo tunneling infrastruc-ture. Interestingly, all 2,102 Teredo connections use only eight different Teredo servers, all of which are in IP ranges assigned to Microsoft.25 Microsoft an-nounced in 2013 tosunset its Teredo services and already performed experiments including temporarily shutting down Microsoft Teredo servers and relays.26This 25
List of Teredo servers and the number of connections per Teredo server: 157.56.106.184 (504), 157.56.144.215 (444), 157.56.106.189 (392), 157.56.149.60 (288), 94.245.121.251 (270), 157.56.120.207 (146), 94.245.121.253 (57), 65.55.158.118 (1).
0 0.1 0.2 0.3 0.4 US RU CA CN TH NL DE FR Sha re of P eers Teredo Native
Fig. 19. Share of peers from displayed country for the set of Teredo peers and the set of natively connected peers.
0 0.01 0.02 0.03 0.04 0.05 0.06 CHINANET-GD VIS-BLOCK RRWE
BEELINERRMAALISOFTAT-88-ZCONT ABOOVH LINODE-US Sha re of P eers Teredo Native
Fig. 20. Share of peers from displayed ASs for the set of Teredo peers and the set of natively connected peers.
suggests that the effect is caused by Microsoft performing changes to its Teredo services.
We will now analyze, whether the Teredo peers differ from the peers con-nected via IPv4 or via native IPv6. One general limitation of our monitoring method is that only connections to reachable peers can be established. However, there is also a presumably large number of peers that is unreachable, about which we cannot collect information. Because of Teredo’s NAT traversal feature, the connections established to Teredo peers are mostly connections to peers that are unreachable via IPv4. As discussed, only 12 % of Teredo peers are also reach-able via their IPv4 address. Therefore, analyzing the set of Teredo peers allows a peek into the set of unreachable peers.
Fig. 19 compares the share of peers from certain counties for the set of Teredo peers and the set of natively connected peers. For both sets of peers, the top five countries are displayed. While some countries have a similar share among both sets of peers (e.g., USA and China), some countries show a vastly different share among Teredo peers and non-Teredo peers: For instance, 14 % of all Teredo peers are from Russia, but only 3 % of all non-Teredo peers are from Russia. Even more extreme, around 5 % of Teredo peers are from Thailand, but only 0.4 % of non-Teredo peers are from Thailand. On the other hand, countries like the Netherlands, Germany, and France are underrepresented in the set of Teredo peers.
One reason for these differences might be different IPv6 adoption rates in various countries and, hence, different strategies used by ISPs to cope with the limited number of available IPv4 addresses. For instance, according to Google27,
the IPv6 adoption rate is high in the US, Germany, and France. Therefore, there is little demand for tunneling mechanisms such as Teredo. Contrary, the IPv6 adoption in Russia is very low at only about 2 %, which might explain the large number of Russian peers using Teredo. The large number of Teredo peers from Thailand, however, cannot be explained with Thailand’s IPv6 adoption rate, which is much higher than Russia’s IPv6 adoption rate (15 %). Possible
0 0.1 0.2 0.3 0.4 0.5
Satoshi:0.15.1Satoshi:0.15.0.1BitCore:0.14.1.6Satoshi:0.14.2Satoshi:0.14.1 Bitcoin ABC:0.16.1 BitcoinUnlimited:1.0.3 Sha re of P eers Teredo Native
Fig. 21.Share of peers announcing displayed version string for the set of Teredo peers and the set of natively connected peers.
reasons for the large number of Teredo peers from Thailand include specifics to the network configuration of Thai ISPs or the operating system configuration of Thai users.
Fig. 20 compares the share of peers from certain autonomous systems for the set of Teredo peers with the set of natively connected peers. Interestingly, four of the top five AS’s for non-Teredo peers (AT-88-Z, Contabo, OVH, Linode) do not have a single Teredo peers. Contrary, the most prominent AS’s for Teredo peers are all less common among non-Teredo peers. Furthermore, the share of the most common AS among Teredo peers (Chinanet-GD), is at 1.6 % much lower than the share of Alisoft peers among native peers (5.7 %), i.e., Teredo peers show a higher degree of AS level decentralization.
The top five autonomous systems among Teredo peers are all operated by ISPs providing consumer internet access (Chinanet, Verizon, Time Warner In-ternet, Beeline Boradband). Contrary, the top five autonomous systems among native peers are all operated by cloud hosting providers (Alibaba Cloud, Ama-zon, Contabo, OVH, Linode). Again, this supports the thesis that Teredo peers are run on consumer PCs behind NAT. A similar observation has been made in a previous study focusing on unreachable Bitcoin peers [17]: Here, the top 5 AS were all common mobile operators (T-Mobile, Comcast, Verizon, and Rogers).
Fig. 21 compares the announced version strings among Teredo and native peers. Only minor differences the usage of bitcoind (version stringSatoshi) can be seen. BitCore is a client for a Bitcoin fork (BTX) with modified block size, block generation interval, and mining algorithm.28 While less than one percent of all native peers run the BitCore client, more than 12 % of the Teredo peers run the BitCore client. Out of the 370 total peers running BitCore, more than 27 % are from Thailand, which might explain the large share of Teredo peers among BitCore clients.
Contrary, the share of clients for the Bitcoin Cash fork (version stringsBitcoin ABC andBitcoinUnlimited) is much lower for Teredo peers than for native peers. This is caused by the very large number of Bitcoin Cash peers operated from cloud services: More than 41 % of all reachable Bitcoin Cash peers are operated from theAlibaba Cloud. Furthermore, many of these clients seem to be operated by only a small number of parties, because peers simultaneously join and leave the network. For instance, on April 13th, 2018, the number of Bitcoin Cash peers decreased from more than 800 to 375 within three hours.
5
Discussion
The presented results indicate that the observation of large P2P networks is not only required for the creation of simulation models (cf. [14]), but also delivers in-sights into the network itself. Specifically, our measurement lead to the following statements about the Bitcoin P2P network:
– Performance and anonymity improvements to block and transaction propa-gation manifest in their observed propapropa-gation speed.
– Reachable Bitcoin peers are often run in data centers, unreachable (Teredo) Bitcoin peers tend to be connected via consumer ISPs.
– Bitcoin peers are usually (gradually) upgraded within a few months after the release of a new client version. The upgrade of Bitcoin Cash clients was observed to happen within much shorted time intervals.
– Sybil events actually happened in the past.
– Although Bitcoin is a global network, regional differences can be observed, e.g., in the IPv6 connectivity and in the used client version.
Furthermore, the comparison of our measurement results with other results indicated a reasonable agreement, however, some deviations cannot be explained completely. While the causes for some observed effects can be identified with high confidence, the causes of other effects remain unclear due to a lack of ground truth data, i.e., data collected at remote peers.
We also like to emphasize the potential of measurement errors: The Bitcoin network is a decentralized, changing network, which should be the only system affecting our measurements. However, the measurement systems itself (i.e., mon-itor hardware, monmon-itor software, local network connectivity) is also subject to change and can affect the measurements. The latency measurements presented in Section 3.3 clearly show such an effect of the measurement system, however, it is generally hard to decide whether an effect is caused by the observed network, or by the measurement system. Therefore, a larger number of monitor peers with independent hardware, software, and network connectivity could improve the reliability of the measurements.
Acknowledgments
This work was supported by the German Federal Ministry of Education and Re-search within the projectsKASTEL IoE andKASTEL ISE in the Competence