University of Wisconsin Milwaukee
UWM Digital Commons
Theses and Dissertations
December 2017
Reliability Evaluation and Defense Strategy
Development for Cyber-physical Power Systems
Yingmeng XiangUniversity of Wisconsin-Milwaukee
Follow this and additional works at:https://dc.uwm.edu/etd Part of theElectrical and Electronics Commons
This Dissertation is brought to you for free and open access by UWM Digital Commons. It has been accepted for inclusion in Theses and Dissertations by an authorized administrator of UWM Digital Commons. For more information, please [email protected].
Recommended Citation
Xiang, Yingmeng, "Reliability Evaluation and Defense Strategy Development for Cyber-physical Power Systems" (2017).Theses and Dissertations. 1725.
RELIABILITY EVALUATION AND DEFENSE STRATEGY DEVELOPMENT
FOR CYBER-PHYSICAL POWER SYSTEMS
by
Yingmeng Xiang
A Dissertation Submitted in
Partial Fulfillment of the
Requirements for the Degree of
Doctor of Philosophy
in Engineering
at
The University of Wisconsin-Milwaukee
December 2017
ABSTRACT
RELIABILITY EVALUATION AND DEFENSE STRATEGY DEVELOPMENT FOR CYBER-PHYSICAL POWER SYSTEMS
by
Yingmeng Xiang
The University of Wisconsin-Milwaukee, 2017 Under the Supervision of Professor Lingfeng Wang
With the smart grid initiatives in recent years, the electric power grid is rapidly evolving into a complicated and interconnected cyber-physical system. Unfortunately, the wide deployment of cutting-edge communication, control and computer technologies in the power system, as well as the increasing terrorism activities, make the power system at great risk of attacks from both cyber and physical domains. It is pressing and meaningful to investigate the plausible attack scenarios and develop efficient methods for defending the power system against them.
To defend the power grid, it is critical to first study how the attacks could happen and affect the power system, which are the basis for the defense strategy development. Thus, this dissertation quantifies the influence of several typical attacks on power system reliability. Specifically, three representative attack are considered, i.e., intrusion against substations, regional LR attack, and coordinated attacks. For the intrusion against substations, the occurrence frequency of the attack events is modeled based on statistical data and human dynamics; game-theoretical approaches are adopted to model induvial and consecutive attack cases; Monte Carlo simulation is deployed to obtain the desired reliability indices, which incorporates both the attacks and the random failures.
For the false data injection attack, a practical regional load redistribution (LR) attack strategy is proposed; the man-in-the-middle (MITM) intrusion process is modeled with a semi-Markov process method; the reliability indices are obtained based on the regional LR attack strategy and the MITM intrusion process using Monte Carlo simulation. For the coordinated attacks, a few typical coordination strategies are proposed considering attacking the current-carrying elements as well as attacking the measurements; a bilevel optimization method is applied to develop the optimal coordination strategy.
Further, efficient and effective defense strategies are proposed from the perspectives of power system operation strategy and identification of critical elements. Specially, a robustness-oriented power grid operation strategy is proposed considering the element random failures and the risk of man-made attacks. Using this operation strategy, the power system operation is robust, and can minimize the load loss in case of malicious man-made attacks. Also, a multiple-attack-scenario (MAS) defender-attack-defender model is proposed to identify the critical branches that should be defended when an attack is anticipated but the defender has uncertainty about the capability of the attacker. If those identified critical branches are protected, the expected load loss will be minimal.
© Copyright by Yingmeng Xiang, 2017 All Rights Reserved
To
my beloved parents, and Uncle Guo.
TABLE OF CONTENTS
ABSTRACT ... ii
LIST OF FIGURES ... x
LIST OF TABLES ... xiv
ACKNOWLEDGEMENTS ... xix
1. Introduction ... 1
Research Motivations ... 1
Dissertation Objectives ... 3
Dissertation Organization ... 4
2. Adequacy Evaluation of Power Grids Considering Substation Cyber Vulnerabilities... 5
Introduction ... 5
Human Dynamics Analysis for Cyber Attacks ... 6
Cyber Vulnerabilities of Substations ... 12
A Game-Theoretic Approach ... 17
The Markov Game ... 18
The Static Game ... 21
Power System Adequacy Evaluation ... 22
Case Studies ... 27
Influence of the Judgment of the Attack Type ... 29
Influence of the Human Dynamics ... 30
Influence of the Cybersecurity Parameters ... 31
Influence of the Repair Time ... 33
3. Power System Reliability Evaluation Considering Load Redistribution Attacks ... 35
Introduction ... 35
Intrusion Process Modeling for MITM Attack Against State Estimation ... 35
Attacks against Power System State Estimation ... 36
Attack against Non-encrypted SCADA Network ... 37
Attack against Encrypted SCADA Network ... 40
Calculation of MTTA ... 43
Regional Load Redistribution Attack Model ... 46
Power System Reliability Modeling ... 48
Case Studies and Simulation Results ... 51
MTTA of the Attack ... 51
Regional Load Redistribution Attack ... 53
Reliability Modeling of Power System ... 55
Conclusions ... 57
4. Coordinated Attacks on Electric Power Systems in a Cyber-Physical Environment ... 58
Introduction ... 58
Power System Vulnerabilities and Coordinated Attacks ... 59
Analysis of Attacks against Power Systems ... 59
Power System Operation and Coordinated Attacks ... 61
Principle of Coordinated Attacks ... 66
LR Attack Coordinating with Attacking Generators ... 68
LR Attack Coordinating with Attacking Lines ... 71
LR Attack Coordinating with Attacking Generators ... 74
LR Attack Coordinating with Attacking Lines ... 78
Conclusions ... 81
5. A Robustness-Oriented Power Grid Operation Strategy Considering Attacks ... 82
Introduction ... 82
Attacks and Resultant Impacts ... 84
Attack Cases ... 84
Impact Analysis of Attacks ... 85
Problem Formulation ... 87
General SCOPF Formulation ... 87
Extended SCOPF Formulation Considering Attacks ... 89
Short-Term Post-Contingency Feasibility Check... 90
Long-Term Post-Contingency Feasibility Check ... 91
Post-Attack Impact Analysis ... 91
Parallel Hybrid Solution Methodology ... 92
Computation Strategy ... 93
Computational Procedure ... 94
Case Studies ... 97
IEEE 14-bus System ... 98
IEEE 39-bus System ... 104
IEEE 118-bus System ... 108
6. An Improved Defender-Attacker-Defender Model for Transmission Lines Defense
Considering Offensive Resource Uncertainties ... 112
Introduction ... 112
Problem Formulation ... 114
Conventional DAD Model ... 115
Modeling of Uncertainties ... 118
Proposed DAD Model Considering Uncertainties ... 119
Solution Method ... 122
Upper-Level Problem ... 123
Lower-Level Problem ... 125
Overall C&CG Algorithm ... 126
Case Studies ... 128
IEEE RTS79 system ... 128
IEEE 57-bus system ... 136
Conclusions ... 136
7. Conclusions and Future Work ... 138
Conclusions ... 138
Future Work ... 140
LIST OF FIGURES
Figure 2. 1 Comparison between Poisson and power law distributions ... 7
Figure 2. 2 The occurrence pattern of the cyber attacks ... 8
Figure 2. 3 The relationship between probability and cyber attack intervals ... 9
Figure 2. 4 Simple illustration of the cyber attacker society ... 9
Figure 2. 5 The influence of social conformity psychology ... 11
Figure 2. 6 Power system cyber architecture ... 12
Figure 2. 7 An illustrative attack path ... 12
Figure 2. 8 Example of individual attacks ... 16
Figure 2. 9 Example of consecutive attacks ... 16
Figure 2. 10 Sampling of the attack occurrence and the component statuses... 23
Figure 2. 11 Evaluation of system state ... 24
Figure 2. 12 A holistic adequacy assessment framework considering cyber attacks against substations ... 25
Figure 2. 13 Optimal mixed strategies for the players when all substations are up ... 29
Figure 2. 14 Comparison of attack type judgment ... 30
Figure 2. 15 Influence of social conformity psychology on system adequacy ... 31
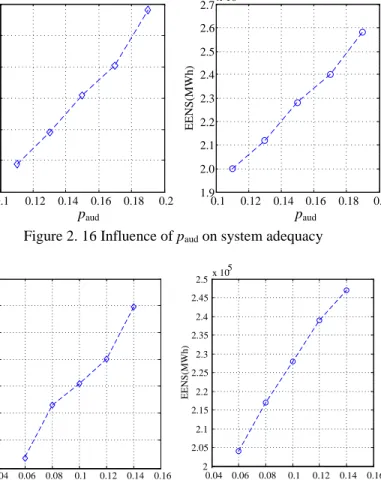
Figure 2. 16 Influence of paud on system adequacy ... 32
Figure 2. 17 Influence of pad on system adequacy ... 32
Figure 2. 18 Influence of individual substation cybersecurity on system adequacy ... 33
Figure 2. 19 Influence of MTTRA on system adequacy ... 33
Figure 3. 1 Attack tree for the state estimation ... 37
Figure 3. 3 Semi-Markov model for attack against non-encrypted SCADA ... 39
Figure 3. 4 Semi-Markov model for attack against encrypted SCADA ... 42
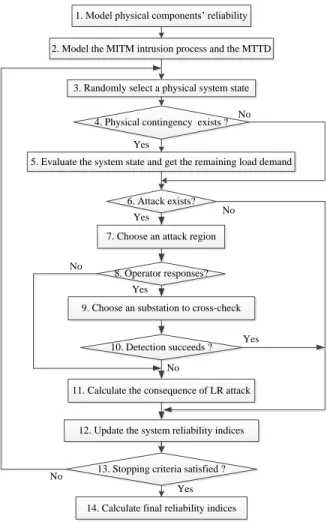
Figure 3. 5 Flowchart for power grid reliability assessment considering LR attacks... 49
Figure 3. 6 The influence of attack time in the attack phases ... 52
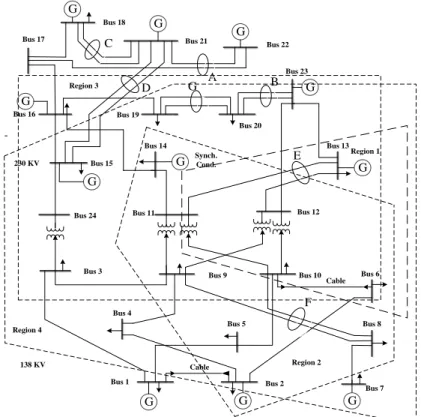
Figure 3. 7 Regional load redistribution attack schemes with IEEE RTS79 system ... 53
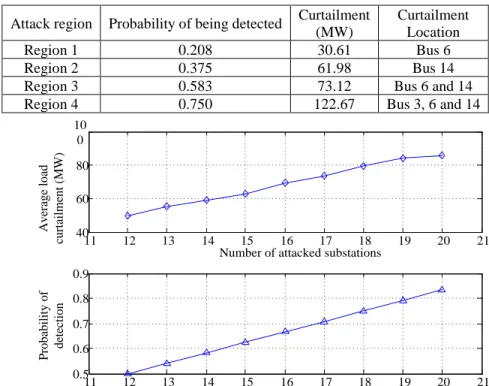
Figure 3. 8 Regional attack results ... 54
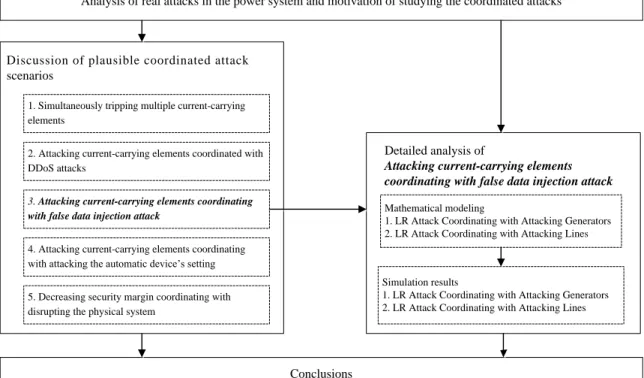
Figure 4. 1 Schematic overview of the chapter... 59
Figure 4. 2 Attacks against electric power systems ... 60
Figure 4. 3 Power system operation and attacks ... 62
Figure 4. 4 Coordinated physical attacks against lines ... 63
Figure 4. 5 Coordinated cyberattacks against substations ... 63
Figure 4. 6 Physically tripping a line coordinating with DDoS attack ... 63
Figure 4. 7 Cyberattack against a generator coordinating with false data injection attack .. 64
Figure 4. 8 Faulting a line coordinating with changing the relay’s setting ... 64
Figure 4. 9 False data injection attack coordinating with tripping a line ... 65
Figure 4. 10 Bilevel modeling for the LR attack ... 67
Figure 4. 11 A bilevel model for the coordination of LR attack and other attacks ... 68
Figure 4. 12 Illustration of the LR attack coordinating with attacking generators ... 71
Figure 4. 13 Illustration of the LR attack coordinating with attacking lines ... 73
Figure 4. 14 Example of LR attack coordinating with tripping generators ... 75
Figure 4. 15 Sensitivity analysis for the cyberattack resource ... 76
Figure 4. 17 Example of LR attack coordinating with tripping a line with cyberattack resource
of 25 ... 79
Figure 4. 18 Example of LR attack coordinating with tripping a line with cyberattack resource of 45 ... 80
Figure 5. 1 Resiliency construct of power systems... 83
Figure 5. 2 Risk of attack against power system ... 86
Figure 5. 3 Cascading failure simulation flowchart ... 87
Figure 5. 4 Conventional SCOPF framework ... 87
Figure 5. 5 An extended SCOPF framework considering probable attack scenarios ... 89
Figure 5. 6 Procedure of the hybrid solution methodology ... 96
Figure 5. 7 Convergence of PSO for BAC-OPF in IEEE 14-bus system ... 100
Figure 5. 8 Load loss ratio in IEEE 14-bus system based on the N-1 SCOPF when two buses are attacked ... 102
Figure 5. 9 Load loss ratio in IEEE 14-bus system based on the proposed SCOPF when two buses are attacked ... 103
Figure 5. 10 Load loss ratio in IEEE 14-bus system based on the proposed SCOPF incorporating two attack cases when a bus is tripped ... 104
Figure 5. 11 Comparison of the impact of bus-isolating attack in IEEE 39-bus system .... 105
Figure 5. 12 Load loss ratio in IEEE 39-bus system based on N-1 SCOPF ... 107
Figure 5. 13 Load loss ratio in IEEE 39-bus system based on the proposed SCOPF considering attacks against one bus and one line simultaneously ... 108
Figure 5. 14 Comparison of the impact of bus-isolating attack in IEEE 118-bus system .. 109
Figure 6. 2 Proposed Multiple-Attack-Scenario defender-attacker-defender model ... 118 Figure 6. 3 Overview of the C&CG algorithm ... 127 Figure 6. 4 Illustration of the attack and defense strategies for case 2 ... 132 Figure 6. 5 Consequences for the sensitivity study of the attack scenario probabilities .... 133 Figure 6. 6 Consequences for the impact of the defensive resource ... 135
LIST OF TABLES
Table 2. 1 Load curtailment caused by substation failure ... 27
Table 2. 2 Payoffs of static game when all substations are up ... 27
Table 2. 3 Payoffs of Markov game when all substations are up ... 28
Table 2. 4 System adequacy comparison with and without cyber attacks ... 29
Table 3. 1 Example time intervals for non-encrypted SCADA ... 52
Table 3. 2 Example time intervals for encrypted SCADA ... 52
Table 3. 3 Examples of regional LR attacks ... 54
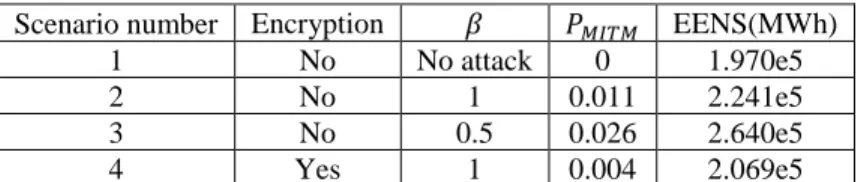
Table 3. 4 Reliability evaluation with complete LR attack ... 55
Table 3. 5 Reliability evaluation with regional LR attack ... 56
Table 4. 1 Parameters of Generations ... 74
Table 4. 2 Comparisons of different attack strategies ... 75
Table 4. 3 Influence of the security factor ... 77
Table 4. 4 Load curtailment comparison for different attack strategies ... 79
Table 4. 5 Comparison with different attack strategies ... 80
Table 5. 1 Illustration of the solution method ... 93
Table 5. 2 Active power outputs based on N-1 SCOPF in IEEE 14-bus system ... 99
Table 5. 3 Loss for bus-isolating attack in 14-bus system under N-1 SCOPF ... 99
Table 5. 4 Loss for line-tripping attack in 14-bus system under N-1 SCOPF ... 99
Table 5. 5 Active power outputs based on BAC-OPF in IEEE 14-bus system ... 100
Table 5. 6 Loss for bus-tripping attack in IEEE 14-bus system under BAC-OPF ... 100
Table 5. 7 Active power outputs based on BAC-OPF without considering short-term feasibility in IEEE 14-bus system ... 101
Table 5. 8 Active power outputs based on LAC-OPF in IEEE 14-bus system ... 101
Table 5. 9 Loss for line-tripping attack in IEEE 14-bus system under LAC-OPF ... 101
Table 5. 10 Active power outputs in IEEE 14-bus system based on the proposed SCOPF considering attacks against two buses... 102
Table 5. 11 Active power outputs in IEEE 14-bus system based on proposed SCOPF considering two possible attack conditions ... 103
Table 5. 12 Load loss ratio in IEEE 14-bus system based on the proposed SCOPF incorporating two attack conditions when two lines are tripped ... 103
Table 5. 13 Active power generation comparison for IEEE 39-bus system (MW) ... 105
Table 5. 14 Loss in line-tripping attack based on N-1 SCOPF in IEEE 39-bus ... 106
Table 5. 15 Loss in line-tripping attack based on LAC-OPF in IEEE 39-bus ... 106
Table 5. 16 Active power outputs in IEEE 39-bus system considering attacks against one bus and one line simultaneously ... 108
Table 5. 17 Active power generation in IEEE 118-bus system ... 109
Table 5. 18 Loss in line-tripping attack based on N-1 SCOPF ... 110
Table 5. 19 Loss in line-tripping attack based on LAC-OPF in 118-bus system ... 110
Table 6. 1 Simulation results for case 1 ... 129
Table 6. 2 Comparative studies for case 1 ... 130
Table 6. 3 Simulation results for case 2 ... 131
Table 6. 4 Comparative studies for case 2 ... 132
Table 6. 5 Defensive and offensive strategies for the sensitivity study of the attack scenario probabilities... 134
LIST OF ABBREVIATIONS
3-DES Triple data encryption standard
BAC-OPF Bus attack constrained optimal power flow
C&CG Column-and-constraint generation
DAD Defender-attacker-defender
DDoS Distributed denial of service
DNP Distributed network protocol
DoS Denial of service
EENS Expected energy not supplied
EMS Energy management system
FACTS Flexible alternating current transmission system
GSM Global system for Mobile communications
HMI Human machine interface
IDS Intrusion detection system
IED Intelligent electronic devices
KKT Karush–Kuhn–Tucker
LAC-OPF Line attack constrained optimal power flow
LLP Lower-level problem
LOLP Loss of load probability
LR Load redistribution
MAS Multiple attack scenario
MCS Monte Carlo simulation
MTTA Mean time to attack
MTTF Mean time to failure
OPF Optimal power flow
PSO Particle swarm optimization
PDIP Primal-dual interior point
RTS Reliability test system
SCADA Supervisory control and data acquisition
SCOPF Security constrained optimal power flow
SHA Secure hash algorithm
SMP Semi-Markov process
SSL Secure sockets layer
SSSA Steady-state security assessment
ULP Upper-level problem
VPN Virtual private network
ACKNOWLEDGEMENTS
I would like to sincerely thank my advisor, Prof. Lingfeng Wang, for his insightful guidance, immense knowledge, valuable comments, various opportunities, great patience and continuous support during my PhD journey. His consistent enthusiasm on research always motivates me to aim higher and dig deeper.
I want to express my great gratitude to other committee members, Dr. Yi Hu, Dr. Chiu Law, Dr. Chao Zhu, and Dr. Xiao Qin for their support and advice. I greatly appreciate their time, effort and insightful comments.
I am very thankful to Yichi Zhang, Jun Tan, Zhu Wang, Rui Yang, and Prof. David Yu for all the discussions, guidance, help and encouragement, both academically and personally. Your help is of great value to me.
My great thanks are extended to my fellow colleagues Yunfan Zhang, Ming Wang, Ruosong Xiao, Zhilu Ding and Dandan Wang. Doing research with you is enjoyable and beneficial.
My sincere thanks also go to my good friends, including but not limited to, Hongjun Gao, Hongda Liu, Qingxue Lai, Bing Jin, Jizhou Tong, Zhongyue Sun, Qiang Fu, Meiling He, and Jiayan Nie. Without your help, encouragement and friendship, my life in Ohio and Wisconsin would not have been so colorful and fruitful.
This graduate research was in part supported by the National Science Foundation (NSF) under Award ECCS1128594. I am greatly grateful for the financial support.
Last, I own my deepest gratitude to my beloved parents and Uncle Guo for their immense love and invaluable support.
1.
Introduction
Research Motivations
Due to the smart grid initiative, numerous emerging cyber and computer technologies are being applied in the modern power grid, such as wide area monitoring and control technologies [1], IEC 61850 based substations [2], flexible alternating current transmission system devices [3]-[4], distributed energy storage [5], and microgrid [6], etc. These changes can allow the cyber attackers to get access to the hierarchical control systems and exploit the vulnerabilities to gain the control privilege. Typical cyberattacks include denial of service (DoS) attacks, database modification, replay attack, and false data injection attack. In the physical domain, the power system is also vulnerable to both vandalism and terrorism activities. The power system spreads over a wide area, and numerous transmission lines travel hundreds of miles from power generation to utilization sites. And these lines could easily be the targets of attackers. The substations are distributed over vast land, and most of them are unmanned, and physically poorly protected. They can easily be broken into and be damaged.
Actually both the cyberattacks and physical attacks against the power grid are not pure speculations, but are serious realities. For example, in January 2015, a militant attack plunged more than 140 million people into darkness after a key power transmission line was disrupted [7]. In January 2003, the Davis–Besse nuclear power station was infected by slammer worms, which resulted in the nuclear power plant being out of monitoring for five hours [8]. Also, in April 2016 the Gundremmingen nuclear power plant in German was reported to be infected by computer viruses [9]. These incidents could evolve into serious nuclear disasters if not well managed.
Moreover, it was identified by the security agency that a cyberattack caused a power blackout outside the U.S. [10]. On December 23 in 2015, a Ukrainian electricity distribution company was hacked, seven substations were isolated for three hours, and the operators were forced to switch to the manual mode. This cyberattack induced incident caused severe power outages to approximately 225,000 customers for hours [11]. Up to 73 MWh of electricity demand was curtailed. Also, it was reported that Israeli electric power system suffered severe cyber attacks [12].
Due to security and privacy reasons, insufficient details regarding these attacks were disclosed to the public. But it is possible that many such cyber related incidents were not revealed to the public, and such attacks could occur more frequently in the future with the smart grid initiative. It was reported that the power grid is actually under cyberattack minute-by-minute [13]. Furthermore, great power failures could be triggered if the attacker launches coordinated attacks to compromise multiple parts or functions of the power grid in cyber and physical aspects. And in a report by North American Electric Reliability Corporation, the coordinated attack was identified as one of the three representative high impact low frequency threats [14].
There have been some research papers studying power system vulnerabilities and attacks [15]-[16]. The targets and attacking methods could differ greatly. For example, the false data injection attack on the power gird generation control was modeled in [17], and a mitigation strategy was developed. A strategy to develop false data injection attacks without sufficient system knowledge was proposed in [18]. In [19] a cyber-physical security assessment technique considering both failures and malicious attacks was proposed. In [20] the vulnerabilities in the substations and the related attacks were studied. In [21] the authors studied how to coordinately switch multiple breakers to destabilize the power grid and cause large-scale cascading failures. In
[22] the authors investigated the cascading failure initiated by sequentially disconnecting multiple substations, and an attack strategy based on the sequential attack graph was proposed. In [23] the joint substation-transmission line vulnerability was studied, and a component interdependency graph based attack strategy was proposed.
However, the influence of the attacks on cyber-physical power grid reliability and the efficient defense strategies are lacking and need to be further explored.
Dissertation Objectives
This dissertation aims to study the impact of attacks on power system reliability, including intruding the substations, false data injection attacks as well as coordinated attacks. Based on the modeling of the attacks, different defense strategies are proposed for securing the power grid when an attack is anticipated. Specifically, a novel power grid operation strategy is proposed, which can improve the power grid robustness in case of malicious attacks. Also, a novel trilevel model is proposed considering uncertainties regarding the attacker’s capability, the most critical branches that should be defended with priority is identified.
The major contributions of this dissertation are listed as follows.
• Proposed a holistic power grid reliability evaluation framework considering human dynamics based event frequency analysis and game-theoretic modeling for different attack cases;
• Developed a reliability evaluation method incorporating the false data injection attacks against state estimation.
• Studied several coordinated attack scenarios, and the optimal coordination strategy is studied with bilevel optimization.
• Derived a novel power system operation strategy for improving the power system’s robustness against man-made attacks.
• Developed a MAS defender-attacker-defender modeling for identifying the critical branches with uncertainties of the attacker’s capability.
Dissertation Organization
The rest of this dissertation is organized as follows. Chapter 2 studies the occurrence frequency of cyber attacks against power system substations, and investigates the impacts of different attacks scenarios on power system reliability. Chapter 3 studies the influence of false data injections on power system reliability. Chapter 4 studies how different attacks can be coordinated to maximize the damage. Chapter 5 proposes a robust power grid operation strategy for defending against malicious attacks. Chapter 6 proposes a MAS defender-attacker-defender model considering uncertainties to identify the most critical lines. Chapter 7 summarizes the dissertation and discusses the future research work.
2.
Adequacy Evaluation of Power Grids Considering
Substation Cyber Vulnerabilities
Introduction
Power system adequacy evaluation aims to assess the power system’s capability of supplying electric power to the customers without interruption while fulfilling the operational constraints. Currently in the field of power system adequacy assessment, the main focus is placed on investigating the influences of intermittent renewable energy resources [24] and the communication infrastructure failures [25]-[29]. In [25]-[27], the influence of the failure of phasor measurement units and their optimal placement on power system adequacy were studied. In [28]-[29], the reliability of wide-area measurement system was investigated and approaches to improve the reliability were explored. However, the accurate evaluation of power system adequacy requires taking into consideration all possible outages and uncertainties [30]. With the wider deployment of information technologies, it is possible that cyber attacks will happen more frequently in the future. Thus, it is highly necessary to incorporate the cyber attacks induced risk into power system adequacy evaluation.
This chapter aims to investigate the power system adequacy incorporating substation cybersecurity. This research focus is associated with quantifying the impact of malicious cyber attacks on the overall power supply adequacy, while most of the aforementioned reliability assessment studies were focused on adequacy evaluation due to hardware failures. The adequacy analysis incorporating cyber attacks is very different from that based on random hardware failures, which is thus a particularly challenging task as explained in the following.
contingencies caused by hardware failures are considered as physical contingencies, and similarly the contingencies caused by malicious cyber attacks can be considered as cyber attack contingencies. The frequency of physical contingencies is mainly determined by the hardware’s physical characteristics and the influence of the environment. But the frequency of cyber attack contingencies is mainly determined by the behaviors of malicious attackers, which involves a number of uncertainties. While sophisticated methods such as those based on Poisson distribution and state transition have been developed to study the frequency of physical contingencies, very little work has been conducted to statistically study the occurrence frequency of cyber attacks over a long time span [31]. This is primarily due to the unavailability of historical data coupled with privacy concerns. In this chapter, human dynamics analysis is adopted to study the occurrence frequency of cyber attack contingencies.
Second, it is essential to study the consequence of each contingency. The influence of the physical contingencies is determined by the function and location of the hardware and the control strategy of the power system operator; simply speaking, it is unilaterally determined by the defender. However, the influence of the cyber attack contingencies is determined by the attacker/defender interaction. It is an interactive process and more uncertainties are involved, such as the strategies, rationality and available budget resources of the agents, i.e., the attacker and the defender. In this study, game theory is applied to model the attacker/defender’s interactive behaviors, and then to investigate the influence of each cyber attack contingency.
Human Dynamics Analysis for Cyber Attacks
In order to analyze the influence of a contributing factor of power outages on the long-term statistic power system adequacy, it is essential to study its occurrence pattern. Conventionally, the
Poisson distribution is adopted to model the failure of hardware components supported with the historical data. While it seems acceptable to assume that the cyber attack activities against power system could be simulated by Poisson distribution, many individual human activity temporal patterns were found to follow non-Poisson distributions, such as sending text messages, browsing webpages, and rating movies online [32], [33]. Similar temporal characteristics have also been captured in many collective social behaviors, e.g., wars and terrorism attack events [34], [35]. It is discovered that in these human activities the interevent intervals between two consecutive events are obviously not uniformly distributed. The time intervals are usually short, but there are also some non-negligible long intervals. By statistically analyzing the intervals τ, it is found that the probability 𝑃(𝜏) abides by the power law distribution:
( )
P
(2.1) where α means the exponent, and it indicates the burstiness of the events. A larger value of the exponent indicates the burstiness of the event is more distributed.a. Time sequence of Poisson distribution process
b. Time sequence of power law distribution process
Figure 2. 1 Comparison between Poisson and power law distributions
A comparison between Poisson distribution and power law distribution is illustrated in Fig. 2.1. Each vertical line in the figures represents a single event, and the mean values of the interval time are set to be the same. The sudden burst of a huge number of events in a short time period as well as inactivity within a long time period under power law distribution are more obvious than those in the Poisson distribution.
the cyber attack occurrence pattern. However, until now very limited historical data about the cyber attacks targeting power grids are available to the public as the electric companies and utilities are concerned that the cyber attackers may take advantage of the data to increase their probability of launching successful cyber attacks. Also they have concerns on the loss of customers’ confidence on their ability to provide high quality of service if these cyber incidents were released to the public. In this study, some real data [36] associated with the cybersecurity accidents are analyzed. These data record the detailed information on significant cyber attacks that occurred worldwide on a daily basis. The targets of attacks include electric power systems, governmental agencies, military units, finance sectors, transportation infrastructure, etc.
Since the exact occurrence moments of the attacks are missing, it is assumed that the attacks are randomly distributed over a day period if there are multiple attacks in a day. The occurrence pattern from April to September in 2012 is shown in Fig. 2.2 where each vertical line represents a single attack. It shows that the interval time between two successive attacks varies much. Sometimes multiple attacks may occur in a very short time period while there could be a long waiting period between two attacks.
4/1/2012 9/30/2012
Figure 2. 2 The occurrence pattern of the cyber attacks
The probability and the interval time between attacks are shown in Fig. 2.3 based on the real-world data for cyber attacks from April 2012 to June 2014. It can be observed from Fig. 2.3 that the probability distribution of interval time between cyber attacks in real scenarios abides by the power law distribution. And the exponent can be obtained as 𝛼=1.68 using the curve-fitting technique with regression analysis.
100 101 102 10-4 10-3 10-2 10-1 100 Interval time(h) P ro b a b il it y slope= -1.68
Figure 2. 3 The relationship between probability and cyber attack intervals
It is essential to investigate the social and psychological factors which drive the human behaviors. In order to interpret the statistical pattern of cyber attacks and to develop a mechanism for analyzing the cyber attack occurrence property, a human dynamics model can be built for cyber attacks, similar to those developed for mail communications based on queuing process in [37] and web access patterns using memory model in [38]. In [39], an opinion model considering memory effect was built to explain the pattern of terrorist attacks in Iraq and Afghanistan. Considering cyber attacks and terrorist attacks are both malicious attack activities to harm specific targets and cyber attacks initiated by the terrorists can also be seen as terrorist attacks, this study deploys the opinion model considering memory effect [34], [39] to model the pattern of cyber attacks against power system substations.
Attacker Social connection
Figure 2. 4 Simple illustration of the cyber attacker society
As it is not possible to quantitatively model the complex human social network considering every detail, in this chapter a simplified graphical model is adopted to model cyber attacker society
as shown in Fig. 2.4. The nodes represent attackers and the links represent social connections among them. Specifically, the attacker society is represented by an L×L two-dimensional lattice network, and every node at the conjunction represents an attacker. For the social connection, it is assumed that every node has certain social connections with its four neighboring nodes.
Just like different people have different opinions in a modern society, each individual in the cyber attacker society has an opinion about whether it is the right time to launch a cyber attack. At each moment, the individual opinion is represented by a parameter 𝜎; and 𝜎 = 1 represents the supporting attitude while 𝜎 = −1 represents the opposing attitude. The opinions can change with time, which is influenced by two major factors, namely environmental effect and memory effect, due to the fact people’s opinions or ideas are usually influenced by his/her own memory as well as others’ opinions or ideas. The environmental effect is determined by the neighboring individuals, and at time t the environmental effect on the individual i is calculated by [34][39]
4 1 , , 1 , 1 1 ( i t) i t j t ( 1, 2, 3, 4) j U j
(2.2) Also, the memory effect is described by [34][39], 1 , 2 2 , , 1 , 2 0.1 0 ( ) 1 0 i t i t i t i t i t U (2.3) The viewpoints of individuals can be updated as time goes on due to the influence of the environmental effect and the memory effect. The probability of changing ones’ opinion is mathematically described as follows:
1 1 2 2 1 , 2 2 1 1 exp( exp( 0 ( ) exp( 0 [ ) )] ) i t bU b U U P M b U U (2.4)
psychology, and M indicates the social chaotic degree.
Following the rules shown in (2.2)-(2.4), the cyber attacker society undergoes a self-organizing evolution. The collective opinion of the society is quantified by
2 , , 2 1 ( ) 1 , i t { 1,1} L i t i m t L
(2.5) Analogous to the collective decision-making mechanism in the modern society, here it is assumed if m is higher than a critical set point mc, the individuals in the cyber attacker society willreach a consensus to launch a cyber attack.
100 101 102 103 10-6 10-5 10-4 10-3 10-2 10-1 100 Interval time (h) P ro b ab il it y b1=0.7 b1=1 b1=2 slope= -1.68 slope= -2.55 slope= -2.26
Figure 2. 5 The influence of social conformity psychology
Simulations are conducted to find the associated parameters for the real cyber attack data mentioned before. Since the social conformity psychology factor b1 is a main factor influencing
the power law exponent [39], specify L=10, M=2, b2=0.7, mc=0.7. And it is found when b1 is 0.7,
by applying curve-fitting the power law exponent it is obtained as 1.68, which matches the real data as shown in Fig. 2.5. It can be concluded that the increase of social conformity psychology factor b1 leads to the increase of the power exponent α, which indicates that the cyber attacks occur
more frequently.
dynamics model, such as people, individual memory, social communication, and collective decision-making, etc. Although this model simplifies the cyber attacker society to some degree, it offers a quantitative way to statistically analyze the cyber attack occurrence pattern.
Cyber Vulnerabilities of Substations
Wide Area Network ... Human interface Human interface Router Firewall ... IEDs IEDs Firewall Router Control Center Substation 1 Substation 2 Attacker
Figure 2. 6 Power system cyber architecture
A typical cyber architecture of a power system consists of control centers, SCADA network and substations, etc., as shown in Fig. 6. The substations and power plants are geographically distributed in a wide area, and they are connected with the control center. The power system dispatchers and operators working in control center monitors the operation statuses of field devices and control their operations.
Breaker Breaker Controller Substation gateway Human machine interface Attacker
Figure 2. 7 An illustrative attack path
As substations are critical conjunction and control nodes in the power system network, they are usually well safeguarded from the malicious intrusions, and various countermeasures can be taken to further improve their cybersecurity level [40]. For example, firewalls and intrusion detection system (IDS) can be installed on the substation computers and the external gateways to
detect the abnormal communication packets. Antivirus software can be installed to prevent the malware infection and propagation. Also, the vulnerabilities and holes in the operation systems, software, and system configurations are scanned and fixed. Password authentication, communication encryption and virtual private networks (VPNs) can be used to prevent unauthorized access and information leakage. As human is a critical part in the closed-loop system for enhancing the cybersecurity, employees should be trained to become more aware of the cybersecurity issues and strictly follow the stipulated cybersecurity regulations and policies. However, despite all these efforts cyber vulnerability induced risks remain in power system cyber networks. By exploiting the vulnerabilities in the operating system, passwords or protocols, a cyber attacker may successfully intrude into the substations and a possible attack path for controlling a breaker is presented in Fig. 2.7 [40], [41], and various detrimental activities could be performed such as tripping lines and shedding loads.
IDSs play a critical role in detecting and thwarting cyber intrusions. Generally, the performance gain of the IDS comes with the compromise of efficiency and it is difficult to achieve the high efficiency and high performance simultaneously. For example, an IDS could be capable of detecting malicious attacks or intrusion embedded in packet. However, continuously monitoring, recording and analyzing the packets consumes tremendous amounts of computational and storage resources, but the substation computers usually have limited memories and computing capabilities [42]. It is even more challenging to perform real-time monitoring and detection if the traffic load is heavy. And this is especially true when some faults or successful attacks occur, and in these cases the communication traffic between the substation and control center will increase tremendously, and the intensive monitoring of the traffic may cause the delay of transmitting critical operation commands and even incur serious consequence. And apparently, the operation
of firewalls has the similar dilemma. So oftentimes an IDS features different operation modes: the lightweight mode and comprehensive mode. In the lightweight mode, only part of the packets is recorded and analyzed. In the comprehensive mode, all the packets in the traffic flow are analyzed. While the comprehensive mode features a higher probability of detecting the attack which is useful when an attack is ongoing, it may slow down the normal traffic for legitimate use and cause false positive alarms. So the IDSs usually work in the lightweight mode.
If a substation is under threat, in order to reinforce it the security operator could run the IDS of this substation in the comprehensive mode, while also enabling the IDSs in the SCADA network to focus on analyzing the traffic transmitted to/from the reinforced substation. Besides the IDSs, the security operator may remotely monitor and analyze the substation traffic, and even send staff to locally safeguard the substation if needed. All these actions could be taken so as to temporarily boost the cybersecurity level of the reinforced substation. Without loss of generality, denote the
paud as the failure probability of a substation in the face of a cyber attack when the substation is
not reinforced; similarly, denote pad as the failure probability of a substation in the event of attack
when the substation is reinforced. It holds true that 0< pad < paud <1 [42]. The specific values of paud and pad should be determined based on the evaluation of the experts or obtained from statistical
cyber attack data.
Further, the consequence of a successful cyber attack will be quantified. The circuit breakers located in the substations can connect or disconnect a branch, a generator, and a load demand, etc. Undesired tripping or closing can directly impact the power flow, and may compromise the power supply reliability. The consequence will be disastrous if the attacker can take over the substation’s human machine interface (HMI) and send false commands to trip all the breakers in the substation. In this case, all the lines, generators, and loads associated with the substation will be disconnected.
When a substation is down, the repair process will begin to recover the substation. And after a certain amount of repair time, the substation will recover. This repair process has an influence on the specific attack consequence, which is explained as follows.
The tripping of the substation circuit breakers can cause serious problems such as load loss, instability, or even complete system collapse. The specific consequence mainly depends on the system state at the time of the attack and the response of the system operator. Roughly, if the system is adequate in transmission and generation resources and the system operator responds in a timely manner and effective measures are taken, it is easy to prevent the system collapse. If the system is working in a marginal state and the system operator fails to take effective measures timely, the system would collapse.
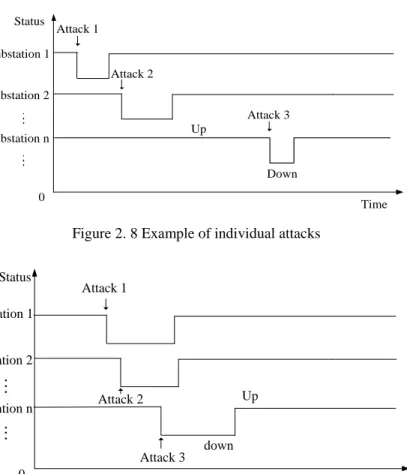
From Fig. 2.1(b) and Fig. 2.2, it can be seen that in some cases certain attacks are individual ones as the intervals between them are quite long. A typical example of individual attacks is shown in Fig. 2.8. The interevent times between the attacks are more than the repair time. Prior to the next attack, the failed substations have recovered. At the moment of each attack, the system is operating with all the substations up. Also, it can be seen from Fig. 2.1(b) and Fig. 2.2 that in some other cases, multiple attacks burst in a short time and the interval times between them are quite short. These attacks are deemed consecutive attacks. A typical example of consecutive attacks is shown in Fig. 2.9. It can be found that the first attack occurs when no substation is down; and the second attack occurs when one substation is down before the down substation is restored; and at the moment of the third attack, two substations are down.
If the substation is disconnected and not recovered in time before the next attack occurs, the system will become increasingly vulnerable due to the loss of transmission and generation capacities, also the system operator will be under increasingly pressure and it is difficult for the
operator to prevent system collapse at the moment of next attack. In summary, the consecutive attacks make the power system increasingly vulnerable to collapse. If this consecutive attack process goes on, the system will collapse at a certain time. The system collapse has been modeled by different methods in different studies, such as the convergence of the power flow analysis, the number of buses disconnected [43]. In this study, based on [43] assume that the power grid operator cannot prevent the system from collapsing if 10% of the substations are down.
Substation 1 Substation 2 Substation n Attack 1 Up Down Attack 2 Time Status 0 Attack 3
Figure 2. 8 Example of individual attacks
Substation 1 Substation 2 Substation n Attack 1 Time Status 0 Attack 3 Up down Attack 2
Figure 2. 9 Example of consecutive attacks
If the system does not collapse after one or more substations are brought down, the power system operator will take remedial measures to minimize the load curtailment in the remaining system. The minimum load curtailment lm in the remaining network can be calculated by
,
min
m c i l
P
(2.6) subject to: min max g g g P P P (2.7) , ,0
P
c i
P
d i(
i
N
B)
(2.8) , , , G B B g i c i d i i N i N i N P P P
(2.9) ( g c d) F H P P P (2.10) max F F (2.11) where Pg is generation vector; Pc is the load vector; Pdis the load demand vector; NB is the set ofbuses that have load demand; NG is the set of buses that have generation; H is the connection matrix
describing the relationship between branch power flow F and load/generation in the remaining network; Fmax is the line transmission capacity vector.
If substation i is attacked successfully, the total load curtailment ls(i) is derived by
( )
( )
( )
s d m
l i
l i
l i
(2.12) where ld(i) is the load demand located in that attacked substation.Similarly, the load curtailment can be calculated when more substations are down. Also, if the system collapses, the worst-case scenario will be considered where all loads will be curtailed.
A Game-Theoretic Approach
If the attack is launched in a time step, assume that with limited resources the attacker can only attack one substation because the contemporary power system is a critical infrastructure with enforced protection. Indeed it requires some level of intelligence and sophistication as well as
adequate attack resources to attack the power network. On the defender’s side, similarly assume that at each time step, the security operator can only choose a substation to reinforce as described in Chapter 2.3. Since each player needs to take into consideration the others’ actions to maximize its payoff, the interactive optimal decision-making process is modeled based on game-theoretic approaches.
It should be noted that the attacker and defender interactions over a long period of time can be extremely complicated, so it is not realistic to model all these scenarios. In this study, two typical scenarios are modeled considering the cyber attack patterns. As shown in Fig. 2.9, the attack and protection interaction in this consecutive attack scenario could be a Markov process as the failed substation could not recover in time before the next attacks, and the next interactions could continue to cause the failure of other more substations. Since system collapse can bring great reward to the attacker, it is wise for the attacker to take into consideration the payoff of future attacks when making decisions in the current state, trying to cause system collapse with future attacks. Thus, the interactions in the sudden burst of consecutive cyber attacks should be modeled by a Markov game. For the individual attacks shown in Fig. 2.8, due to the recovery of the substations, the current attack will not coordinate with future attacks to cause system collapse, so a static game should be used to model the behaviors of the attacker and defender in this scenario.
The Markov Game
When the cyber attacker launches multiple attacks in a time period, the interaction between the attacker and the defender will continue with time, and this can generate a series of states which describes their respective optimized strategies. This series of interactions can be modeled by a Markov game, whose associated parameters are defined as follows [44], [45]:
▪ S: Set of the game states. Each single game state is a combination of the up/down statuses of all the related substations. When a substation goes down due to attack, it is denoted as 0; when it works normally, the status is denoted as 1. For example, if a small power system has 3 substations, the game state can be {1,1,1}, {1,1,0}, {1,0,1}, {1,0,0}, {0,1,1}, {0,1,0}, {0,0,1} or {0,0,0}. When the number of substations in a power grid is limited, the Markov game will be played in a finite state space.
▪ A: The player’s action space. At each time step the attacker can attack one up-state substation,
and the defender can reinforce one up-state substation. The attacker’s attack action a ∈Aa
indicates the substation chosen to hack. For the defender, the action d ∈Ad represents the
substation that the defender chooses to reinforce.
▪ 𝑀𝑆(𝐴): Mixed strategy set of the action set A. Each action 𝑎 ∈ 𝐴𝑎 or 𝑑 ∈ 𝐴𝑑is assigned with
a probability πa or πd with which the action a or d will be performed. For the attacker, 𝑆(𝐴𝑎) =
[𝜋𝑎,1, 𝜋𝑎,2, … , 𝜋𝑎,𝑁𝑎 ]and∑𝑘=1𝑁a 𝜋𝑎,𝑘 = 1 where Na is the number of the up-state substations.
▪ T: State transition probabilities. paud is the failure probability of an unreinforced substation
upon attack in a time step. pad is the failure probability of a reinforced substation when being
attacked in a time step. These probabilities are modeled in Chapter 2.4. The cyber attack/defense interplay associated with the down-state substations is not considered.
The usual goal of a cyber attacker is to maximize the loss while a defender will try to minimize the damage. Thus, they have opposite goals and the attack/defense interaction should be modeled by a zero-sum game. A pair of actions {𝑎, 𝑑} in state s will result in an immediate payoff to the players due to the game state transitions. For the attacker, the reward is quantified as the curtailed load. Since the state transition exhibits probabilistic characteristics described by pad and paud, the
attacker is defined as 𝑅(𝑠, 𝑎, 𝑑) when the attacker selects action a and defender selects action d in state 𝑠. The attacker’s expected immediate reward is calculated by
( , , ) ( , , , ) ( ( )s s( )) s
R s a d
T s a d s l s l s (2.13) where s′ indicates the possible next state; 𝑇(𝑠, 𝑎, 𝑑, 𝑠′),T: S×Ad×Aa×S→[0, 1] is the game statetransition probability from s to s′ when the attacker and defender take action a and action d, respectively. The transition probability is computed by the corresponding probabilities paud and pad,
based on the pair of action {𝑎, 𝑑}. The expected immediate reward of the defender is the opposite number of the attacker’s expected immediate reward.
Every state transition will make the game move to a new state in which the game will continue. If a following state transition happens in the new state, another immediate reward will be given, and the game will continue. Thus, a pair of actions {𝑎, 𝑑} taken by the players in a game state can also have a long-term accumulated reward besides the immediate reward [44]. An expected long-term reward is defined as 𝑄(𝑠, 𝑎, 𝑑) for the action pair {𝑎, 𝑑} in state 𝑠. Specifically, the attacker’s expected long-term reward for the action pair {a, d} in state s is computed as follows:
'
( , , ) ( , , , ') a( ') ( , , ) s
Q s a d
T s a d s V s R s a d (2.14) where γ is the discount factor and satisfies 0≤ γ ≤1, and a small value focuses on near-term reward while a large value emphasizes future long-term payoff; Va (s) is the expected optimal long-termreward for the action pair {𝑎, 𝑑} in state s, which is defined as follows: ( ) ( ) max min ( , , ) d a a a a d A MS A a A V s Q s a d
(2.15) Similarly, the defender’s expected optimal long-term reward in state s is represented as follows: ( ) ( ) min max ( , , ) d a d d d MS A a A d A V s Q s a d
(2.16)In zero-sum games, 𝑉𝑎(𝑠) and 𝑉𝑑(𝑠) calculated by (2.15) and (2.16) are the same, and it is denoted as 𝑉(𝑠) = 𝑉𝑎(𝑠) = 𝑉𝑑(𝑠). The optimal solutions computed independently by the attacker
and the defender are the best strategies. In such Nash equilibrium, no players have the incentive to unilaterally change their strategies. The optimal mixed strategy obtained by (2.15) is a maxmini
strategy considering Q which can be solved by linear programming [44]:
( ) max ( ) a MS A V s (2.17) s. t. ( , , ) ( ) a a a A Q s a d V s
(2.18) 1 a a a A
(2.19)0
a
(2.20) A solution method named value iteration is adopted here to calculate the optimal Q and V as shown below [45]. The value iteration method is based on dynamic programming, and a maxminiproblem is solved in each iteration as shown in step 7. Algorithm 2.1 Value iteration algorithm 1: Initialize𝑉0(𝑠) = 0 for all states 𝑠 ∈ 𝑆
2: repeat
3: for every 𝑎 ∈ 𝐴𝑎, 𝑑 ∈ 𝐴𝑑, 𝑠 ∈ 𝑆
4: update the value of 𝑄based on (2.14) 5: end
6: for every 𝑠 ∈ 𝑆
7: update the value of 𝑉 based on (2.15) 8: end
9: until converge
The Static Game
When only considering the immediate reward in (2.13) and neglecting the future reward in (2.14), the game is a static game. For the attacker, it could be solved by
( ) ( ) max min ( , , ) d a a a a d A MS A a A V s R s a d
(2.21)Similarly, for the defender, it could be solved by ( ) ( ) min max ( , , ) d a d d d MS A a A d A V s R s a d
(2.22) For the solution of the static game, it should be noted that right after the first iteration of algorithm 1, the obtained mixed strategy is the optimal mixed strategy for the related static game without accounting for future rewards, and 𝑉(𝑠) is the reward in state 𝑠 in static game.Power System Adequacy Evaluation
Successful intrusion and undesired tripping of the breakers can seriously impact the power system operation. If such incidents happen frequently, the overall power system adequacy would be inevitably degraded. The impact of man-made cyber attacks on the long-term system adequacy is determined by the occurrence frequency of attacks over a long period of time and the consequence of each attack. The frequency of cyber attacks is simulated by human dynamics. The consequence of each attack is influenced by the defense/attack strategies and action of the defender/attacker, etc., which is modeled by game theoretic studies. When a cyber attack against the substation succeeds, the status of the components in the substation would go down due to the tripping of related breakers. If the attack causes a system collapse, the whole system could be down. When a substation becomes down due to the cyber attack, the repair process will begin and it will be up again after some repair time. The repair time mainly includes the time required for cyber forensics and the time needed for device restart [46]. The mean time to repair after attack is defined as MTTRA and used in the simulation in this study.
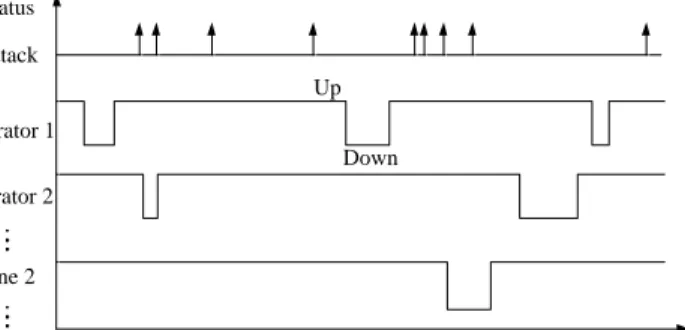
Two essential steps to incorporate physical failures and cyber attacks in power system adequacy evaluation are sampling states and evaluating the sampled states. The sampling process is shown in Fig. 2.10, where the top line represents the occurrence pattern of the cyber attacks
based on the human dynamics described in Chapter 2.2, and each arrow indicates an attack is launched at that time step. The sampling of the generators and lines, etc. without the cyber attack is performed based on the reliability modeling of these physical components as in conventional adequacy assessment. Generator 1 Generator 2 Line 2 Up Down Time Status 0 Attack
Figure 2. 10 Sampling of the attack occurrence and the component statuses
As shown in Fig. 2.11, the evaluation of a sampled system state is conducted considering the original components statuses, and the consequences of the attacks as well as the repair actions, etc. The consequence is determined by the attack/defense actions which are further determined by the attack/defense strategies. As described in Chapter 2.4, the attacker and the defender need to anticipate whether the attack is consecutive attack or static. The consecutive attack strategy modeled by the Markov game takes the future reward into consideration, while the static attack strategy modeled by the static game only accounts for the immediate reward. The judgment should be made by predicting whether sufficient amounts of attacks needed to cause system collapse will occur during the following repair time. For example, if the consecutive failure of three substations can cause a system collapse, the current attack should be judged to be consecutive attack if there are other two attacks in the following repair time. If there are only one or no attacks in the following repair time, it is not possible to cause system collapse, thus the current attack should be judged as individual attack. It is not an easy task for the attacker and defender to precisely predict future attack occurrence. These predictions could be made based on some social or political
considerations.
Sampled physical
components statues Attack consequence Attack action Defense action Attack strategy Defense strategy
State evaluation based on OPF Breakers tripping Physical component
reliability modeling Sampling
Repair action
Figure 2. 11 Evaluation of system state
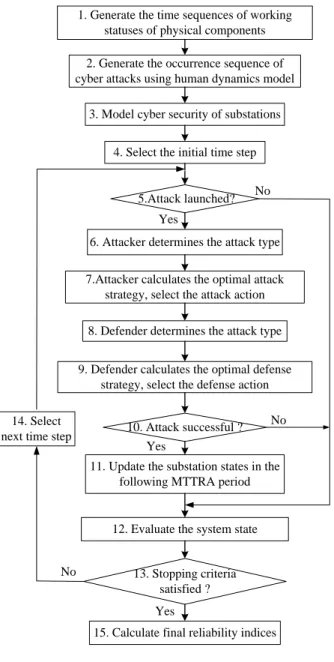
In this study, by extending conventional adequacy evaluation procedures [47], a holistic power system adequacy evaluation framework for integrating substation cyber vulnerabilities is proposed based on human dynamics analysis, game theoretic studies and sequential Monte Carlo Simulation (MCS). The major steps are depicted in Fig. 2.12, which are explained in more details as follows.
Step 1) Model the reliability characteristics of each physical component, including generators, transmission lines and loads, etc. Generate a time sequence of the status of each generator/line with sequential MCS.
Step 2) Generate a time sequence of cyber attacks using the opinion model considering the memory effect as described in Chapter 2.2.
Step 3) Model the cybersecurity of each substation. The cybersecurity of substations is modeled by paud and pad, as described in Chapter 2.3.
Step 4) Select an initial time step.
Step 5) For the current time step, check whether a cyber attack is sampled by examining the corresponding status in the time sequence of the cyber attack. If no attack is sampled, go to step 12.
2. Generate the occurrence sequence of cyber attacks using human dynamics model
2. Generate the occurrence sequence of cyber attacks using human dynamics model
4. Select the initial time step
4. Select the initial time step
10. Attack successful ?
10. Attack successful ?
12. Evaluate the system state
12. Evaluate the system state
13. Stopping criteria satisfied ?
13. Stopping criteria satisfied ?
15. Calculate final reliability indices
15. Calculate final reliability indices Yes
No
1. Generate the time sequences of working statuses of physical components
1. Generate the time sequences of working statuses of physical components
5.Attack launched?
5.Attack launched?
No Yes
Yes
3. Model cyber security of substations
3. Model cyber security of substations
6. Attacker determines the attack type
6. Attacker determines the attack type
7.Attacker calculates the optimal attack strategy, select the attack action
7.Attacker calculates the optimal attack strategy, select the attack action
9. Defender calculates the optimal defense strategy, select the defense action
9. Defender calculates the optimal defense strategy, select the defense action
11. Update the substation states in the following MTTRA period
11. Update the substation states in the following MTTRA period
14. Select next time step
14. Select next time step
No
8. Defender determines the attack type
8. Defender determines the attack type
Figure 2. 12 A holistic adequacy assessment framework considering cyber attacks against substations Step 6) The attacker determines the attack type. If there are sufficient amounts of attacks within
the repair time, the current attack should be considered as consecutive attack; or else the attack should be regarded as an individual attack. The attacker needs to predict future attacks and could make correct or wrong judgment.
Step 7) If the attack is judged to be consecutive, calculate the attacker’s optimal strategy by equations (2.13)-(2.15); if it is judged to be the individual attack, calculate the attacker’s optimal strategy by equations (2.13) and (2.21). The strategy can be a pure or a mixed one.
The attacker’s action is implemented by using a random number generator to choose the target substation to attack.
Step 8) Similar to step 6, the defender makes predictions about future attacks and estimates the attack type. The defender could make a correct or wrong judgment.
Step 9) If the attack is judged to be a consecutive attack, calculate the defender’s optimal strategy by (2.13), (2.14) and (2.16); otherwise, calculate the defender’s optimal strategy by (2.13) and (2.22). A random number generator is utilized to choose the defense action.
Step 10) Check whether the attack is successful or not based on both the pair of action {𝑎, 𝑑}
obtained in step 7 and 8 and the probabilities paud and pad. The attack can succeed with a
probability, and thus a random number generator is used to decide consequence. If the attack is not successful, go to step 12, otherwise, go to the next step.
Step 11) Update the substation states corresponding to the game state. If a substation is hacked down, the worst-case scenario is considered, i.e., all the breakers are assumed to be tripped. Since a down-state substation generally requires a time period of MTTRA to recover, the statuses of the components affected by the down-state substation will be down in this time period.
Step 12) Evaluate the physical system state. This is accomplished by performing the DC OPF analysis aiming at minimizing the total load curtailment at all buses.
Step 13) Check whether the stopping criterion is met. In the simulation, the maximum number of iterations is used as the stopping criterion which should be adequately large to ensure the convergence.
Step 15) Calculate the final adequacy indices. In this study, the adopted reliability indices are LOLP and EENS.
Case Studies
Simulations studies are carried out on the IEEE RTS79 system [48]. The RTS79 system has 32 generators and 38 transmission lines. The total generation capacity is 3,405 MW and the peak load demand is 2,850 MW. For simplicity, it is assumed that each substation is related to one bus. There are 24 substations in the RTS79 system. Since some substations are relatively more important than others, they could be the main targets for the attack/defense action. In order to reduce the number of Markov game states and alleviate the computing burden, the top 10 substations are chosen as the attack/defense target substations. The computational accuracy is not significantly affected by this because the probabilities of attacking the relatively less important substations are very low, which will be shown later in Fig. 2.13. The load curtailments in the substation are listed in Table 2.1.
Table 2. 1 Load curtailment caused by substation failure
Substation number 3 6 8 9 10 13 14 15 18 19
Load curtailment (MW) 180 136 171 175 195 265 194 317 333 181
In this simulation, the parameters for modeling the cybersecurity of all the substations are chosen as follows: paud=0.15 and pad=0.1. Game payoffs are calculated based on these probabilities.
For example, when all the substations are in the up state, the payoff matrix of the static game in terms of MW is shown in Table 2.2 and the payoff matrix for the Markov game is illustrated in Table 2.3 where γ =0.7. The discount factor γ prefers a large value as the Markov game aims at causing system collapse.