Port Investment
and Container Shipping Markets
Roundtable Summary and Conclusions
03
Discussion Paper 2014 • 03
Mary R. Brooks
Dalhousie University, Canada
Thanos Pallis
University of the Aegean, Greece
Stephen Perkins
Port investment and container shipping
markets
Discussion Paper No. 2014-03
ROUNDTABLE SUMMARY AND CONCLUSIONS
Mary R. BROOKS,
Dalhousie University, Canada
Thanos PALLIS
University of the Aegean, Greece
Stephen PERKINS
International Transport Forum, Paris, France
The International Transport Forum at the OECD is an intergovernmental organisation with 54 member countries. It acts as a strategic think-tank, with the objective of helping shape the transport policy agenda on a global level and ensuring that it contributes to economic growth, environmental protection, social inclusion and the preservation of human life and well-being. The International Transport Forum organises an annual summit of Ministers along with leading representatives from industry, civil society and academia.
The International Transport Forum was created under a Declaration issued by the Council of Ministers of the ECMT (European Conference of Ministers of Transport) at its Ministerial Session in May 2006 under the legal authority of the Protocol of the ECMT, signed in Brussels on 17 October 1953, and legal instruments of the OECD.
The Members of the Forum are: Albania, Armenia, Australia, Austria, Azerbaijan, Belarus, Belgium, Bosnia and Herzegovina, Bulgaria, Canada, Chile, People’s Republic of China, Croatia, Czech Republic, Denmark, Estonia, Finland, France, Former Yugoslav Republic of Macedonia, Georgia, Germany, Greece, Hungary, Iceland, India, Ireland, Italy, Japan, Korea, Latvia, Liechtenstein, Lithuania, Luxembourg, Malta, Mexico, Republic of Moldova, Montenegro, the Netherlands, New Zealand, Norway, Poland, Portugal, Romania, Russian Federation, Serbia, Slovak Republic, Slovenia, Spain, Sweden, Switzerland, Turkey, Ukraine, United Kingdom and United States.
The International Transport Forum’s Research Centre gathers statistics and conducts co-operative research programmes addressing all modes of transport. Its findings are widely disseminated and support policymaking in Member countries as well as
contributing to the annual summit.
Discussion Papers
The International Transport Forum’s Discussion Paper Series makes economic research, commissioned or carried out at its Research Centre, available to researchers and
practitioners. The aim is to contribute to the understanding of the transport sector and to provide inputs to transport policy design.
ITF Discussion Papers should not be reported as representing the official views of the ITF or of its member countries. The opinions expressed and arguments employed are those of the authors.
Discussion Papers describe preliminary results or research in progress by the author(s) and are published to stimulate discussion on a broad range of issues on which the ITF works. Comments on Discussion Papers are welcomed, and may be sent to: International Transport Forum/OECD, 2 rue André-Pascal, 75775 Paris Cedex 16, France.
For further information on the Discussion Papers and other JTRC activities, please email:
itf.contact@oecd.org
The Discussion Papers can be downloaded from:
www.internationaltransportforum.org/jtrc/DiscussionPapers/jtrcpapers.html
The International Transport Forum’s website is at: www.internationaltransportforum.org
This document and any map included herein are without prejudice to the status of or sovereignty over any territory, to the delimitation of international frontiers and boundaries and to the name of any territory, city or area.
3
TABLE OF CONTENTS
1. INTRODUCTION ... 4
1.1. The Context for Container Port Planning ... 4
1.2. Case Study: Chile ... 5
2. DEMAND FOR PORT CAPACITY ... 7
2.1. Forecasting Demand ... 7
2.2 Specific market segments ... 9
2.3 Congestion ... 9
3. CONTAINER SHIPPING MARKETS ... 10
3.1. Overcapacity and Deployment Patterns ... 11
3.2. Port Draft ... 13
3.3 Consolidation and cargo-sharing agreements ... 14
3.4. The Panama Canal ... 14
3.5. Port Policy and Efficient Scale ... 15
3.6. Vertical Integration and Port Terminal Competition ... 16
3.7. Cabotage and Short Sea Shipping... 17
4. HINTERLAND STRATEGIES ... 18
4.1. Road ... 19
4.2. Rail ... 20
4.3. Dry ports (inland ports) ... 24
4.4. Strategic Issues ... 25
5. DEVELOPING CONTAINER TERMINALS THROUGH CONCESSIONS ... 25
5.1. How many terminals? ... 26
5.2. Who is eligible to bid? ... 26
5.3. Quay and breakwater construction... 28
6. CONCLUDING COMMENTS ... 30
6.1. Key points for strategic port development planning... 30
6.2. Advancing container port terminal capacity in Chile ... 33
1. INTRODUCTION
1.1. The Context for Container Port Planning
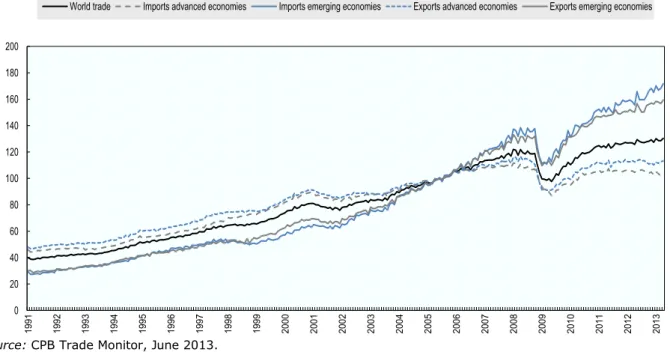
Ports around the globe are planning expansions to respond to the growth of containerised maritime trade and to the development needs of their hinterland economies. Following the dip in trade induced by the 2007-2008 financial crisis, global volumes are on the rise again (Figure 1), driven by growth in the emerging economies. Growth in trade will be supported by the WTO Trade Facilitation Agreement signed in Bali in December 2013 and expanding container port capacity is again a pressing issue in many locations. Inadequate container port infrastructure can be a severe logistics bottleneck and a constraint on growth. Efficiency and capacity need to increase in step with demand. At the same time port policy makers and container terminal operators have to match capacity to demand carefully to avoid costly overinvestment, a task complicated by rapid technological change in liner shipping markets with the introduction of larger vessels, rising fuel prices and restructuring through mergers and alliances.
Figure 1. Monthly index of world trade Advanced and emerging economies, 2005=100
0 20 40 60 80 100 120 140 160 180 200 1991 1992 1993 1994 1995 1996 1997 1998 1999 2000 2001 2002 2003 2004 2005 2006 2007 2008 2009 2010 2011 2012 2013 World trade Imports advanced economies Imports emerging economies Exports advanced economies Exports emerging economies
Source: CPB Trade Monitor, June 2013.
Large-scale port projects have irreversible effects on land use and multiple impacts on the local economy and local community. They affect the way that the regional and national economy operates as a whole, not just in the vicinity of the port, with major impacts on regional transport systems. Port planners make better decisions when these broad impacts are examined as part of the development of a national freight transport and logistics
5 strategy. Private investment in port terminals is also facilitated by the certainty engendered by development of such a national freight transport and logistics strategy. Decisions to invest in new container ports need in particular to take careful account of forecasts of hinterland demand for containerized trade, the broader context of evolving maritime transport markets, competition between ports, the development of port hinterland transport infrastructure, community attitudes towards port traffic and environmental issues.
This report summarises a roundtable on Port Investment and Container Shipping Markets held in Santiago, Chile in November 2013 that examined the issues that need to be considered before the decision to proceed to costly expansions with long-life spans and a structural influence on the local and national economy. The report benefits from a case study of Chile, where plans for a major expansion of port capacity in the central part of the country are well advanced. Chile provides the detail for an examination of factors critical to decisions on container port investments everywhere:
demand forecasts;
change in liner shipping markets;
hinterland transport capacity;
competition between container terminals; and
financing of investment.
The report is organised in 5 sections that address these issues in turn.
1.2. Case Study: Chile
Geographical location and physical geography make Chile more dependent on maritime trade infrastructure than many other economies. Chile’s exports account for 38% of GDP compared to an average of 27% in OECD countries. Approximately 95% of Chile’s foreign trade is transferred through its ports, with 75% of the total tonnage transferred by three ports – Valparaiso, San Antonio, and San Vicente – located in the central-south part of the country, close to the centre of economic activity around Santiago and some of the country’s main agricultural areas. Ports in the north and south account, respectively, for the major part of mine and forest products. Container transport is concentrated in the three central ports. The national port system uses a landlord model of port governance, widely applied around the globe. Following reform of the national port sector in the 1990s, responsibilities for port development was devolved in 1997 to 10 autonomous local Port Authorities (Empresas Portuarias), the mandate of which is to ensure good quality infrastructure and efficient port operations whilst maintaining sound finances1. There are also 14 privately owned public-use
ports, carrying various cargoes as well as smaller amounts of container traffic (Wilmsmeier 2013).
The Chilean landlord port model differs from that typical in Europe and North America in two ways. Terminal operators rather than port authorities are responsible for investment in piers and quays and port authorities are explicitly excluded from performing cargo handling operations. While port authorities in Chile purchase land for port development, they must concession freight transfer operations and pier infrastructure development to private
operators. Sixteen years after the reform, seven out of 10 Port Authorities had concessioned at least one terminal.
Chile’s rapid economic development is reflected in container traffic growth and investments are underway to meet forecast demand through extensions to terminals and new concessions
in the existing ports (Figure 2). Whether planned investment might be delayed, and for how long, by enhancing productivity at the two terminals are questions to be considered.
Additional productivity enhancements might delay the need for investment, but with San Antonio's current berth productivity already the best in South America, the delay may be of short duration2. . With committed facilities potentially reaching saturation in a decade, a
major expansion of port capacity is planned. In this context the Ministry of Transport began work on a National Ports Development Plan in 2012 to provide long-range vision on port capacity needs and a strategy for landside infrastructure development so that private investments in port terminals are able to deliver the services needed by the national economy. Following an initial examination of four potential locations in the central region – Ritoque, La Ligua, San Antonio and Valparaiso – the two latter ports were identified as potential sites for a large new container port with several terminals. Both sites might be developed in sequence. The options for expansion under consideration by the government and the process of project selection and development of a national port and freight transport development strategy are set out in an accompanying paper (Michea 2013).
Figure 2. Demand & capacity - existing and projected container terminals in the Santiago region
Source: Michea (2013).
In a nutshell, Chile presents a case of proactive port planning as a key to sustained economic growth. Examination of how it might proceed in establishing new capacity,
via which type
of projects and which aspects of shipping markets and hinterland transport and logistics are most crucial to the decision is instructive. Many countries face the need to advance major port expansions and the case of Chile offers lessons for a wider audience.2. In the top 20 ports in the Americas for berth productivity, San Antonio is currently rated as having a berth productivity index of 43, above that of Manzanillo in Mexico (42) but below that of Lazaro Cardenas, Mexico at 65 (page 9, Journal of Commerce (2013). The best practice port in the Americas is Long Beach at 74, showing that there is always room to improve productivity by benchmarking business processes against best in class.
7
2. DEMAND FOR PORT CAPACITY
2.1. Forecasting Demand
Forecasting demand for port services to align container handling capacity with the prospects for economic development requires disaggregation of global container shipping trends from regional and local economic factors. Local drivers of container traffic can be identified to a greater level of detail. It is useful to examine port regions, incorporating capacity present in the entire region rather than focusing on capacity limits at single ports. Projections of
demand need to be compared with actual, rather than designed port capacity as capacity is a function of terminal operating efficiency as well as physical dimensions. Performance
measurement and monitoring is essential to making informed investment decisions. Development of port capacity and performance indicators is deficient in many parts of the world and should be given priority by all port stakeholders.
Port productivity improvements can often reduce the pressure for expansion in the short to medium term; there are numerous methods by which higher utilization can be extracted from existing facilities including relatively small investments in container yard handling equipment, investment in new business processes and information technology systems, introducing port gate arrival reservation systems, introducing financial incentives to reduce port dwell time, extending the number of gang shifts or adding cranes, and so on. The
potential for such productivity improvements can be overlooked in demand projections based on past performance and future economic growth but as noted Chile’s main ports appear to have little margin to improve productivity without expansion.
The prospects for terminals of any size depend on productivity and utilization rates. The existing container terminals in Chile are intensively utilized, with dense operations and high levels of productivity. In the case of Valparaiso, the operational area is 14.62 hectares with an annual yard operation rate of 58.13 k TEU/Hectare. This is achieved via a container handling productivity that averages 70 moves per hour, twice the average in 2005.
Valparaiso averages 2.1 movements per container and 2.6 days dwell time, with 30 minutes average truck waiting time. The port handles approximately 1 600 TEUs per meter of quay annually; the average figure is more than 1 200 in South-East Asia, approximately 1 000 in Latin America, and less than 800 in Europe and North America (Caprile 2013). This makes Valparaiso an extremely efficient operation and the prospect of accommodating more
throughput at current capacity is remote. In the 2013 Journal of Commerce port productivity exercise, San Antonio was the only port south of the Panama Canal included in the list of the 20 most productive ports in the Americas (Journal of Commence 2013). The room for
improvement here is thus also comparatively limited. Accommodating more traffic in either port requires new capacity.
The difficulty of predicting future demand for ports is widely acknowledged and all long-term projections face uncertainty. Forecasts therefore need to examine alternate scenarios, at the very least to least to test different overall rates of economic and trade growth. Often more detailed, plausible scenarios can be identified to gauge the potential impact of specific risks.
Producing a range of credible scenarios will identify the period over which capacity limits are likely to become critical (Figure 2) and can give an idea of how robust different projects and development schedules are to change.
Scenario testing tended to be ignored in the bubble economy at the turn of the century, with globalization driving trade on top of economic expansion and consequent strong sustained growth in container shipping. Linear, even exponential, growth was expected by many to continue for years. The financial crisis of 2007 and subsequent economic recession exposed the deficiencies in this mind set. This problem is not of course unique to the port sector and optimism bias in demand forecasts frequently characterises major transport infrastructure projects (ITF 2013). The lumpy nature of new port development (large units of capacity brought into service at irregular intervals) makes it particularly difficult to match capacity to demand and can result in prolonged periods of over-capacity. This is a recurrent issue in northern European ports, exacerbated by long planning and approval procedures. The opening in 2012 of a 2.7 M TEU capacity terminal in the new Jade Weser Port in
Wilhelmshaven is the most recent major increase in capacity and for the moment has limited throughput (Acciaro and McKinnon, 2013). Sometimes demand never materialises. In ten years of operation the Ceres-Paragon 1 M TEU terminal in the port of Amsterdam never handled more than 0,3 M TEU and is now disused. Competition to attract traffic between port authorities that provide quays and piers with public finance may exacerbate the trend in this range.
Chile belongs more closely to the emerging economies in Figure 1 than the advanced economies in terms of trends in trade growth. It is experiencing rapid economic expansion and has a great deal of potential for further expansion of exports, depending on sustained growth in the economies of its trading partners. Chile has 22 trade agreements with 59 countries – among them Canada, Mexico, the United States, the European Union, China, and Japan – representing 86% of world GDP and 62% of world population. More free trade agreements are in negotiation. 93% of Chilean exports are covered by these agreements. Container traffic in the central region of Chile is forecast to outstrip port capacity as early as 2021. The diversity of Chile’s markets reduces vulnerability to possible prolonged economic stagnation in Europe but calibration of trade forecasts with scenarios for economic growth in key trading partners might be a useful refinement to current forecasts.
Forecasts of demand for maritime transportation services are commonly produced with the use of econometric models based on correlations and regression analysis that often produces exponential projections. Disaggregated econometric analysis is valuable for understanding the current drivers of growth, product category by product category. It is also valuable for calibrating alternative scenarios. Clearly the potential time over which exponential growth can continue varies greatly by market and commodity. Many markets will show signs of saturation over the timeframe for project planning, with demand following an S shaped curve. In aggregate, Chilean container shipping markets are likely to be on the steep part of the curve for some time to come. Moreover, import consumption patterns could change sharply as average incomes rise with potentially large increases in imports of consumer durables and electronics. Potential limiting factors for some key commodities should nevertheless be investigated; for example, the availability of irrigation water has the
potential to limit expansion of fruit production for export in the central belt of Chile. Imports and exports of non-containerised goods also need to be forecast as container terminals often share port space with bulk goods and both absorb hinterland transport capacity; in central Chile this includes significant quantities of copper plate for export and imports of milled steel. Other variables that might determine the demand for container trade include productivity growth in the domestic economy (which has been sluggish) and transport and economic integration with neighbouring countries. Some specific developments are worth modelling,
9 including plans for a new railway crossing the Andes from Mendoza in Argentina north of Santiago and a new highway link located about 100 km south of Santiago, which will provide a faster route through a lower pass than the existing route north of Santiago and will be less prone to closure by snow.
2.2 Specific market segments
Specialised container markets have their own dynamics and deserve close attention as they provide opportunities for growth and could compete for capacity with existing traffic. Demand for refrigerated containerised (reefer) cargo exports is increasing globally and particularly strongly in South America (Vagle 2013). Vessel capacity for reefers has increased
correspondingly, with ships serving Brazilian ports holding the record for the number of plugs for refrigerated containers. Demand from cargo owners and shipping lines for shore-side reefer plugs is similarly increasing. Growth in this demand has been notable in Chile as its exports of fruit and seafood have tripled over the last decade (Wilmsmeier 2013). Seasonal produce like fruit is particularly vulnerable to delay from port congestion. For ports that export large quantities of seasonal produce it is also the critical driver of congestion. Capacity and reliability at peak demand periods are the relevant congestion indicators rather than average utilisation rates.
Reefer cargo in increasing volumes is moved using transhipment as port operations in transhipment ports in the region have significantly improved their efficiency (e.g. in Panama and Cartagena, Colombia). Still, reefer trade pays a significant premium, and reefer cargo owners prefer to avoid transhipment services.
Another issue worth exploring is the potential of demand from underdeveloped segments of the container shipping market. Expansion of the range of goods transported in containers might shift traffic from the non-container segment of the market, i.e. bulkers, to container ports. Chile’s primary export of copper is not particularly suited to containers but there may be other cargoes that will benefit from container port expansion. Assessment of the scope for such modal segment shift is worthy of investigation including review of recent trends in containerisation of commodities on other trade routes.
2.3 Congestion
Commonly, congestion problems appear in ports when the average terminal utilization of a heavily used facility passes the 70% mark. This may be the result at certain times of the year of seasonality in trade flows. Extended gate opening hours can provide some response to seasonal peaks but, where this traffic represents a large part of the total volume of trade, peak demand is the relevant planning criteria. In Chile, Valparaíso and San Antonio ports already show symptoms of congestion. In 2011, a ratio of waiting time/service time of 16.8% was reported as average for the STI San Antonio and TPS Valparaiso terminals, 10% being a broad ‘best practice’ reference figure for the ports. Congestion could clearly become a problem before the capacity and demand curves cross in Figure 2, i.e. before 2021. The emergence of congestion problems has intensified the efforts of planning at both port and national level as it will have increased overall logistics costs for container trades.
The cost of congestion and resulting inefficiencies experienced at the yard and along the logistics chain differ according to type of cargo, as does the extent that increased logistics costs are associated with increased manufacturing costs. However, in all cases these costs are significant and have a vital impact on the decisions of port users. Congestion may lead cargo owners, logistics service companies or shipping companies to relocate or completely reorganize transportation activities. If Chile’s central ports were to suffer chronic congestion,
traffic would divert to the Concepción Region, 500 kilometres south. This would change landside costs and depending on origin/destination result in longer journeys by truck for some traffic and potentially higher costs, implying a loss in competitiveness for Chilean trade. Port planners need to act well in advance of anticipated congestion. Due to the scale and complexity of major port developments and site-specific engineering challenges, environment permit approvals and maintenance of good port-city relations often require lengthy
11
3. CONTAINER SHIPPING MARKETS
The configuration of shipping networks is an important factor in decisions about port infrastructure and port system development. One impact of the introduction of very large vessels (Figure 3) on high volume trade lanes has been a cascade of large vessels to other routes. General overcapacity of the container fleet in the wake of the financial crisis is also tending to increase vessel size on lower volume routes as older, smaller vessels are retired to make use of newer, more productive and fuel efficient vessels. As a result, larger ships are appearing in ports on lower volume routes. Very large 10 000 TEU capacity, 16 m draft ships already operate on the relatively low volume North-South trades serving the east coast of South America.
Figure 3. Evolution of New Generation Container Ships
Note: All dimensions are in metres. LOA: Length overall.
Source: Ashar and Rodrigue, 2012. Copyright Dr. Jean-Paul Rodrigue, Dept. of Global Studies & Geography, Hofstra University, New York, USA.
3.1. Overcapacity and Deployment Patterns
There is currently overcapacity in the global container shipping market, due mainly to two factors: (1) delivery of large ships ordered before the 2007 financial crisis and (2)
technological change, with the introduction of a new generation of even larger ships offering significant increases in productivity. The capacity of the top 20 carriers alone increased by 29% over the period 2010-12 (Slanderbroek 2013). The ultra-large containership, the biggest for the moment being the triple-E design, 18 000 TEU vessel has arrived. In the absence of strong growth in container volumes transported, their introduction has resulted in freight rates that are lower than experienced in the past in spite of a general recovery in seaborne trade in 2010-2012. Low freight rates, cash flow constraints imposed by banks restricting lending as they recapitalize in the wake of the financial crisis, and more expensive bunkering costs as oil prices stay high and fuel quality regulations require more use of high grade fuels3 have all contributed to the deterioration of liner shipping company accounts and
negative financial results for the sector since 2010. As a result, shipping lines revisited their strategies for vessel deployment and network configuration, restructuring routes and
services.
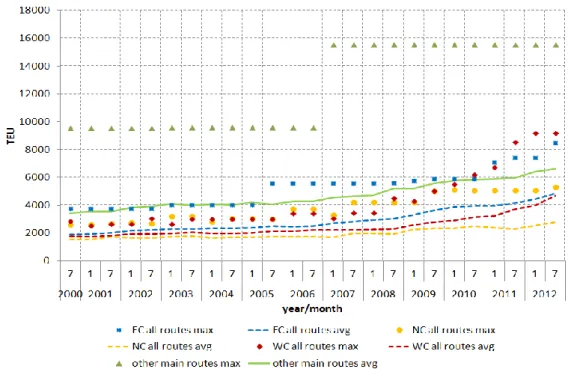
Figure 4. Evolution of vessel capacity on main trade routes and in South America, 2000-2012
Note: main trade routes include transpacific, transatlantic and Europe-Asia. Source: Wilmsmeier (2013).
Since 2008 there has been an acceleration in the increase in the size of vessels deployed in all regions of the world (Figure 4). Since early 2013, ships of 18 000 TEU capacity have been introduced on the busy Asia-Europe routes, displacing post-Panamax size vessels (5 000-13 000 TEUs) onto routes operated by smaller vessels. South America is among the regions that has felt the impact of this cascading effect and has seen the deployment of larger
container vessels. In recent times, the region saw vessels grow to 9 000 TEU on West Coast routes and 11 000 TEUs on routes to ports in Argentina. These bigger vessels serve a
continuously increasing demand, based more on the dynamics of the Latin America and
13 Caribbean (LAC) economies (Figure 5) rather than the global seaborne trade development trends (Wilmsmeier 2013).
A worldwide order book of 110 vessels of between 10 000 and 18 000 TEUs to be delivered by 20164 suggests that the cascade will continue. This may be a temporary phenomenon and
large vessels might be redeployed to the main trade routes if growth picks up. Port policy makers need to anticipate both local and external factors that determine the size of vessels deployed on routes serving their market. In short, major new port developments in most regions will need to be designed to be able to accept very large vessels in terms of draft, quay length, turning basins and crane reach.
Figure 5. Total Container Throughput in LAC ports (MTEU)
Source: Wilmsmeier (2013).
3.2. Port Draft
Due to continuing increases in vessel size, existing container terminals with draught restrictions might face a degree of obsolescence. The international standard of 12 meters draught of a decade ago is obsolete; the new post-Panamax requirement is 13.2 meters plus and many international ports consider 15 meters the minimum to offer customers. In
addition to deeper waters, container ports also need longer berths. Dredging capacity and adequate turning circles will become increasingly important to port access. In Chile, the current draft in Valparaíso is 12.5 meters and that of San Antonio 12.4 meters. Both ports have access to deep water with minimal dredging. Plans for new container ports at either location are based on a navigational depth of 16 m.
4. Source: www.alphaliner.com.
3.3 Consolidation and cargo-sharing agreements
Inextricably linked with these trends is a development of a different kind, consolidation of the liner shipping market and the presence of fewer but larger shipping lines. Horizontal
integration affects competition, even when it takes the form of cargo sharing agreements rather than formal consolidation.
The most recent major cargo-sharing arrangement is the P3 Alliance involving three major carriers (Maersk, MSC, and CMA-GGM) together representing 38% of the world’s container fleet capacity. Together these three shipping lines operate a reported 255 vessels. The second major alliance is the G6 Alliance involving 6 carriers — Hapag-Lloyd, NYK, OOCL, Hyundai Merchant Marine, APL and MOL — that deploy 240 container ships serving 66 ports in Asia, America and Europe.5 If cleared by competition authorities in Europe and the USA,
the formation of the P3 Alliance has the potential to be a game-changer. This might happen not only because of the success of this alliance per se, but also because of its influence on how other shipping lines decide to align their strategies. This will not only have operational implications for terminal operators but will also change the balance of negotiating power between ports and carriers, as well as between carriers and shippers. For the moment, the P3 Alliance is an agreement to be implemented on the Asia-to-Europe route where its
partners are estimated to command a market share of 42%. If it is successful on that route, it is likely to expand to other parts of the world, including trans-Pacific trades.
3.4. The Panama Canal
The Panama Canal is currently being expanded to allow passage of larger ships. For container ships, the newly constructed facilities are expected to accommodate vessels up to 13 000 TEU by 2015, compared with a maximum size today of approximately 5 000 TEUs. This increase in capacity to handle larger vessels is expected to significantly reduce the cost of transoceanic shipping on a per container basis. Canal expansion could see large vessels operating West Coast South America—Europe trades. Accelerated development of transshipment hubs around the Canal might have an opposite effect; with shipping lines reconfiguring routes to serve South American ports through feeder services although the volumes currently being handled on both South American coasts suggest this is unlikely to be a dominant trend. Of the cargoes transported from/to Chile, 60% are traded with Asia and therefore little affected by Panama Canal considerations. On these Asian routes vessels of 9 000 TEU are already in service (Figure 4). Widening of the Panama Canal is not expected to significantly affect Chile’s maritime container transport system; rather than creating a break in trend, recent trends towards larger vessels will be reinforced.
Similarly for North America, a major study by the U.S. Maritime Administration of the impact of the expansion on U.S. ports concluded that, beyond the immediate ports near the Canal, which can be expected to see significant growth, the expansion will only have major effects on specific trade routes (those providing East-West services between the Far East and U.S. East and Gulf Coast ports), and particular trades (agricultural and energy exports to Asia from U.S. East Coast ports will be able to move through the Panama Canal on larger bulk vessels operating at deeper drafts than current Panamax vessels). The study foresees no significant impact on West Coast U.S. ports (US DoT 2013).
Panama Canal expansion has been accompanied by significant investment in container terminals in the regions close to the Canal as well as in the Caribbean. Development has
5. Source: www.alphaliner.com
15 been notable at Cartagena in Colombia as well as further afield at Lázaro Cárdenas on the Pacific coast of Mexico. Further development of container capacity in Panama is expected, particularly on the Pacific coast. The Panama container terminals principally aim to attract transshipment cargo, inter-connecting Asia–East Coast South America and Europe–West Coast South America trades and exploiting scale economies. Lázaro Cárdenas in Mexico also has the potential to become a transhipment hub, given its location on east-west routes
through the Canal and the size of its hinterland market, including Mexico City, with hinterland rail services stretching as far as Kansas City.
3.5. Port Policy and Efficient Scale
The configuration of shipping networks shapes port development rather more than ports shape shipping networks. In the 1990s for example, new shipping lines entered the Latin America and Caribbean (LAC) market, one example being the arrival of MSC in 2000 followed by a number of mergers and acquisitions of shipping companies in the region. This changed the pattern of port throughput in a range of ports and the pattern continues to evolve. Nevertheless, decisions on the configuration of liner shipping networks are influenced by land-side factors including port development plans, port and terminal operator’s policies towards shipping lines, hinterland size, market specifics and institutional governance issues (Wilmsmeier 2013).
Scale is important. Without the prospect of scale economies it is difficult to attract the
interest of terminal operators to invest in, or even operate, a terminal. As there are no limits on the absolute size of terminals, apart from physical constraints imposed by the site, the question of terminal/port size is one of demand, competition, and efficient operation. In some circumstances there may be a choice between opting for increasing capacity via one mega-project or planning two or more separate port expansion projects. There is no standard methodology for determining the technologically efficient size of ports and the size of
efficient terminal handling capacity evolves with the ships to be served. Local and international terminal operators may have different views on the size of unit required to serve the market competitively. Modeling needs to be accompanied by observation of the market and discussions with potential port users on the optimal scale of development. Large container ports currently under development across the world typically comprise a number of 1.5 M TEU per annum capacity terminals, similar in scale to the two port developments under consideration in Chile. San Antonio would comprise four terminals of 1.5 M TEU capacity constructed in stages, totaling 6 M TEU when complete. Valparaiso would consist of two 1.5 M TEU terminals constructed in stages, totaling 3 M TEU).6 The level of intra- and inter-port
competition, the specific geography of the port hinterland and the volume of the cargo base all influence decisions about inter-port competition and phasing of multi-port services. The scale at which a terminal can operate is also dependent, to some extent, on the size of the land site available for terminal development.
Evidence suggests that container terminals show a tendency towards an ever-larger scale. In Europe, the average scale of new terminals in the ports of the Rhine-Scheldt Delta increased from 0.5-1 million TEUs in the 1990s to two million TEUs and above in the second part of the 2000s. At throughputs of 300 000 TEUs per annum, it is viable for a port to commercially support two or more common user container terminals. However, the choices vary and there is no correlation between market size and number of terminals. At any specific throughput
6. Examples of new terminals within this range are found in Asia (i.e. Jebel Ali new Container Terminal 3, due to open next year, has an annual capacity of 4 MTEU; Port of Ennore, India 1.5 MTEUs), Europe (COSCO terminal in Piraeus increases to 3.7 MTEU in 2015) and America (Puerto Cortes, Honduras, 1.8 MTEUs)
above one million TEUs, there are from one to seven terminals, but in some cases the numbers are into double-digits. The benchmarks are strongly influenced by Asian ports, where there is a tradition of providing shipping lines with their own dedicated terminals and it is rare for landlord ports to support more than four common user operators. In Europe, the maximum number of terminals is five with the median size varying from 363 000 to 683 000 TEU per annum with the exception of Rotterdam. In North America, the maximum number of terminals is eight with the median size of terminals ranging from 300 000 to 746 000 TEU. Some South American ports like Rio de Janeiro have been deliberately subdivided at
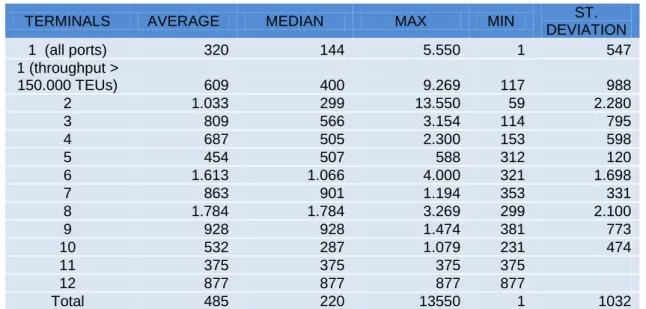
relatively low throughputs. On the other hand, around 23% of the large ports with container throughput above two MTEU in 2007 and about half of the ports with a throughput level between 1.5 and two million TEU have only one container terminal (Kaselimi et al., 2012). Roundtable participants agreed that for an anticipated long-term throughput growth to 6 million TEUs, a terminal offering 1.0-1.5 million designed capacity would be of interest to potential bidders and be efficient. Competition is well served with three terminal operators competing for the business in the port region.
Table 1. Throughput scale of container terminals in ports for a sample of 423 ports around the world in 1000 TEU - figures for 2007
TERMINALS AVERAGE MEDIAN MAX MIN ST. DEVIATION 1 (all ports) 320 144 5.550 1 547 1 (throughput > 150.000 TEUs) 609 400 9.269 117 988 2 1.033 299 13.550 59 2.280 3 809 566 3.154 114 795 4 687 505 2.300 153 598 5 454 507 588 312 120 6 1.613 1.066 4.000 321 1.698 7 863 901 1.194 353 331 8 1.784 1.784 3.269 299 2.100 9 928 928 1.474 381 773 10 532 287 1.079 231 474 11 375 375 375 375 12 877 877 877 877 Total 485 220 13550 1 1032
Source: Kaselimi et al. (2012), based on data of Containerisation International Yearbook 2009
3.6. Vertical Integration and Port Terminal Competition
The container terminals in Chile are at present all operated by domestic companies.
International terminal operators have made preliminary preparations for bidding for terminal concessions in Chile in the past but withdrawn. The roundtable discussed the potential merits of investment in Chile by one of the international liner shipping companies operating its own terminal. This might have the advantage anchoring liner services to a Chilean port and stimulate shore-side investment in ancillary businesses. This, however, is already happening with, for example, recent investment by Maersk and MSC in manufacturing reefers at San Antonio.
Vertical integration of activities along the supply chain can yield economies of coordination, reducing costs, but can also reduce competition along the supply chain. Vertical integration combined with horizontal mergers and coordination agreements between shipping lines could affect competition significantly. Competition authorities in large jurisdictions such as the European Union and USA have far reaching effects on global shipping interests and existing
17 competition law provides adequate powers to maintain efficient markets (ITF 2010).
Relatively thin markets distant from powerful competition jurisdictions, like Chile, are more vulnerable to monopolistic behaviour, and a foreign-based monopoly has the disadvantage compared to a local monopoly of being likely to repatriate rents abroad. The effective remedy is to minimise rents through adequate horizontal competition, between terminals. The view of the roundtable participants was that three competing terminal operators in the region served by San Antonio and Valparaiso are adequate and sufficient to ensure efficient prices and levels of service (Jara-Díaz, Tovar and Trujillo, 2008 and Tovar and Wall, 2012). With the establishment of larger terminals in a new port it will, however, be important to ensure that in time there are two competing terminal operators in first of the new ports, as the new terminals can be expected to enjoy economies of scale. As noted above, it is not obvious what the most efficient terminal size is. Assuming for a moment that larger yards with multiple berths do have advantages, the port project at San Antonio provides the possibility of concessioning the first and second terminals to different operators and, when terminals three and four are leased, allowing the operators of terminals one and two to compete for their adjacent units (see figure 7).
3.7. Cabotage and Short Sea Shipping
Transhipment is a significant part of container port expansion plans in many places. Chile, however, is located far from the main maritime shipping routes and far from zones propitious for transhipment where routes cross. Chile’s ports are at the end of the line rather than at the gateway to a region of potential feeder ports. Transhipment does not therefore figure in the development plans of the country’s ports. Plans for a large expansion of the port of Callao in Peru could have an impact on Chile but for similar reasons Callao is not well placed to develop transhipment. Liberalisation of cabotage in Chile could have a more significant effect, permitting efficiencies in the use of ships (reducing costs) and potentially substituting for some long distance road traffic (reducing the external costs of pollution, congestion and crashes on the roads) and increasing port activity in Chile overall.
Countries with long coastlines – Chile among them — may be able to attract cargoes to move by short sea shipping rather than roads but current regulatory barriers may restrict this potential. A tradition of protected trades limited to vessels flying the national flag exists in many nations, including in North and South America. Cabotage services represent an opportunity when considered under the prism of spare capacity on ships that could be
utilised. This is particularly important if the long coastline is at the end of a pendulum service as in Chile; the liner company is more likely to drop the last port on a pendulum if a port is to be dropped from the string in a re-design of its networks. Adding cabotage traffic can make a difference to the economics of maintaining service on the last leg.
Regulatory changes may be needed to take advantage of cabotage opportunities. In the Chilean case, these were identified to be the need to expand the waiver of the condition to use Chilean-flag vessels (currently only available to up to 400 tonnes cargo per shipment) or even provide unlimited permission to transport cargo without using Chilean–flag vessels. The second option may not be politically palatable but has not been studied and so is at least worthy of investigation.
Developing short sea services is also about examining the potential of cooperation with the trucking industry. This was the backbone of developing intermodal rail service in the U.S. in the 1990s. The desire is to serve cargo owners (exporters and importers) efficiently and effectively, thereby ultimately reducing prices and the cost for the cargo to reach its final destination; exports can be grown if end-market prices are more competitive. Establishing the potential for short sea shipping to compete with road, and the efficient equilibrium between the modes in a barrier free market in Chile is a research gap to be addressed.
4. Hinterland Strategies
Ports are an integral part of the overall transport and logistics system. For an efficient system, transport infrastructure capacity in the hinterland must be matched seamlessly to the development of ports. Port development also needs to be planned to maximise the potential for value creation in the supply chain and depends therefore on the organisation of logistics services in the hinterland. Planning for port expansion needs to take a logistics business perspective in determining the optimal development of terminals, customs and inspection, vehicle management, warehousing and other landside capacities. Fostering the establishment of networks of logistics activities at the landside of the port can create value for the port itself. The reach of the port, and its competitiveness with other ports in its range, is determined largely by the quality of its connections with road, rail and, where they exist, inland waterway networks.
Large-scale port projects require particularly careful planning of landside connections. A core element is assessment of the options associated with each mode of landside transportation and the development of a strategy for optimal integration with each mode, given the
constraints of physical and economic geography and the regulatory environment for road and rail transport. Responsibilities for investment and regulation vary by jurisdiction. Port
authorities usually provide essential coordination of access to essential facilities, either providing rail access to terminals in the port or brokering equitable access agreements to infrastructure owned by one of the stakeholders. Port authorities in a few locations, for example Rotterdam, play a major, pro-active role in developing seamless hinterland
transport, making joint investments in hinterland infrastructure and promoting effective use of all modes available through conditions negotiated in concession agreements (De Langen 2008). The role of the central government in investment in hinterland transport links also varies by jurisdiction but even where infrastructure is privately owned, grants or other forms of financial support (loans, bond guarantees) are often available for capital investment to upgrade infrastructure as ports expand (Acciaro and McKinnon 2013). Designating land for adequate hinterland transport infrastructure is fundamental to planning for new port
development. This has to be done well upstream of investment in order to avoid speculative land acquisition complicating the process of infrastructure development and increasing its cost.
Logistics costs in key sectors of the Chilean economy have reached 19-20% of the total costs when one would expect such costs not to exceed 8-9% (Guasch 2011). Seasonal congestion is one factor, as noted above, but as port operations are among the most efficient elements of the supply chain in Chile, weaknesses also lie elsewhere. They may lie in the organisation of the logistics industry itself; but also in hinterland transport services. While there has been from major highway investments, rail investment has been limited. The Ministry of Transport is also examining the potential to reduce lighthouse dues, which are higher than in
neighbouring countries.
Costs may also be driven by the performance of customs and sanitary inspection services. Significant economies could be achieved through organising joint customs and sanitary
19 inspections. Performance indicators would be useful for reducing costs. The quality and capacity of customs and inspection services is integral to trade performance and needs to be planned from a business perspective, providing services where they are most effective – including away from ports when space limits capacity in the port – and more generally functioning as a service to exporters and importers rather than an administrative barrier. 24/7 operation might ease congestion in the seasonal peak.
In other OECD countries with trade shares of GDP similar to Chile, such as New Zealand and Australia, customs services have a clear mission to facilitate trade, backed by performance indicators. More than 20 aspects of service quality are monitored in Australia, for example, with performance against headline targets published regularly (table 2).
Table 2. Performance against trade facilitation targets in 2010–11, for the Australian
Customs and Border Protection Service Source: Australian Customs and Border Protection Service, Annual Report 2010-11.
4.1. Road
The truck is usually the least expensive means of reaching destinations close to the port and its flexibility in terms of frequency and providing last mile access makes it the principal mode of transport in many markets. The major negative impacts of truck traffic are road
congestion and pollutant emissions. Both can become a constraint on port development. Santiago has a major air pollution problem with recurrent episodes of particulate and NOx levels exceeding air quality standards during periods of winter temperature inversions. Port expansion is largely frozen in Los Angeles/Long Beach, for example, until levels of particulate pollution from trucks are significantly reduced and air quality improves in the city because of the risk to health from pollution and the perceived contribution of port activity to the problem (Giuliano and O’Brien 2009). Port city residents are almost always unhappy with the growth in road transport that port expansion produces, and naturally become vocal if landside investment and traffic management does not keep pace with port expansion.
Managing road connections starts with the organisation of trucks at the terminal gate. Different options exist, including replacing the traditional first-come-first-served system, where trucks are served and containers are loaded as they become available, with an appointment system for loading and unloading. This is widely used on both sides of the Atlantic. An alternative is the ‘window’ system, with pre-determined slots established when trucks are allowed to collect/deliver cargo, used in some Chinese ports. The applicability of each option will depend on local factors, such as the regularity of containerships arrivals and the location and reliability of customs and sanitary inspections.
Appointment systems (even the simplest, one day advanced notification systems) provide significant benefits on the port side of the gate, allowing containers to be marshalled in advance into small lots for rapid handling at collection. They provide for load spreading, reducing peak traffic and making use of off-peak periods to sort containers. On the other side of the gate they also have the potential for reducing peak traffic and cutting truck waiting
Key performance indicators Target* Actual
Availability of electronic cargo systems to Customs and Border Protection clients (excluding scheduled outages)
99.7% 99.7%
Proportion of electronically lodged cargo documents where a response message is transmitted within five minutes
times. The benefits can be substantial but there can be additional costs for trucking companies. If windows are tight and inflexible, more trucks or drivers will be required to guarantee availability.
The near universal availability of mobile phones makes it possible to provide a great deal of flexibility for ports with suitable gate management IT systems, minimising the costs imposed on trucking. In the case of Southampton container port, for example, appointments can be amended or rescheduled up to 15 minutes before pick up, with (modest) penalties applied for missing appointments only when this limit is passed (Davies 2009). All port gate
management systems require adequate parking and waiting areas on routes approaching the port.
Innovative gate management systems are driven by necessity. In Southampton very little land-side space is available because of the location in a heavily urbanised area. Rapid growth in container traffic in the early years of the century created severe yard congestion that prompted introduction first of an optional appointments system, with limited success, then a mandatory but highly flexible system that has worked well. The Los Angeles Pier Pass system provides for extended gate opening in a similarly constrained environment (Giuliano 2009). The site of Valparaiso container port is even more constrained geographically, at the foot of a steep hill and adjacent to a UNESCO World Heritage site. The response has been to move customs and inspection to a location 5 km from the port, where parking space is available, with a new link road providing direct access to the port and to the Santiago highway. Trucks are dispatched from the parking area to the port when containers are ready for collection. San Antonio port experienced a number of severe congestion episodes on the approach roads to the port in recent years, and in response invested in off road parking areas and a traffic monitoring and alert system, in cooperation with the highway concession and police force, to prevent repeat incidents. Development of a large new container port/terminal in either city will require investment in high capacity link roads and capacity enhancements to the national road network. Freight transport demand forecasts for the ports need to be coordinated with highway traffic forecasts and the demand and revenue projections of the highway
concessions as discussed in Section 2 above. Capital investments to increase the capacity and reliability of connecting highways will be essential to ensuring that port investments achieve their expected financial returns.
4.2. Rail
Rail connectivity is often of strategic importance to potential new port terminals.
Opportunities for rail transport are to a large extent subsidiary to historical development of the national rail system and to national policy towards rail freight. The economic geography of the USA, for example, with a large integrated market and widely spaced industrial centres, favours rail transport and deregulation of the railways in 1980 reversed a long term decline in the share of freight carried and restored profitability. Trucks are the preferred mode of transporting containerized goods inland from US ports for routes of less than 750 km7 but rail
has traditionally carried a relatively high share of US commodities flowing outward. On long distance trunk routes in both Canada and the US rail is dominant.
7. The road: rail trade-off in terms of cost efficiency is between 500 and 750 kms according to Resor et al. (2004); in Canada, the distance is considered to be one-half day’s driving distance by truck.
21 The national rail system in Chile has more in common with rail in Great Britain than the USA (although rail carries much larger volumes of passengers in the UK than Chile and, if mine railways are excluded a larger share of freight traffic). Both UK and Chilean freight rail
systems were privatised and vertically separated in the 1990s and in both systems passenger trains take priority over freight on the general-purpose network. In both, infrastructure is owned and managed separately from freight train operations (Thompson and Kohon 2012). In Chile the rail freight task was 4 billion t-km in 2011. The domestic freight transport market in 2009 (in tons) was split 3% rail, 84% road and 13% coastal shipping (EU 2010). In Great Britain rail carries 9% of freight t-kms (21 billion t-km in 2011), road 60% and short sea shipping 26% (UK DfT 2011).
Containers account for only a third of the rail freight in the UK nevertheless, rail provides good access from the country’s main ports to key centres of population and industry and 25% of containers entering the country are carried by rail8. At the two main container ports,
Felixstowe and Southampton, rail accounts for 20 to 30% of inland container transport (GHK and Royal Haskoning, 2008). The share has grown over the last decade in response to congestion on the roads, investment by train operators and infrastructure capacity enhancements supported by capital grants from government.
In Great Britain rail freight pays track access charges on the basis of avoidable costs. These usually cover only wear and tear and operational management costs. They do not currently reflect capital investment costs as freight is rarely the prime user of rail tracks in the UK, although the rail regulator is considering introducing contributions to capital investment costs for some categories of freight as volumes grow on some routes. Capital investment therefore can be a barrier to expanding rail freight service to ports, although in recent years
containerized rail freight services have benefited from the enlargement of the loading gauge on strategic routes to the main deep-sea ports of Southampton and Felixstowe, permitting the movement of 9’6” boxes. The Southampton link was jointly funded by government and industry. The largest share of funding was provided by the Department for Transport (£43m). Other contributors included Associated British Ports, the South East England Development Agency and the European Regional Development Fund. In the year following gauge enhancement on the line from Southampton to the West Coast Main Line, the main spinal rail route in the UK, rail’s share of container movements to / from this port rose from 29% to 36% (Freightliner, 2013). The gauge enhancement to Felixstowe was financed out of the Department for Transport's Transport Innovation Fund.
In competing with more flexible road transport, rail has to overcome the “double lift penalty” involved in transferring containers to trucks for final delivery. The labour and fuel economy advantages of rail overcome this penalty beyond distances of around 350km in UK
conditions; the competitiveness of rail is determined by factors including maximum train capacity/length, loading gauge (single stack in the UK), infrastructure charges (only avoidable costs are charged in the UK) and road congestion. The major plus of rail is the potential of transporting larger volumes of containers in a more reliable (depending on rail network quality, freight train priority, management quality and labour relations etc.) and environmentally-friendly way and without impinging on the car-driving public.
Stakeholder coordination is critical to policies to prioritise rail transport. Hamburg port has achieved a modal split of 30% for rail in a system with 92 different railway operators moving
8. Freightliner http://www.portoffelixstowe.co.uk/partner-directory/rail-companies/freightliner/
more than 230 freight trains per day. 36% of container transport was carried on rail in 2010 and the share is planned to exceed 40% by 2025 (HPA 2012). The main terminal operator, HHLA, is one of the few terminal operators that runs its own trains and accounts for a large share of rail carriage. The port authority ensures train operators serving terminals have equitable access to track infrastructure.
Voluntary agreements for sharing essential facilities are widespread in both Europe and North America (partly because regulatory intervention would risk discouraging investment). As noted in ITF (2009), the Port Authority of Antwerp brokered a large reduction in SNCB’s prices for locomotives hauling trains within the port in 2008; SNCB, the incumbent national train operator, was the only company with locomotives authorised to run on the intra-port network. In Rotterdam a neutral company, Rail Feeder, was created at the instigation of the Port Authority in 2008 and now runs 80% of intra port rail operations with published tariffs following several years of complaints that the incumbent national infrastructure manager was unable to offer slots to new entrants. These coordination efforts have raised rail shares in Antwerp and Rotterdam although road and inland waterways dominate hinterland traffic (both ports are located at the mouths of large rivers connected to extensive canal networks). (ITF 2008). In Rotterdam 57% of container throughput was carried by road in 2008, 30% by inland waterways and 13% by rail. Target shares for 2035 are inland waterway 45%, road 35% and rail 20% (OECD 2010).
Northern European ports achieve these relatively high rail modal shares despite an
unfavourable economic and political geography that makes European railways very different from US freight railways: short average distances for hinterland carriage and fragmented railway operations, both the result of the relatively recent integration of Europe into a single market. National boundaries leave a legacy of railways with small markets, poor technical interoperability and different charging systems and uneven regulatory environments. Like Great Britain, railways in Belgium and the Netherlands are vertically separated and freight trains are charged only the avoidable costs they impose on the network, usually only marginal costs. This has the advantage of keeping tariffs low but is a disincentive for investment. Governments therefore make capital grants where policy seeks to shift trucks from road to rail.
Reconciling modal shift policies with financial sustainability for rail and sustainable fiscal policy (containing accumulation of public rail debt) is not always easy. This is illustrated by the Dutch government’s €4.7 billion investment in the Betuwe rail freight line opened in 2007 to link the port of Rotterdam with key industrial markets in Germany. The government was unable to attract private investment in the line (Koppenjan 2007), costs escalated and traffic has proved to be much lower than forecast despite charging only marginal costs for use of the line. The Dutch rail regulator determines the charges for using national infrastructure following principles set out by law requiring them to cover, inter alia, the marginal costs of track wear. Heavy trains hauled by powerful locomotives pay the highest charges as they account for the largest part of maintenance and renewal costs (Figure 6). Steel mills in the hinterland were one of the industries the Betuwe line was designed to serve but were unable to pay the infrastructure charges prescribed. Lowering the charges would have rapidly “bankrupted” the line. In the end the government felt obliged to provide operating subsidies to close the gap.
23 Figure 6. Rail infrastructure use charges in Europe
Note: For each country, the two columns to the left indicate high speed train charges (IC PH and IC
OP), the central bars are for conventional passenger trains and the bars to the right are for freight. Source : Vidaud M. & de Tilière G., 2010.
The Rotterdam Port authority also promotes rail development through specific modal split targets included in concession agreements, for example in the case of the Masvlaaakte II terminals (De Langen 2009). Rotterdam is Europe’s biggest port and it is not clear that all port authorities have the power to copy it. Such requirements might eliminate bidders from concessions opened for terminals in smaller ports. It also remains to be demonstrated that the modal split clause will be enforced.
In more favourable circumstances, rail operations are an area where private investment can be attracted to bid for concessions, and there is a solid literature on rail development by private interests (Resor and Laird 2013). One example is the Bombay Jawaharlal Port project where 30% of the 4.5 M TEU transported travel by rail following development of a dedicated freight corridor part financed with equity from users that allows double stacking and thus the transportation of 300 TEUs per train. “Favourable circumstances” in India include grossly inadequate road capacity. Nevertheless, national policies that cross subsidise passenger traffic with freight profits make it difficult to attract private investment away from the
dedicated freight corridors. There have, nevertheless, been a few public private partnerships where industrial plants close to ports have financed dedicated rail access.
At the roundtable, there was considerable discussion about the need for detailed assessment of the capacity for the rail route to San Antonio to take additional container traffic. To be sufficient to achieve an environmentally and socially acceptable rail/road distribution of container traffic from a much larger port, significant investment in track and signalling is likely to be required. The rail network serving San Antonio is for freight but volumes are currently limited on the line by the quality of the infrastructure. There are plans to introduce passenger services on part of the line. Containers are not the only freight carried; bulk products including sulphuric acid for copper mines in central Chile consume significant
capacity. A detailed appraisal of long term road and rail hinterland transport options and investment requirements is essential. Appraisal should include the potential to carry double-stacked containers, subject to the constraints of tunnel gauges. At Valparaiso, expansion of rail freight is almost impossible as the tracks are shared with the local metro/suburban train system. The existing rail link was converted to largely metropolitan passenger train use with an upgrade of the line that enclosed it in a tunnel with limited loading gauge. Major rail investment would appear necessary to serve a large new port development. Broad appraisal of hinterland transport options and impacts is essential.
4.3. Dry ports (inland ports)
Dry ports (inland ports) and extended gateways are being developed in many parts of the world in response to land-side port capacity constraints. As noted, Valparaiso has already developed a short range extended gateway with relocation of custom and sanitary inspection and a truck holding facility 5 km from the port. The ‘ZEAL’ project was developed to
overcome capacity shortage in the port terminal and resulted in an increase in productivity of 20%.
In Spain, the dry port of Madrid (Coslada) and Terminal Marítima de Zaragoza have extended the gateways of the major container ports of Barcelona, Valencia, Bilbao and Algeciras
(Monios 2011). In France, the inland Port of Lyon, a partnership initiated between the port of Marseille and the river port Edouard Herriot in Lyon provides handling, storage, packing, and inland transportation leasing and repair of containers, having a throughput of over 100 000 TEUs per year. European Container Terminals (ECT), the main terminal operator in the port of Rotterdam and a subsidiary of Hutchinson Port Holdings (HPH), has been actively involved in the setting up of Venlo in the Netherlands, Duisburg in Germany and Willebroek in Belgium all served by rail, to mitigate truck volumes creating congestion issues
(Wilmsmeier et al. 2013). In North America, there are many inland port examples. One example, the Savannah Port Authority Industrial Park (SPAIP), is a site specializing in satellite activities removing pressures from the container terminals of the dynamic port of Savannah, such as container and chassis storage and repair. About 10 km from the port terminals are two large logistics zones owned, like the port, by Georgia Port Authority. The Virginia Inland Port is served primarily by rail from the Hampton Roads port 350 km away and provides customs services, reloading and cross docking services. BNSF Logistics Park Chicago is another; it is a major inland port 60 km southwest of Chicago linked by
transcontinental rail tovarious ports, including Los Angeles/Long Beach to the Chicago hub (Rodrigue et al., 2010).
The dry port is a cargo consolidation center located away from the seaport but serving the cargo transported through it, providing sufficient economies of traffic density for viable shuttle services. As well as providing the space needed for land-side port processing tasks, it embeds the port more effectively in the supply chain, providing dedicated space for the development of integrated warehousing and distribution centres and ancillary value adding services. Location is important; proximity to major centres of demand is an advantage and siting at nodes in transport networks suited to extension or development of greenfield logistic centres essential. Coordination of container movements needs to be managed in the same way as at the port, with integrated information exchanges. Customs and sanitary inspections need to be transferred to the dry port or greatly simplified administrative and customs procedures introduced. There might be potential for establishing a dry port and logistics centre in the vicinity of Santiago, connected to the new port by rail.
25
4.4. Strategic Issues
Development of a major new port, tripling container handling capacity, on the central coast of Chile will stress hinterland transport infrastructure and result in congestion unless capital investment in road and rail links keeps pace with container traffic. Supply chains currently rely heavily on road transport and port development will require a long-term vision for highway investment. Plans for a new highway to Argentina need to be taken into account as this could generate significant port transit traffic. Trade facilitation measures could further increase traffic, such as joint customs and sanitary inspection at the border (single inspects by joint teams from both countries; also single inspections covering both customs and sanitary dimensions). Bilateral agreements to allow back-hauls can at the same time facilitate trade and reduce traffic and congestion.
Certain steps can be taken to counter potential hinterland congestion problems. Performance monitoring on the highways and railways will identify where bottlenecks develop. Cargo origins and destinations should be identified as a basis for planning development of the transport system. A strategic approach, covering road, rail and short sea shipping, should be taken rather than ad hoc responses to demand, and mechanisms for coordinating
investments with other industrial policy initiatives are valuable. These include transport impact assessment as part of planning procedures for commercial and industrial development and mobility plans for large municipal planning authorities. Central government requires such plans of city administrations in many countries. The logistics dimension of port capacity expansion is not a purely sectoral issue but requires coordination across government. The Ministry of Transport is aware that more detailed assessment of landside transport infrastructure demand and investment requirements deep into the hinterland of the prospective new ports is needed and has begun consultations with the Ministry of Public Works to ensure the necessary capacity is developed in time. It also recognizes the need for regulatory changes to existing cabotage law and customs procedures to enable inspections inland.