2019 IMEKO TC-4 International Conference on Metrology for Archaeology and Cultural Heritage Florence, Italy, December 4-6, 2019
MA-XRF measurement for corrosion assessment
on bronze artefacts
Lins, S.A.B.
1,2, Di Francia, E.
3, Grassini, S.
3, Gigante, G.E.
1, Ridolfi, S.
41
La Sapienza Università di Roma, Via Antonio Scarpa 14/16 – 00161, Rome, Italy,
sergio.lins@roma3.infn.it, giovanni.gigante@uniroma1.it
2
Surface Analysis Laboratory INFN Roma Tre, Via della Vasca Navale 84 – 00146, Rome, Italy
sergio.lins@roma3.infn.it
3
Politecnico di Torino, Corso Duca degli Abruzzi 24 – 10129, Turin, Italy,
elisabetta.difrancia@polito.it, sabrina.grassini@polito.it
4
Ars Mensurae, Via Vincenzo Comparini 101 – 00188, Rome, Italy,
stefano@arsmensurae.it
Abstract – In this study, an innovative portable macro
X-Ray Fluorescence (MA-XRF) scanner prototype has been employed in order to gain information on composition and distribution of corrosion products artificially grown on Cu-based coupons. First results have shown the importance of using artificially corroded reference samples before any assessment on archaeological artefacts. Moreover, the prototype used demonstrated to be a powerful tool for understanding complex corrosion processes which might occur on Cu-based alloys. The scanner was able to detect light elements as S and Cl, essential for studying the distribution of specific corrosion compounds. Using imaging techniques, it was possible to observe a gradient in Cu elemental maps intensity caused by the overlapping of a thicker corrosion product layer.
I. INTRODUCTION
When dealing with archaeological metallic artefacts, it is common to face heavily corroded samples, sometimes with indistinguishable shapes with respect to what they should have originally been. This can be due to very complex corrosion mechanism that might occur on Cu-based ancient artefacts buried in soil: the corrosion mechanisms can lead to the formation of multilayer stratified structures [1][2]. In this scenario, it is interesting to understand structure [1], morphology and composition of the corroded layers overlaying the artefact in order to establish proper restoration and conservation protocols [3] and to monitor the environment to prevent any further corrosion [4].
The corrosion products layers on Cu-based alloys are generally composed of a thin layer of cuprite (Cu2O) grew
directly in contact with the metal and that protects the metal itself. On this protective layer (noble patina), several dangerous/unwanted corrosion products can grow due to
the interactions of the artefacts with the nearby elements present in the soil. Aggressive environments often contain Cl- ions that can cause the so-called bronze disease, a
reactive and cyclical corrosion mechanism [1][5][6][7]. Moreover, the corrosion layers are part of the artefact’s history, serving as a witness of the authenticity and even of the characteristics of the environment where the object was buried [3][8]. For these reasons, it is convenient to study the corroded layers prior their removal.
Since non-destructive approaches are always preferred when it comes to archaeological samples, X-ray Fluorescence (XRF) is a common choice when dealing with such objects [9][10][11][12]. It is non-destructive and also easy to use and portable. Although XRF can shed light on the alloy’s composition and, more recently, on the corrosion products compositions when combined with Monte Carlo simulations [13], it still yields punctual results, i.e. one can only know the characteristics of few millimetre-wide spots out of the total surface area of the object. In addition to this, in the past few years, macro X-Ray Fluorescence (MA-XRF) has been extensively used to
study paintings, frescoes and stained glasses
[14][15][16][17][18]. MA-XRF has the obvious advantage over traditional XRF of yielding an immediate and visual interpretation of the spatial distribution of chemical elements. This advantage can be fully explored in the study of inhomogeneous samples, as it is the case of some corroded bronzes and other metallic archaeological artefacts. Nonetheless, commercially available MA-XRF instruments are cumbersome, expensive (being more of a mobile instrument than a portable one) and generally comes with a “closed” software, i.e. the user hardly knows the underlying methods used to generate the elemental maps.
In this study, a portable MA-XRF scanner prototype built by the Istituto Nazionale di Fisica Nucleare (INFN)
– Roma TRE division and Ars Mensurae has been used in
artificially-corroded Cu-based coupons simulating complex archaeological corroded layers. Reference samples have been chosen in order to perform the screening analyses of the prototype on more reproducible and controlled samples. The instrument uses a custom-made data analysis software tuned for the analysis of low-signal and noisy data.
Testing this equipment on controlled samples is of fundamental importance for knowing where to improve and its limitations in respect to traditional instruments and prior its use on real archaeological samples.
II. MATERIALS AND SYSTEM
A.Materials
The study has been performed on Cu 99.96 wt%, reference coupons (45 × 15 × 5 mm3). The specimens were
polished with 500 to 4000 grid SiC paper, rinsed in ethanol in ultrasonic bath for 5 min, and well dried. Then, two kind of artificial corrosion layers have been produced by chemical synthesis (Fig. 1): a set of samples (sulphate sample) was created by immersion in a 0.1 M Na2SO4
solution for three months at room temperature in order to obtain a sulphate corrosion layer. The other set of samples (CW sample) was created by immersion in a Corrosive Water solution (CW, 2.8∙10-2 M NaCl, 0.01 M Na
2SO4,
16.1∙10-2 M NaHCO
3), that is an ASTM D1384 solution
modified by Constantinides [2], for 7 months at room temperature in order to obtain a complex corroded layer. Both solutions were neither stirred nor aerated by bubbling.
B.MA-XRF Scanning System
The MA-XRF prototype employed is composed of a x-y
motorized stage with a sample holder and a detachable scanning head. The head comprises a low-power Ta-target Moxtek® X-ray tube collimated to roughly 2 mm and a lightweight 123SDD detector from AMPTEK® with a 125 eV resolution at Mn Kα emission line. The scanning head remains fixed while the sample is translated by the stage. The maximum step resolution is of 100 μm and the
format adopted is vertical, i.e. the sample is moved in a vertical plane. The system is controlled by a custom-made interface programmed in LabView™ with a near-live display of the counts (intensity) map.
An earlier version of the prototype system had been previously used to study archaeological painted and gilded leathers [19].
C.Characterisation techniques
High resolution digital photographs were taken by a digital camera (4000 × 3000 pixel2, Panasonic Lumix G2)
equipped by a stand with a 3000 K lamp.
Roughness evaluations were performed on profilers acquired by means of a Sensofar PLµ 2300 confocal microscope (CM) using a 20x objective. The images were processed in the free Octave software and surface standard deviation were computed on about 100,000 points, which compose the confocal pictures.
Elemental distribution maps of the samples surface were generated by the custom data analysis software. The system was optimized to work with low-signal and noisy data and embedded with a series of filters: average/low-pass, average/threshold and 3 × 3 iterative smoothening filter. The data was collected by the MA-XRF scanning system described above with a step resolution of 1 mm, dwell-time of 5 seconds and a total mapped area of 43 × 13 mm2, covering the whole area of the copper
reference samples. The tube voltage was set at 35 KV and the current at 17 μA. Each analysis took about 54 minutes.
III. DISCUSSION
Fig. 2 shows, as an example, the confocal microscope images acquired on some of the copper reference samples. The CW sample presents a quite smooth surface structure with a standard deviation of about 2.7 μm; the sulphate sample instead presents a more heterogeneous morphology with surface roughness values of about 6.1 μm.
The roughness can be one of the major geometrical variables that affect the scanner performance, therefore a comparison of roughness and the sum map can show the presence of a geometrical factor that can create a sort of distortion on the scanner response. If the statistics are enough, one can hypothesize using an elemental map image as a mask to account for any roughness contribution to the final images.
Fig. 2. Confocal microscope images of the CW (left) and sulphate (right) corroded layers. Fig. 1. Artificially corroded layers: CW (left) and
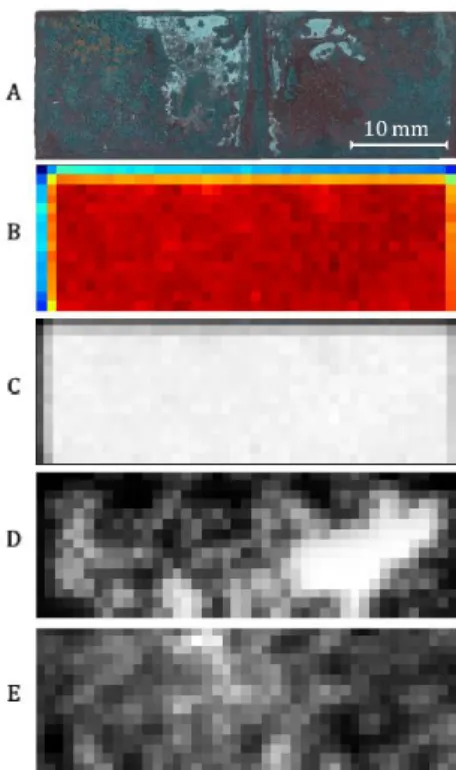
In fact, when applying an average-threshold filter to the copper maps one can observe a certain gradient in the intensity values. The reasons can be three-fold: the formation of a variable-in thickness corrosion layer which attenuates (proportionally to its thickness) the signal from the copper atoms underneath or a selective/preferential corrosion of copper atoms or lastly a distortion caused merely by the surface’s roughness. Carefully inspecting the elemental maps of copper and sulphur from the sulphate sample and the sample’s aspect (Fig. 3), it is reasonable that what caused a gradient in the copper intensity values in this sample is the presence of a thicker corrosion product area (lighter area, Fig. 3A) in the upper part of the sample surface.
The corrosion product layer thickness can vary greatly, and it depends on the nature of the products present and the alloy. As an approximation, its thickness can vary from 40 to 138 μm in the case of tin bronzes and from 14 to 146 μm in the case of quaternary bronzes [20]. Therefore, it is unlikely that, in this case, roughness would cause any significant distortion in the elemental distribution maps.
Concerning the corrosion components distribution across the sample surface, the chemical elements identified are either sulphur or chlorine (since carbon and oxygen cannot be detected by the instrument): being light (low Z) atoms, their counts statistics is considerably low (Fig. 4).
Nonetheless, sulphur was detected across the sulphate sample’s surface (as expected) and formed a seemingly gradient that spreads from the upper-middle portion towards the lower region (Fig. 3E). Chlorine could not be detected due to its significantly lower counts and signal contamination from the sample holder (made of polyvinyl-chloride). Whereas for the CW sample, sulphur could not be detected, and chlorine could be mapped only when applying a low-pass filter to the elemental distribution map cutting off a portion of the contamination signal coming from the sample holder in the bottom right part (Fig. 5E).
Fig. 3. Sulphate sample surface (A) and scans: (B) sum map, (C) copper map, (D) filtered copper map
and (E) sulphur map.
Fig. 5. CW sample surface (A) and scans: (B) sum map, (C) copper map, (D) filtered copper map and
(E) chlorine map.
Fig. 4. Sum spectra comparison of samples sulphate and CW. Arrows point to S-Kα and Cl-Kα lines.
Differently from what was observed in the sulphate sample, the corrosion products distribution did not follow any specific “macro” pattern, nor did the copper distribution map shown any gradient (Fig. 5). The reason may be the distribution of chlorine and the corrosion products formation process. Constantinides et al. [2] demonstrated through artificially corroded Cu-alloys that chlorine is preferably deposited in an inner layer, in between the alloy’s bulk and the outer corrosion layer. This preferential deposition is created by a mechanism originating from mechanical stress or chemical reaction, where cracking occurs in the surface and promotes pitting corrosion. This process causes a further dissolution of the alloy, producing more Cu+ cations which reacts with Cl
-anions present in the solution, as a result CuCl and CuCl2
are formed and built up in an internal layer to the corrosion surface. Even though the formation of chlorine compounds is propelled in this mechanism, the net weight concentration of chlorine is still relatively low (when compared to the alloying elements concentration and the system detection limit), commonly about 2 wt%. Moreover, considering that chlorine is deposited underneath a Cu-oxide layer, its detection by the MA-XRF system is further hindered by attenuation effects.
IV. CONCLUSION
In this preliminary study, the MA-XRF scanner revealed to be a powerful tool for understanding composition, structure and topography of Cu-based corrosion products. The detection of light elements as sulphur and chlorine and in low quantities usually requires more sophisticated and expensive apparel. Being able to map those elements with a low cost portable MA-XRF scanner further highlights the power of the instrument.
The use of artificially-corroded samples to test the prototype allows to perform the screening analyses on reproducible and, more controllable, corrosion products layers.
Moreover, the use of imaging techniques allowed to understand or at least hypothesize about the corrosion stratigraphy, through identifying a gradient in the copper signal intensity and combining it with the elemental distribution of corrosion-related elements.
Future developments of this research will be focused in the application of this innovative prototype on complex and stratified corrosion layers, as the ones found in Cu-based archaeological artefacts buried in soil for centuries.
FUNDING
This project has received funding from European Union's Horizon 2020 research and innovation program under Marie Skłodowska-Curie Actions Innovative Training Networks grant agreement N. 766311.
REFERENCES
[1] L.Robbiola, J.-M.Blengino, C.Fiaud, “Morphology
and mechanisms of formation of natural patinas on archaeological Cu–Sn alloys”, Corrosion Science, vol. 40, No.12, 1998, pp.2083–2111.
[2] I.Constantinides, A.Adriaens, F.Adams, “Surface
characterization of artificial corrosion layers on copper alloy reference materials”, Applied Surface Science, vol.189:1-2, 2002, pp.90–101.
[3] D.A.Scott, “Copper and bronze in art: corrosion, colorants, conservation”, 1st Edition, Getty publications, 2002.
[4] S.Grassini, E.Di Francia, E.Angelini, A.Elsayed,
M.Parvis, J.A.Mejia Gomez, “In situ EIS measurements on Colombian bronze statues”, Proc. of IMEKO International Conference on Metrology for Archaeology and Cultural Heritage, 2017, pp.287-290.
[5] M.C.Bernard, S.Joiret. “Understanding corrosion of
ancient metals for the conservation of cultural heritage”, Electrochimica Acta, 54-22, 2009, pp.5199-5205.
[6] E.Sidot et al., “Study of the corrosion behaviour of
Cu-10Sn bronze in aerated Na2SO4 aqueous solution”,
Corrosion Science, vol.48-8, 2006, pp.2241-2257.
[7] E.Di Francia, R.Lahoz, D.Neff, E.Angelini,
S.Grassini, “Laser cleaning of Cu-based artefacts: laser-corrosion products interaction”, Acta IMEKO, vol.7, No.3, article 16, 2018, pp.104-110.
[8] L.Selwyn, “Metals and corrosion: a handbook for the
conservation professional”, 1st Edition, Canadian Conservation Institute, 2004.
[9] M.Guerra, “The study of the characterization and provenance of coins and other metalwork using XRF, PIXE and Activation Analysis”, Radiation in art and Archeometry, 2000, pp.378-416.
[10] G.Buccolieri, A.Buccolieri, P.Donati, M.Marabeli, A.Castellano, “Portable EDXRF investigation of the patinas on the Riace Bronzes”, Nuclear Instruments and Methods in Physics Research Section B: Beam Interactions with Materials and Atoms, vol.343, 2015, pp.101-109.
[11] S.Ridolfi, M.Laurenzi Tabasso, A.Askari Chaverdi, P.Callieri, “The Finishing Technique of the Stone Monuments of Persepolis: Further Studies and New Findings Through the Use of Non-Destructive Analytical Techniques”, Archaeometry, 2019, pp.271-281.
[12] S.Ridolfi, “Gilded copper studied by non-destructive energy-dispersive X-ray fluorescence”, Insight - Non-Destructive Testing and Condition Monitoring, vol.60, No.1, 2018, pp.37-41.
[13] A.Brunetti, J.Fabian, C.W.La Torre, N.Schiavon, “A
combined XRF/Monte Carlo simulation study of multilayered Peruvian metal artifacts from the tomb of the Priestess of Chornancap”, Applied Physics
A., vol.122, No.6, 2016, pp.571.
[14] D.Howard, M.De Jonge, D Lau, D.Hay,
M.Varcoe-Cocks, C.Ryan, R.Kirkham, G.Moorhead,
D.Paterson, D.Thurrowgood, “High-definition X-ray fluorescence elemental mapping of paintings”, Analytical Chemistry, vol.84, No.7, 2012, pp.3278-3286.
[15] M.Alfeld, M.Mulliez, J.Devogelaere, L.De Viguerie,
P.Jockey, P.Walter, “MA-XRF and hyperspectral reflectance imaging for visualizing traces of antique polychromy on the Frieze of the Siphnian Treasury”, Microchemical Journal, vol.141, 2018, pp.395-403.
[16] R.Cesareo, S.Ridolfi, A.Brunetti, R.T.Lopes,
G.E.Gigante, “First results on the use of a EDXRF scanner for 3D imaging of paintings”, Acta IMEKO, vol.7, No.3, 2018, pp.8-12.
[17] A.Galli, M.Caccia, R.Alberti, L.Bonizzoni, N.Aresi,
T.Frizzi, L.Bombelli, M.Gironda, M.Martini,
“Discovering the material palette of the artist: ap‐ XRF stratigraphic study of the Giotto panel ‘God the Father with Angels’”, X‐Ray Spectrometry, vol.46, No.5, 2017, pp.435-441.
[18] G.Van der Snickt, S.Legrand, J.Caen, F.Vanmeert, M.Alfeld, K.Janssens, “Chemical imaging of stained-glass windows by means of macro X-ray fluorescence (MA-XRF) scanning”, Microchemical Journal, vol.124, 2016, pp.615-622.
[19] M.Iorio, V.Graziani, S.Lins, S.Ridolfi, P.Branchini, A.Fabbri, G.Ingo, G.Di Carlo, L.Tortora, “Exploring Manufacturing Process and Degradation Products of Gilt and Painted Leather”, Applied Sciences, vol.9, No.15, 2019.
[20] H.W.Nørgaard, “Portable XRF on Prehistoric Bronze
Artefacts: Limitations and Use for the Detection of Bronze Age Metal Workshops”, Open Archaeology, vol.3, No.1, 2017, pp.101-122.