PRIVATELY FINANCING INTERMODAL
EXCHANGE STATIONS IN MADRID
Floridea Di Ciommo, Research Fellow Transport Research Centre (TRANSYT)
Universidad Politécnica de Madrid, +34 91 3365259,
[email protected]
José Manuel Vassallo, Associate Professor Transport Research Centre
(TRANSYT), Universidad Politécnica de Madrid, +34 91 3366655,
[email protected]
Pedro Saldaña, Research Assistant Transport Research Centre TRANSyT,
Universidad Politécnica de Madrid, +34 91 3366708,
[email protected]
ABSTRACT
The City of Madrid is putting into operation Intermodal Exchange Stations (IESs) to make connections between urban and suburban transportation modes easier for users of public transport. We find that through the construction of an IES by a concessionaire it is indeed possible to arrive to solutions for the funding of urban transport infrastructure in which private profit and social benefit converge. Commuters save travel time and use better their transfer time. Bus companies diminish their costs of operation. The concessionaire receives revenues generated mainly by fees that urban buses (EMT), regional buses and interregional coaches—also privately operated—pay for using the IES, and by the commercial rents paid by shops and cafeterias inside the IES. The abutters gain in quality of life, society in general benefits from a reduction of emissions, and the government is able to promote these infrastructure facilities without recurring to its scarce budgetary resources.
Keywords: Urban transportation, modal exchange, concessionaires, private and social savings.
INTRODUCTION
Due to both urban sprawl and the growth of motorization ratios—Madrid has increased this ration by 20% in 10 years—a large number of cities in the world are experiencing an increasing use of the private cars. To curb this trend, many authorities are adopting measures to promote the use of public transportation. Those measures consist mostly in increasing the supply of public transportation through investing in new infrastructure, and improving the quality of service. However, budgetary constraints are often an important obstacle to these undertakings.
The city of Madrid has been a pioneer in the last few years in the adoption of measures intended to promote public transportation use (Vassallo et al. 2009). One of the most important measures has been the construction of Intermodal Exchange Stations (IESs) to facilitate the links among different public transportation modes, particularly the connection of metropolitan bus services to the subway system. This paper describes and assesses a new and original practice, conducted by the Regional Government of Madrid, consisting of privately funding IESs through concession contracts with the private sector.
The objective of this paper is to show, with the case study of IESs in Madrid, that it is possible to fund transport infrastructure in urban areas without public subsidies and all the stakeholders involved (users, transport operators, infrastructure concessionaires, abutters, and the government) ultimately gain.
The paper is divided into four sections. The first section—after the introduction— provides an overview of the characteristics of the IESs in the transportation system of the Madrid Metropolitan Area (MMA), and explains how the concession approach was introduced to fund IESs in Madrid with only private capital. The second section establishes a methodology to evaluate the social and private benefits on the different stakeholders stemming from the implementation of the IES. The third section provides an application of the methodology defined before to the case study of the Avenida de America IES. The fourth section contains the paper’s conclusions.
The most interesting result of this paper is that the construction of IESs yields important social benefits to all the stakeholders involved so it may accurately be described as a win-win outcome. The commuters see how their travel times are reduced and their waiting times are better used; the bus companies diminish their operation costs; the abutters gain in quality of life by the urban regeneration projects; the community benefit from a reduction of the emissions; and the regional government is able to promote that without spending additional sums.
WHY INTERMODAL EXCHANGE STATIONS IN MADRID’S
METROPOLITAN AREA?
Public Transport supply in MMA
Six million inhabitants live in the Madrid Metropolitan Area (MMA), in an area of 8,000 square km with an average population density of 7.42 inhabitants/hectare. The GDP per capita of the MMA is 30% above the average of the European Union. The MMA
used to be made up of a single compact center, Madrid City. However, in the last three decades, loosely connected conurbations have been expanding at a far more rapid rate than that of the population. Consequently, the population in the MMA has been relentlessly spreading out. The City Center still has a high population density, that decreases as one moves away to the municipalities on the periphery of the MMA. In the MMA the car ownership rate is almost 700 per 1,000 inhabitants, which is the highest motorization rate among the Spanish regions. The phenomenon of the suburbanization of both residence and employment along with the increase of car ownership is prompting new transportation trends in the MMA (Monzón et al. 2007). The mobility survey for the MMA shows that from 1996 to 2004 the number of mechanized trips increased by 52%, whereas the population increased only by 14% (Vassallo at al. 2009). It is worth noting how the relationships between the City Centre and the peripheral zones of the MMA are the only origin-destination pairs in the MMA where the public transportation market share has increased in the last eight years
The public transport system in the MMA is made up of four modes. Two of them are the typical urban modes (subway and urban buses), and the other two are mostly metropolitan modes (commuter rail and metropolitan buses). The market share for each public transportation mode is: subway 40.6%, urban bus 29.5%, metropolitan bus 17.3% and metropolitan railway 12.6%.
A key element of the public transportation supply in the MMA is its integrated policy. The first level of integration is the institutional (Di Ciommo 2002). The integration of the different public authorities involved in the transport system was reached through the creation, in 1985, of a new public entity called “Consorcio Regional de Transportes de Madrid” (CRTM) aimed at coordinating metropolitan transportation policies in the MMA. The second level of integration took place in the fare structure. To this end, a monthly flat fare valid for all the public transport modes in the Region of Madrid was established. The third level of integration was the physical integration among transport modes. Since the creation of the CRTM, large infrastructure investments have been made to improve the physical connection among modes through the construction of intermodal exchange stations (IESs). These facilities have greatly contributed to improving coordination among the different transportation modes.
What is an Intermodal Exchange Station?
Madrid City Center is mostly connected to the suburbs through several radial highways which, once the boundaries defining the MMA have been crossed, continue to link Madrid with the main cities of Spain on the coast. Most of the metropolitan buses use these radial highways to bring commuters from the suburbs and satellite cities to the City Center. Once in Madrid City Center, most of the commuters take the metro system or the urban buses to get to their work.
An Intermodal Exchange Station (IES) consists of a subterranean building, made up of several stories, that facilitates the modal transfer of commuters coming from the suburbs in metropolitan buses to both the subway and urban bus networks. Some IESs connect also to the commuter rail network, and some others are designed to receive interregional coaches as well. The IESs have escalators and elevators connecting the different floors. Moreover a set of signs are strategically located to guide the users. The IESs has some space available for transportation services, but also for shops and restaurants. Adjacent to this building an access tunnel or a segregated lane is built to
Sometimes, the construction of an IES also may include the construction of underground multi-story public parking garages.
Owing to this, it was decided to locate the IESs at the intersections of the radial highways with Madrid’s heaviest trafficked circular line (line 6) of the subway system. This is often the point where the first set of traffic lights is located and long lines of vehicles form during the peak hours. Some of the main criteria considered in planning the construction of particular IESs have been the following: its strategic location; the reduction of pedestrian connections between a mode of transport and another; the information systems implemented, especially travel and ticketing information (Grotenhuis et al. 2007); the security measures; the quality of the air and comfort inside of the IES; and finally, the supply of complementary services, such as shops and restaurants, that make the transfer time more pleasant for the commuters (Cristobal and Aldecoa 2002).
The concession procedure to fund IESs in Madrid
Many governments are facing increasing challenges to fund public transport infrastructure with scarce budgetary resources (Mayer 2007). To meet this funding gap, policy makers are turning to mechanisms aimed at involving the private sector in managing and financing new and existing infrastructure. Perhaps the most popular mechanism is the concession approach, which consists of transferring responsibility for construction, maintenance, and operation of the infrastructure to a private consortium, in exchange for a user fee that is valid a limited period of time, fixed or variable, but contractually agreed upon in advance (Vassallo and Gallego 2005).
Spain has long experience in financing other kinds of infrastructure through concession contracts. The Spanish concession law is applicable to every type of public works, including the construction of IESs. The first IES in Madrid, Moncloa, built in 1995, was publicly funded. The success of this exchange station was noteworthy since the construction of a tunnel that avoided congestion in the access highway to Madrid City Center, along with a noticeable improvement in the connections among different public transport modes, led to an increase in demand for public transport in the corridor of more than 30% in only few years, which subsequently brought about a reduction in the use of the private car.
Due to this success, the Regional Government of Madrid intended to undertake the construction of a new IES in Avenida de América, at the entrance to Madrid from the A-2 highway, which experiences heavy traffic in the peak hours. However, at that time, the Regional Government of Madrid did not have enough budgetary resources available since costly plans for developing the subway network were just then being put into effect. Owing to this constraint, the Regional Government of Madrid decided to use the concession approach to fund this IES.
The Regional Government of Madrid entrusted the CTRM with the preparation of the bidding terms and the subsequent contracts. Although the concession approach had a long tradition in Spain, this attempt was a real challenge for the CRTM for two reasons. First, the CRTM did not have any experience with infrastructure concession contracts, and second, the concession approach had never been used before to fund IESs in any city of the world. Regardless of this, in 1998 the CTRM launched the Avenida de America concession tender that was awarded in 2000. One of the requirements imposed by the CRTM to the bidders was the necessary implication of any coach
operator in the concession consortium to promote the use of the IES by interregional coaches since they were not obliged to use this infrastructure. The concession was awarded to a consortium made up of two big construction firms (ACS and Ferrovial), two private bus companies (Continental Auto and Trapsa), and one bank (Argentaria), which has been recently merged with BBVA.
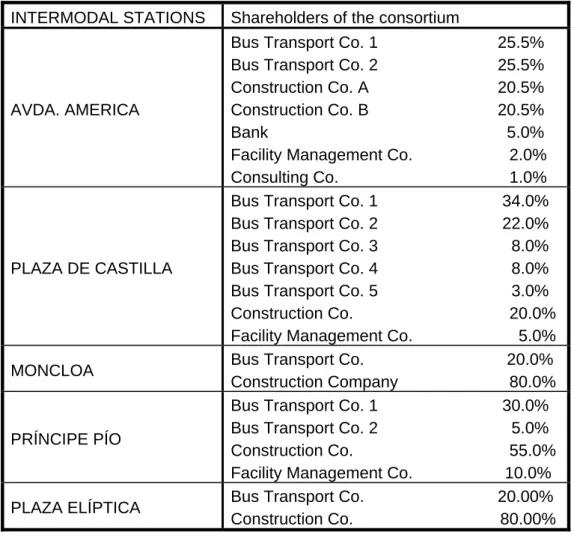
Table 1. Shareholders of the IESs consortium
INTERMODAL STATIONS Shareholders of the consortium
AVDA. AMERICA
Bus Transport Co. 1 25.5% Bus Transport Co. 2 25.5% Construction Co. A 20.5% Construction Co. B 20.5% Bank 5.0% Facility Management Co. 2.0% Consulting Co. 1.0%
PLAZA DE CASTILLA
Bus Transport Co. 1 34.0% Bus Transport Co. 2 22.0% Bus Transport Co. 3 8.0% Bus Transport Co. 4 8.0% Bus Transport Co. 5 3.0% Construction Co. 20.0% Facility Management Co. 5.0%
MONCLOA Bus Transport Co. 20.0% Construction Company 80.0%
PRÍNCIPE PÍO
Bus Transport Co. 1 30.0% Bus Transport Co. 2 5.0% Construction Co. 55.0% Facility Management Co. 10.0%
PLAZA ELÍPTICA Bus Transport Co. 20.00% Construction Co. 80.00%
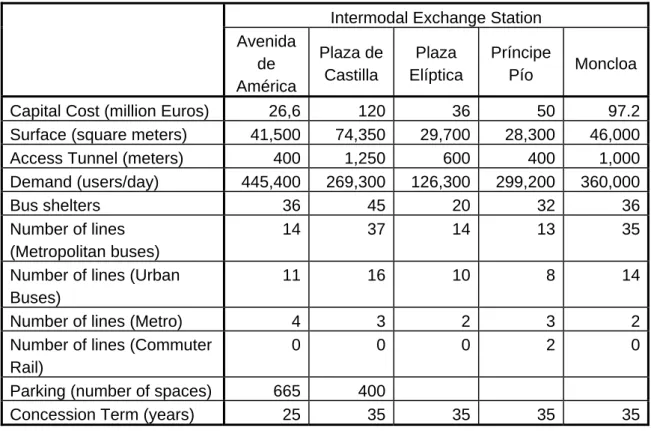
For several reasons, the experience with the Avenida de America proved successful. First, public transport usage in the corridor increased substantially within only a few years. And second, the Avenida of America IES was fully funded by the private sector without requiring any public subsidy. Owing to this success, the Regional Government of Madrid decided to undertake a master plan for the construction, maintenance and operation of several IESs during the period 2004-2007. This master plan underlies all three of the new IESs built in Madrid: Plaza Eliptica, Plaza de Castilla and Príncipe Pío, as well as the upgrade and expansion of the Moncloa IES whose first phase was built in 1995. Those IESs have recently started operation. Table 2 shows a summary of the main characteristics of the IESs developed in Madrid under the concession mechanism.
Table 2 – Main characteristics of the IESs in Madrid
Intermodal Exchange Station Avenida de América Plaza de Castilla Plaza Elíptica Príncipe Pío Moncloa
Capital Cost (million Euros) 26,6 120 36 50 97.2 Surface (square meters) 41,500 74,350 29,700 28,300 46,000 Access Tunnel (meters) 400 1,250 600 400 1,000 Demand (users/day) 445,400 269,300 126,300 299,200 360,000
Bus shelters 36 45 20 32 36
Number of lines (Metropolitan buses)
14 37 14 13 35
Number of lines (Urban Buses)
11 16 10 8 14
Number of lines (Metro) 4 3 2 3 2 Number of lines (Commuter
Rail)
0 0 0 2 0
Parking (number of spaces) 665 400
Concession Term (years) 25 35 35 35 35
The Intermodal Exchange Stations have all been able to raise enough money so as to be funded solely by means of private capital through the concession approach. Consequently, the Regional Government of Madrid was able to promote this infrastructure without committing any additional budgetary resources.
The revenues generated by the IESs are of several types. The most important source of revenue comes from the fees that metropolitan buses—which are operated by private companies—and urban buses—which are operated by the public company called EMT—have to pay to the concessionaire to use the IES. The fees for urban and metropolitan buses are to be paid by the bus operators to the concessionaire according to the number of passengers that get on and off each bus at the particular IES. Consequently, the greater the number of users, the larger will be the payment by the bus companies to the concessionaire.
Although the fees paid by transportation operators are the most important revenue sources for the concessionaire, there are other revenue sources that contribute to fund the IESs. The most important ones are the commercial rents paid by shops and cafeterias inside the IES, the parking rents paid by cars when the IES includes a public parking area, and other revenues such as the rents obtained by advertising, vending machines and so on. In some cases these additional sources can be a very significant source of financing for the IESs.
The share of the different revenue sources depends on the specific characteristics of each intermodal station. In the Avenida de America IES, 55% of the revenues are obtained from transport operators, 33% come from the commercial rents (shops, advertisements, vending machines and so on) and 12% from the parking area. However, in the Moncloa IES, 84% of the revenues come from transport operators and only 16% come from commercial rents. The commercial rents are the more variable
ones since they depend on the commercial potentiality of the IESs. As a rule of thumb, the CRTM establishes that the commercial rent per square meter is around €50 a month. The promotion of commercial activities prompts substantial advantages for the users. First, their stay in the IES becomes more pleasant. And second, they can take advantage of the waiting time to carry out other activities (DeSerpa, 1971; Mackie, Jara Díaz and Fowkes, 2001).
SOCIAL AND PRIVATE BENEFITS OF THE INTERMODAL
EXCHANGE STATIONS
In order to evaluate whether the implementation of IESs in Madrid constitutes an adequate urban transportation policy, it is necessary to assess the effects of the IESs on all the various stakeholders affected by them. We identify the following stakeholders: users, transportation operators, abutters and other citizens, IES concessionaires, and the government. Below, we analyze how the utility for each of the stakeholders change with the implementation of an IES.
Effect on the Users
Most of the users of the IESs are people who commute everyday from the suburbs of the MMA to Madrid City. To that end, they first take a metropolitan bus and once they have arrived in Madrid City, they transfer to the subway or to the urban buses. The IESs reduce the travel time of these users in four different ways. First, the access tunnel and the special bus lanes designed to segregate the buses from the regular traffic help the buses to avoid peak hour congestion, so travel times are reduced. Second, as travel times are reduced, additional use of public transportation is encouraged and, consequently, the bus frequency has to be raised to meet an ever-rising demand. As a consequence of the higher frequency of buses, users reduce their waiting times at the bus stops. This fosters an even greater use of the metropolitan buses and the whole public transportation system (Jara-Diaz et al. 2008). Third, the modal transfer time for the users is reduced since, thanks to the IES, users do not have to cross any street and the signs available inside the IES facilitate the modal connection. Fourth, users can make use of the waiting time for other activities such as going shopping, which makes the transfer time more pleasant and useful. The time spent in the IES can be used to conduct some daily activities like buying food, or visiting the bank or post office. This way, the IES becomes a multi services platform where the waiting time can be usefully spent.
The effect of a better use of the waiting time in the IES is linked to both the release of time, which can be used for other activities; and the disutility reduction linked to a more pleasant stay inside the IES. If users can utilize the waiting time for leisure activities, like shopping, their utility will be increased because the individual would reassign time from less to more valuable activities. Consequently, increasing the commercial activities inside the IES implies not only a rise of revenues for the concessionaire, but also a growth in the user utility, which means a social benefit.
Figure 1 illustrates the benefits that the construction of an IES produces in the commuters. The advantages described above improve the quality of the trip so the demand curve rises from Db to Da (the subscript b refers to the scenario before the IES and the subscript a refers to the scenario after IES). As the price p, that charged by the transportation companies to the users, remains the same before and after the construction of the IES, the benefit for the users (consumer surplus) will be given by the shaded area in Figure 1.
Price Da Db p qa qb Q
Figure 1. Benefits produced on the users for the construction of the IES
This area is calculated according to the following equation:
[
]
∫
[
]
∫
−
⋅
+
−
⋅
=
a b b q q a q b a UD
q
D
q
dQ
D
q
p
dq
B
(
)
(
)
(
)
0 1) Where:Db(q) Demand curve before the construction of the IES Da(q) Demand curve after the construction of the IES q Flow of passengers in the line
p Price charged to the users
qb Flow of passengers in the line before the construction of the IES qa Flow of passengers in the line after the construction of the IES
There are several transportation operators affected by the construction of an IES: metropolitan buses, urban buses, commuter rail and the subway. The two most important transportation modes in an IES are the metropolitan bus companies and the subway, because most of the users transfer for one of these modes to the other. In this section, we focus first on the case of metropolitan buses, which is the mode that is most affected, and then we deal with the other transportation modes.
Savings in travel time also implies important cost reductions for bus companies (Jara-Diaz, 2007). The construction of the tunnel—beginning at a point of the access highway and debouching into the IES—enables metropolitan buses to realize significant time savings. This tunnel, adjacent to the IES, helps the buses to avoid the congestion caused by vehicles at the first set of traffic lights in entering the city. As a consequence, the operation costs of metropolitan bus companies are reduced because the travel time reduction means that fewer buses are required to provide the same frequency of bus service to meet a certain passenger demand. Fewer buses also mean fewer drivers.
However, as has already been mentioned, it is expected that travel time savings will create a greater demand for use of metropolitan buses by consumers, so the frequency of such bus service will have to be increased. In this case, even though the average cost per user will be substantially reduced for reasons that will be discussed below, additional buses would be required to meet the higher demand, so total transport costs will not necessarily be reduced and they might even increase.
Direct costs related to bus operation can be divided between those costs depending on the kilometers effectively run by the fleet, and those costs depending on the operation time of the fleet (hours effectively driven). For instance, the wages of the drivers will depend on the number of hours they drive whereas the depreciation of the buses and the fuel consumptions will be related to the number of kilometers actually travelled by the bus fleet.
The number of buses necessary to meet a certain demand of users is estimated according to the following equation:
L
V
S
q
n
⋅
2
⋅
=
(2)
where:
n Number of buses needed to serve a flow of passengers q
q Flow of passengers in the line (passengers/hour)
S Capacity of the buses (passengers/bus)
V Average speed of the bus in the cycle route (Km/hour)
The total cost of the bus operators per hour can be calculated according to equation 3:
V
n
c
n
c
a
C
T=
+
t⋅
+
l⋅
⋅
(3)
where:
CT Total cost per hour (€/hour) a Indirect costs (€/hour)
ct Direct cost per time unit (€/hour×bus) cl Direct cost per length unit (€/km×bus) n Number of buses in the fleet
V Averagespeed in the line (km/hour)
Introducing equation 2 in equation 3 it is easy to obtain equation 4:
⎥⎦ ⎤ ⎢⎣ ⎡ + ⋅ ⋅ + = l t T c V c S q L a C 2
(4)
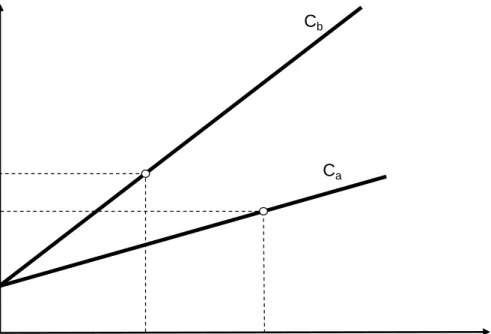
This equation shows how the total cost CT linearly increases with the flow of passengers q to be served by the bus company. However, for the same flow of passengers q, the higher the average speed in the line the lower will be the total cost. This is because the higher the average speed the smaller the fleet will be. For this reason, the CT curve—after the IES has been built—will be less steep than before. This effect is shown graphically in Figure 2.
CT Cb qa qb Q Ca Cb(qb) Ca(qa)
Figure 2. Total cost of the bus operators before and after the construction of the IES
From equation 3 is easy to estimate the average cost (ac) (see equation 5) and the marginal cost (mc) (see equation 6). The average cost (ac) decreases with q. The marginal cost (mc) is constant with q, but for a specific value of q it decreases with the average speed V. In other words, the increase of the average speed implies a greater efficiency of the bus company.
⎥⎦ ⎤ ⎢⎣ ⎡ + ⋅ + = = T t cl V c S L q a q C ac 2
(5)
⎥⎦ ⎤ ⎢⎣ ⎡ + ⋅ = = l t T c V c S L dq dC mc 2
(6)
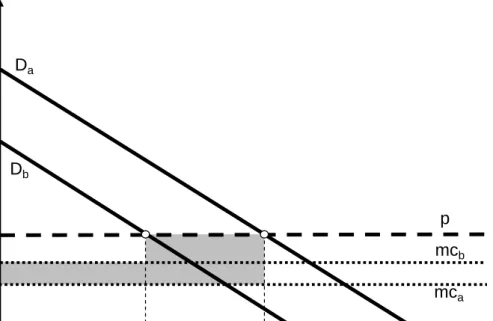
The surplus gained by the metropolitan bus companies if they had not been required to pay a fee for using the IES would be represented by the shaded area of Figure 3. The surplus can be easily calculated as
(
mc
b−
mc
a)
⋅
q
b−
(
p
−
mc
a) (
⋅
q
a−
q
b)
.Price Da Db p qa qb Q mcb mca mc
Figure 3. Surplus for the bus operators before and after the construction of the IES
However, the metropolitan buses have to pay to the IES an amount equal to the bus passengers who get on and off the bus at the IES multiplied by the IES fee. The surplus or benefit of the metropolitan bus companies BO is consequently calculated according to equation 7.
(
)
(
) (
)
[
mc
mc
q
p
mc
q
q
]
q
w
B
O=
b−
a⋅
b−
−
a⋅
a−
b−
a⋅
(7)
The term w is the fee per passenger that the bus companies have to pay to the IES concessionaire. The CRTM has required metropolitan bus companies to pay this fee without increasing the fares they charge to the users, so the value of w should allow BO to be always positive.
In other words, the operation costs saved by the bus companies should be higher than the amounts those companies pay to the concessionaire. This is the key to explaining how the IESs are funded. The operation cost savings to the metropolitan bus companies throughout the life of the concession enable those companies, through the sums they then transfer to the IES, to help pay off the debt incurred by the shareholders of IES. In other words, the belief in such a future revenue stream is what initial investors, those who build and maintain the IES, take into account in their original calculations.
Until now, we have focused our analysis on the metropolitan buses. Let us deal with the rest of the transportation modes. The urban buses, which are operated by a single public municipal company called EMT, are not as important for the IES as the metropolitan ones, since fewer urban lines go all the way to the IESs. Some of the urban bus lines that connect directly to one of the IES transportation nodes, also use the access tunnel so they save travel time just as do the metropolitan lines, but other lines, the ones that do not use the access tunnel, do not necessarily save travel time. Like the metropolitan buses, the ultimate benefit for the EMT will depend on the savings in operation costs, the additional revenues collected by the EMT that are a
result of the better quality of service and better connections with other transportation modes, and the fee that the EMT has to pay to the IES concessionaire.
Other transportation modes—such as the subway and the commuter rail—are less affected by the construction of the IES because their costs of operation are not reduced by the existence of the IES. However, they can observe that their ridership increases, for the existence of the IES makes transfers to and from them easier, and thus provides them with additional users. Moreover, the metro and the commuter rail do not pay any fee to the IES, and their utility appears at least not to diminish, but it would be more sensible to assume that the additional patronage likely to result from the IES will increase the utility of these lines.
Effects on the abutters and other citizens
The abutters and other citizens are also increasing their utility since they are benefiting from a better quality of life. The IESs reduce the space occupied by urban metropolitan buses that, before the existence of the IES, used to stop on the street to leave off passengers. Those buses on the street reduced the capacity of the urban road network, made difficult the transit of the pedestrians, and caused deterioration in the image of the area and in property values. The construction of the IESs left plenty of available space on the ground, which, now more attractively built up, has substantially improved the image of the urban area around the IES, thus greatly benefited the abutters and other citizens.
Although no specific study has been conducted to estimate the influence of the IES on the prices of real estate around the IESs, it is expected that those prices will increase, which undoubtedly would benefit the abutters. Di Ciommo (2003) reported that the construction of the Intermodal Station of the Gare du Nord in Paris prompted rent increases in the nearest apartments of around 40% to 50%. However, as it already happened at the Gare du Nord, this effect can accelerate a process of gentrification of the urban area, pushing out the low income abutters to other neighborhoods.
Moreover, as some authors point out, the time saved by the users means both a private benefit for the users and a social benefit for the community (Crozet and Joly 2004; Mackie et al. 2001; Hine and Scott 2000). For instance, the construction of the IES and its adjacent tunnel brings about important environmental benefits as well. First, as the use of buses in the corridor increases, the use of private cars will diminish. This will prompt a reduction of emissions and congestion costs that benefits the abutters and other citizens. Second, regardless of the modal market share, the reduction of congestion will prompt a reduction of emissions and energy consumption. And third, after the construction of the IES, the urban environment in the area where the buses used to stop in order to leave off the passengers will be substantially improved.
Effects on the IES concessionaire and the government
The IES concession is designed so as to make the IES business self-financing for the private sector without any need for public support. The condition set up in equation 8 has to be met for this to happen:
∑
∑
= = = = + + + ≥ + ⋅ + i m i i i i i m i i i i i a w I MO T Q AR 0 0 (1α
) (1α
)(8)
Where:
AR Additional revenues (shop rents, advertisements, and so on)
Qai Annual bus passengers in year i = qai×(hours of operation year i) wi Fee per passenger to be paid to the IES concessionaire
α Weighted average cost of capital
Ii Investment or capital cost in year i MOi Maintenance and Operation Cost y year i Ti Income taxes paid by the IES in year i
The IES concessionaire is supposed to make some profit. Obviously, no entity would ever have bid for the concession in the first place unless it had reasonably calculated a future a benefit would be derived from the awarding of that concession. According to the concession contract terms, the concessionaire takes on many risks, such as construction, operation and demand risk. Consequently, the profits that the concessionaire ultimately obtains will depend on how the business goes on in the future. The ultimate utility of the concessionaire will depend on the revenues it will obtain from both transportation operators, commercial rent and other sources ( parking rents, for example), and the ultimate construction and operation costs of the IES
Regarding the regional government, its role is not to make money for itself but rather to increase benefits for the whole community. However, the government often has important budgetary constraints, so it is important for it to be able to promote infrastructure investment without affecting the public budget. In the case of the IESs, the government itself does not provide any subsidy to the concessionaire, but it still holds some of the concession risks such as force majeure or the risk of political changes that can prompt legislative modifications of the existing legal framework. In spite of this, the government will still obtain resources through the additional corporate tax revenues that will likely be paid by the IES Company.
THE AVENIDA DE AMERICA CASE STUDY
In this section, we conduct an exercise intended to evaluate, according to the methodology outlined before, the case study of the Avenida de America IES. This IES entered into operation in 2000 so there is enough of a track record to enable us to quantify the costs and benefits derived from its being put into operation.
The CRTM (2007) reported that the construction of the Avenida de América IESs and their adjacent tunnels and segregated lanes enabled metropolitan buses to save 10
minutes per trip, which means an average travel time reduction of 39% compared to the pre-IES situation. This savings in travel time resulted in additional demand. In fact, the CTRM (2007) reported an increased demand (as measured in number of bus passengers) of around 22%.
First, we conducted an analysis of the users’ benefits caused by travel time savings. According to a survey based on revealed preferences, an average travel time value of 8.8 Euros/hour for bus users can be adopted (CRTM 2007). In order to simplify the analysis, we considered that the only benefit for the bus users are travel time savings. Applying equation 1 to the case study of Avenida de América in order to calculate the yearly benefits, and discounting the benefits at the social discount rate used in Spain, we obtained a result that gave, as the discounted value of accumulated benefits accounts 1,042.65 million Euros.
After that, we evaluated whether the operation cost reduction compensates for the fee that the bus companies have to pay to the IES concessionaire. According to equation 5, we can calculate the marginal cost reduction caused by the increase in the average speed of bus travel. Introducing the average characteristics of the bus lines getting to Avenida de América in equation 5, and assuming that the hourly salary for bus drivers is 17 Euros/hour (Ministerio de Fomento 2006) we can easily calculate that the marginal cost reduction per passenger comes to 0.16 Euros/passenger, which is substantially higher than the fee of 0.06 Euros/passenger that the bus companies have to pay to the IES concessionaire.
This means that, for the Avenida the América IES, the bus companies can largely cover the additional fee they have to pay to use the IESs without a surcharge added to the user tickets. In fact, in the new IESs, the fees established have been set at around 0.15 Euros/passenger, which are much closer to the marginal cost reduction. Overall, for the Avenida de América IES we have estimated savings in operation costs which, once discounted, amount to around 73.76 million Euros for the life of the concession.
Table 3 shows a balance of the quantifiable costs and benefits produced with the construction of the Avenida de America IES. The left side of Table 3 displays the quantifiable social costs derived from the construction and operation of the IES (construction, maintenance and operation costs of the IES) compared to the alternative of having no IES. On the right side are shown the quantifiable social benefits. The figures in the table are actually discounted to present value. It is noteworthy that the social benefits are much higher than the costs. This is because the IES produces important benefits to the users in terms of travel time savings and a better use of waiting time while most of the resources to fund the IES come from savings in operation costs of the bus companies.
Table 3. Discounted costs and benefits stemming from the construction of the Avenida de América IES in Madrid
COSTS Euros Euros BENFITS
Capital cost for the
construction of the IES 25,620,000 73,761,568
Reduction of operation costs of metropolitan buses Maintenance and Operation
Costs 48,207,168 66,977,681
Additional revenues (parking, shop rents, advertising and so on)
Other costs 1,000,000 1,042,651,201
Travel time saved by the users and waiting time reallocation
TOTAL COSTS 74,827,168 1,183,390,450 TOTAL BENEFITS
The analysis conducted previously is very conservative since many benefits have not been quantified. For instance, the reduction of emissions and energy consumption caused by the reduction of congestion has not been taken into account, and this is clearly a major benefit that will only grow in importance. Moreover, we have not included in this analysis the benefits to the abutters such as the improvement of the urban environment in the areas where the buses used to be parked.
DISCUSSION AND CONCLUSION
The implementation of IES concessions in Madrid can be deemed a real success for several reasons. First, these facilities have encouraged the use of public transportation in Madrid with the subsequent reduction of congestion and other non-monetized externalities. Second, the IESs have contributed to the reduction of the operation costs of the metropolitan buses. Third, the IESs have improved the urban environment in areas of the city center that used to be subject to steady deterioration. And fourth, these infrastructure facilities have been able to raise enough money so as to be funded solely by means of private capital through the PPP approach. Consequently, the government was able to promote this infrastructure without committing any additional budgetary resources.
The IESs were able to be funded only with private capital because it was expected that the IESs would be able to raise the necessary revenues to cover their costs. The revenues come from two sources: the fees paid by the buses getting at the IES, and other additional revenues (shop rents, parking rents, advertisements, vending machines, and so on). The fees paid by the metropolitan buses are lower than the operation costs they save by using the IESs so the bus companies do not need to raise the fares they charge to the commuters. Moreover, the advantages of the IES for the users in terms of reduction in travel time, increased comfort, and better connections to other urban transportation modes fosters a greater usage of the IES, which in turn increases the value of the commercial activities inside the IES. The second key issue in raising money consists in taking advantage of the creation of an area where many people gather, or pass through, every day, and thus commercial revenues from stores on-site can be substantial. In particular the new commercial activities can increase strongly the user utility and release their time constraint. In addition, some IESs offer
public parking, for payment, from which revenues are raised to fund the infrastructure as well.
The construction of the IES is thus a very good example of a win-win strategy. The users are pleased since they save time without paying a larger fare for using the metropolitan buses. The bus companies are also happy since, even though they have to now pay a fee to the IES concessionaire, this amount is smaller than the transportation costs they save. Moreover, the bus companies are also pleased since the usage of buses has substantially increased since the construction of the IES. The concessionaire is pleased as well since she has a good business opportunity. The abutters gain in quality of life. The community, even the country, benefits from a reduction in emissions. And the government is able to promote all that without spending additional sums.
REFERENCES
Cristóbal C. & Aldecoa, J. (2002). Concepción de terminales estaciones de autobuses metropolitanos en Madrid, Presented at the International Seminar: La
integración modal en la grandes aglomeraciones urbanas, Mexico City, September 2002.
Crozet, Y. & Joly, I. (2004). Budgets Temps de Transport: Les sociétés tertiaires confrontées à la gestion paradoxale du «bien le plus rare». Les Cahiers Scientifiques du Transport, 45, 27-48.
CRTM (2007). Informe sobre la demanda en el Intercambiador de Avenida de América, Madrid: Internal Report of the Consorcio Regional de Transportes de Madrid. DeSerpa, A. (1971) “A theory of the economics of the time”, The Economic Journal 81,
828-846.
Di Ciommo, F. (2002). “L’accessibilité: l’enjeu prioritaire de la nouvelle politique des transports publics à Naples” in Bernard Jouve, Les politiques de déplacements urbains en Europe, L’Harmattan, pp. 135-159.
Di Ciommo, F. (2003) Le pôle d’échange de la gare du Nord entre intermodalité et régération urbaine. Case study of “Transport and Sustainable development lessons”, Ecole Nationale des Ponts et Chaussées, Paris.
Grotenhuis, J.W., Bart, W.W. & Rietveld, P. (2007). The desired quality of integrated multimodal travel information in public transport: Customer needs for time and effort saving. Transport Policy, 14, 27-38.
Hine, J. & Scott, J. (2000). Seamless, accessible travel: users’ views of the public transport journey. Transport Policy, 7, 217-226.
Jara-Diaz S. (2007), Transport Economic Theory, Elsevier, 140 p.
Jara-Díaz, S. R., Tirachini A. & Cortés, C.E. (2008). Modeling public transport corridors with aggregate and disaggregate demand? Journal of Transport Geography 16, 430-435.
Mackie, P.J., Jara-Diaz, S. & Fowkes, A.S. (2001). The value of travel time savings in evaluation. Transportation Research Part E: Logistics and Transportation Review, 37, 91-106.
Mayer, J (2007). Private Returns, Public Concerns. Addressing Private-Sector Returns in Public-Private Highway toll Concessions. Transportation Research Record: Journal of the Transportation Research Board. 1996, 9-16.
Ministerio de Fomento (2006). Observatorio de costes del transporte de viajeros en autocar. Madrid: Dirección General de Transporte por Carretera.
Monzón, A., Cascajo R., Pardeiro A.M., Jordá P., Pérez P. & Delgado M.A. (2007). Observatorio de la movilidad metropolitana: Informe 2005. Madrid: Ministerio de Medio Ambiente.
Nash, C. (2007). Road Pricing in Britain. Journal of Transport Economics and Policy, 41, 135-147.
Vassallo. J.M. & Gallego, J. (2005). Risk-sharing in the New Public Works Concession Law in Spain. Transportation Research Record: Journal of the Transportation Research Board, 1932, 1-9.
Vassallo, J.M., Pérez de Villar, P., Muñoz-Raskin, R. & Serebrisky, T. (2009). Public Transport Funding Policy in Madrid. Is there Room for Improvement? Transport Reviews, 29, 261-278.