O R I G I N A L R E S E A R C H
One size fits all? High frequency trading, tick size
changes and the implications for exchanges: market
quality and market structure considerations
Thanos Verousis1•Pietro Perotti2•Georgios Sermpinis3
Published online: 28 March 2017
The Author(s) 2017. This article is an open access publication
Abstract This paper offers a systematic review of the empirical literature on the impli-cations of tick size changes for exchanges. Our focus is twofold: first, we are concerned with the market quality implications of a change in the minimum tick size. Second, we are interested in the implications of changes in the minimum tick size on market structure. We show that there is a large body of empirical literature that documents a decrease in transaction costs following a decrease in the minimum tick size. However, even though market liquidity increases, the incentive to provide market making activities decreases. We document a strong link between the minimum tick size regulations and the recent increase in high frequency trading activity. A smaller tick enhances the price discovery process. However, the question of how multiple tick size regimes affect market liquidity in a fragmented market remains to be answered. Finally, we identify topics for future research; we discuss the empirical literature on the minimum trade unit and the recent calls for a minimum resting time for quotes.
Keywords Tick sizeMarket qualityMicrostructureHigh frequency tradingTrading costsMinimum trade unit
JEL Classification G14G18
& Pietro Perotti [email protected]
1
Newcastle University Business School, Newcastle upon Tyne, UK
2 School of Management, University of Bath, Claverton Down, Bath BA2 7AY, UK 3
1 Introduction
In many respects, and until recently, changes on the minimum tick size regulations appeared to have been fuelling the race to the bottom for transaction costs. This was primarily the case in the US markets since 2001—that is, since the adoption of decimal pricing that slashed costs in terms of a reduction in bid–ask spreads. In this literature review, we critically discuss the implications of changes in tick size regulations on market quality and market structure.
Our focus is twofold: First, we are concerned with the market quality implications of a change in the minimum tick size. In particular, we present the empirical literature con-cerned with the effect of minimum tick size regulations on trading costs and liquidity. The vast majority of the empirical literature has documented a decrease in spreads and an increase in liquidity following a tick size reduction. However, one stream of the literature is also concerned with the effect of this reduction to quoted depth and the ability of the market to absorb large trades. In addition, we document the strong link between the minimum tick size regulations and the recent increase in high frequency trading (HFT). As it will be noted, a small minimum tick size allows high frequency traders (HFTRs) to implement their strategies, whilst a larger relative tick size leads to larger profit by HFTRs due to increased trading activity. Finally, we discuss the implication of the minimum tick size on market volatility.
Second, we are interested in the implications of changes in the minimum tick size on market structure, i.e., the effects of the minimum tick size regulation in different market settings. To this end, we are concerned with the effect of tick size changes on the price discovery process, market making and market quality indicators. As we will discuss in the following sections, the decrease in tick sizes has enhanced the price discovery process but has de-incentivised market makers to provide liquidity. The latter has triggered the recent pilot study by the Securities and Exchange Commission (SEC) to increase the tick size for a sample of less liquid stocks. We subsequently focus on the implications of a change in tick size on market design and also on the interaction between market players, especially between retail and institutional investors.
To an extent, our motivation for this review stems from the SEC’s recent introduction of a pilot study for certain small capitalization stocks traded on the NYSE for which the minimum tick size would be increased (see SEC2014a).1We are therefore in the midst of a potential change in policy in the US stock exchanges that may reverse the changes implemented since 2001. However, in our view, a second recent proposal that is related to the minimum tick size regulations—and is an obvious area for future research—is the suggested changes to the minimum resting time which asks and bids would be required to have on the limit order book. These proposed changes are mostly associated with the implementation of MiFiD II in Europe’s financial markets and have, as their primary goal, the curling of HFT in Europe (see Stafford and Barker2014).
In this literature review, our focus is more on the impact of the minimum tick size regulations on market structure and market quality than on the effect of minimum tick size changes on trading activity and transaction costs. Why the choice to focus on market structure and market quality? The literature is overwhelmingly positive on the effect of decimalisation and the general decrease in tick sizes on transaction costs. However, the problem with a small tick size is that, while the results of low transaction costs are felt by
1
market participants at an absolute level (i.e. market participants receive smaller transaction costs), the same also applies for market quality. That is, transaction costs have reached a point that may be harmful for the welfare of the exchange. One example of the above is the increased need from the exchanges to provide a constant flow of liquidity in a stable en-vironment; however, the lower the transaction costs, the smaller the incentive of market makers to support the exchange on that task. Therefore, our paper is different from pre-vious studies on the effect of decimalization on trading costs as our goal is to synthesize the literature with market structure and market quality in mind. Thus, we are very keen to offer a perspective to academics, policy regulators and market participants on where the current and future research in this area may develop.
The review is structured as follows: Sect.2 gives a general outline of the surveyed papers and discusses our methodological approach to this literature review. Section3
discusses in detail the empirical literature, and Sect.4discusses related research on the minimum trade unit. Section5 concludes the review but, crucially, it also discusses opportunities for future research.
2 An outline of the surveyed papers and structure of this literature review
2.1 An outline of the surveyed papers
The majority of papers concerned with the minimum tick size focus on minimum tick size changes and, in particular, on the implementation of decimal pricing in the US exchanges in April 2001. Methodologically most studies investigate the effect of tick size changes after controlling for certain stock and exchange characteristics (see Ahn et al. 2007; Bacidore1997; Chakravarty et al.2005). In particular, studies rely on one of the following sets of samples:
1. Longitudinal studies, that is, studies which report statistics before and after a tick size change on the same set of assets (see Gibson et al.2003; Goldstein and Kavajecz2000; Jiang et al.2009). This set of studies benefits from studying the same set of assets, however there is also a risk associated with comparing assets in different sample periods.
2. Cross-sectional studies, that is studies that compare assets that are affected by a minimum tick size change with assets for which the tick size is unchanged and trade in either the same exchange (see Chakravarty et al.2004; Griffiths et al.1998) or in a separate exchange (Bessembinder2003; Chung et al.2004a; Jiang et al.2009). The latter set of papers relies on a set of matching methods to produce a set of assets that are comparable across the two exchanges.
3. A third set of studies relies on assets that are cross-listed, that is assets that are trading on more than one exchange where the change affects trading in only one of the exchanges (see Lin et al.2009; Oppenheimer and Sabherwal2003). This is also related to a more recent set of studies concerned with the association of the minimum tick size regulations and the incidence of HFT, in addition to the interaction of market systems (see Bartlett and McCrary 2013; Mahmoodzadeh and Genc¸ay 2014; O’Hara et al.
2014).
Most studies rely on trade and quote (TAQ) data in order to produce reliable estimators of bid–ask spreads, an indicator of liquidity and trading costs (see Coughenour and Harris
Al-Yahyaee2013; Chung et al.2005) and a second subset of studies use full limit order book data (see Pan et al.2012). The majority of published papers use NYSE and NASDAQ TAQ data (see Chou and Chung2006; Jones and Lipson2001; Johnson et al.2014; O’Hara et al.
2014), and some more recent studies use the national best bid and offer (NBBO) US data. There are also variations in the sample time period. A number of studies attempt to predict the effect of the (then) proposed implementation of decimal pricing on market structure and market quality (see Harris1991,1994), whereas most studies are concerned with the ex-post realization of a decrease in the minimum tick size (see Chan and Hwang 2002; Chung et al.2002; Zhao and Chung2006). Finally, the most common financial instrument used is common stocks (see Chung et al. 2004; Gerace et al.2012; Hagstro¨mer and Norde´n
2013), but more recent papers which focus on HFT also rely on foreign exchange data (see Mahmoodzadeh and Genc¸ay2014). A limited number of published papers use mutual fund data (see Bollen and Busse2006) or data from derivatives exchanges (see ap Gwilym et al.
2005; Stone2009; Chueh2000).
2.2 Structure of the literature review
An obvious way to present the papers in this literature review is in a chronological order. To an extent, this is a logical approach but one which is largely ineffective: conveying the effect of tick size changes on exchanges becomes increasingly difficult unless the focus is on the main feature of exchanges. To this end, for the purposes of this literature review, we classify research as falling in the following categories with respect to the implications of their findings in market quality and market structure:
1. Market quality: we rely on the definition of market quality used by the London Stock Exchange to discuss the effect of minimum tick size changes on market quality indicators.2In this respect, market quality is represented by liquidity, transaction costs and volatility. To this end, our discussion focuses on each one of these market characteristics interchangeably. In addition, we look at two aspects of market quality that are crucial in the implementation of an optimal tick size. The first relates to execution speed, and refers to HFT. The literature makes a special case on the effect of minimum tick size changes on the success of HFT. The second aspect refers to the effect of the minimum tick size changes on market making. The literature generated by the exchanges is very critical regarding the dire consequences which slashing the minimum tick size has on the ability of market makers to continue supporting the illiquid stocks and initial public offerings (IPOs).
2. Market structure: crucially, the implementation of the minimum tick size in different market settings determines the success of the regulatory policy of tick size changes. We therefore focus on the way different markets have adjusted to the minimum tick size (the markets) and also the way in which different market participants are affected by the changes (the players). To this end, we also discuss how the minimum tick size changes have altered the interaction between a limit order-book market and dark pools. An important feature of market structure is the facilitation of the price discovery process and in this literature review, we review the papers that show the relationship between the minimum tick size regulations and the price discovery process.
2
London Stock Exchange, ‘‘How Can Market Quality Be Determined’’http://www.londonstockexchange. com.
Rather than discussing the papers in detail, we summarize them in separate tables ac-cording to their main implications for market structure and market quality. That is, whilst there are obviously some papers whose main findings relate to two or more topics, we focus on the consequences of the findings for our main themes of the literature review. Focusing on market structure and market quality meant dropping a small number of papers that make little or no contribution in these two areas. Our hope is that readers of this literature review will be able to formulate a good understanding of the tick size regulations and the effect of tick size changes on the microstructure of financial markets which will inform their future research.
3 Detailed review of the literature on minimum tick changes
3.1 Effect of tick size changes on market quality indicators
3.1.1 Tick size changes and trading costs
In Table1, we present the first set of studies which focus on the implications for trading costs of a minimum tick change. In Panel A, we present the set of studies focussing on a minimum tick size decrease and in Panel B, we focus on studies that discuss the impli-cations for trading costs of a large minimum tick size. In each panel, references are grouped by sample, and then in ascending order by end date of the used sample. This is done in order to group together studies that have focused on the same market, and to identify within that group any trends emerging over time.
This set of studies focuses mainly on the US decimalization, so the bulk of work is conducted with TAQ data relating to US exchanges. In Panel A, the main findings overall support the hypothesis that a smaller tick size leads to narrower bid–ask spreads. The paper by Harris (1991) originally established that a large tick size may act as a binding constraint for the lower-priced stocks, hence what is important is not only the nominal value of the tick size but also its relative value, namely the value of the tick size in relation to the stock price: the greater the stock price, the less binding is the tick size. Kurov and Zabotina (2005) show that the minimum tick size may act as a binding constraint for the very liquid contracts, however, Bollen and Whaley (1998) and Hsieh et al. (2008) show that whilst spread costs fall following a reduction in tick size, market depth also falls which may increase trading costs for larger trades overall.
In Table1, Panel B, we present the studies that are concerned with the impact of an artificially large tick size on trading costs. The empirical literature around this subject is relatively limited but one important issue arises: the tendency of investors to use a smaller set of prices which effectively increases the minimum tick size. Studies in this area clearly show that there is a strong positive relationship between execution costs and price clus-tering (Bessembinder1997). Ikenberry and Weston (2008) show that this artificially large minimum tick is a product of a fundamental human bias for the more prominent numbers. In terms of the implications for market structure and in particular with regard to trading costs, the evidence suggests that a decrease (increase) in tick size leads to a decrease (increase) in trading costs, especially for the low-priced shares (Van Ness et al. 2000). However, negotiation costs also increase as the minimum tick increases. Finally, if the use of a tick size has an embedded human bias, then the evidence suggests that a tick size
Table 1 Empi rical studies on the effect of a tic k size change on tradi ng costs Reference Market(s) (no. of assets) Period(s) (approxi mate) Sam ple/ frequ ency Main findin g(s) aft er tic k size reduction Impl ication s o f a sm aller tick for market struct ure Panel A: The effect of a minimum tick size dec rease on tradin g costs Harri s ( 1991 ) All stocks gr eater or equal than $1 Jan 63–Dec 87 CRS P A sm aller tick size acts as a bindin g const raint for lower-priced stocks Increases the costs of negot iating Grah am et al. ( 2003 ) NY SE firms that pay cash div idends Jan 96–Au g 0 0 and Ja n 01–Dec 01 CRS P Abnorma l ex-dividen d day returns increa se in the 1/1 6 and decimal prici ng eras, rela tive to the 1/8 era Result s again st the theo ry that spr eads are the dom inant transact ion cost fo r ex-day traders Kurov and Zaboti na ( 2005 ) CM E (S&P 500), NASDAQ (index and E-mini futures) Jan 02–Dec 02 CTR & tra des The minim um ti ck size acts as a bindin g const raint for the very li quid cont racts Result s in lower trading costs Gwil ym and Alibo (2003 ) FT SE100 stock index fu tures Jan 97–Dec 99 TAQ LI FFE A struct ural change in price cluste ring foll owing the mo ve to au tomate d trading A sm all tic k is an importa nt factor in red ucing obser ved bid–ask spr eads Lau and McInish (1995 ) SE E (5) Jul-9 4 TAQ SE E The reducti on in tick size decreased bid–ask spre ads Tick size clearly associ ated with tradi ng costs Van N ess et al. ( 2000 ) AMEX (98), NASDAQ (804), NYSE (1051 ) Jan 97–Ap r 9 7 TAQ U S The decrease in tick size led to a red uctions in spre ads and dept h and an increa se in the num ber of quot es The intr oductio n o f sixteent hs of a dol lar had an imm ediate impact on equity tradi ng costs in U .S. market s Boll en and Whaley (1998 ) NY SE (2 852) May 97–J ul 97 TAQ U S Follow ing the reducti on in tick size both bid / ask spreads and market dept h at the pre vailing bid /ask quotes have fallen Leads to lower inv estor trading costs , with the large st ga ins bein g exper ienced for low price sha res and for small trade sizes Hsieh et al. ( 2008 ) TAI EX Sep 04–Au g 0 5 TEJ Market liquidi ty increased foll owing the red uction in tick size Tick size reduction leads to an increa se in marke t effic iency
Table 1 continu ed Reference Mar ket(s) (no. of assets) Perio d(s) (ap proxim ate) Sampl e/ frequ ency Main findin g(s) Impl ications of discret eness for market struct ure Panel B: The effect of a large minimum ti ck size on tradin g costs Chung et al. ( 2011 ) KSE (651) Apr 03–J un 03 TA Q KSE & US Lar ge tick sizes impos ed on hig h-priced sto cks are signific ant bin ding const raints on bid–ask sprea ds The artificially impos ed large tick sizes are associ ated with large tradi ng costs Bess embind er ( 1997 ) NASDAQ and N YSE (300p airs) Apr 94–Dec 94 TA Q U S A stron g posi tive relationship between execution costs and price-r oundin g freque ncies for NA SDAQ issu es but not for N YSE issues. Price-rou nding conven ti ons incre ase trade execution costs Ikenber ry and Weston (2008 ) NYSE (1920 ), N ASDAQ (1851 ) Jul 02–Dec 02 TA Q U S Evi dence of a more fundament al human bias for promin ent number s Tick size changes may have onl y a minor effect on the pre vailing transac tion prices ASX A ustralian Stock Exchan ge, CME Ch icago Merca ntile Exchan ge, CRSP Cente r for Research in Securi ty Pri ces, CT R Computeri zed Tr ade Recon structio n, EBS Electroni c Brokin g Servi ces, HKE x Hong Kong Stock Exchan ge, ISE Is tanbul Stock Exchan ge, ISSM refer to the Institu te for the Study of Securi ties Market s, KLSE Kuala Lumpu r Stock Exchan ge, KSE Kore a Stock Exchan ge, MSM Muscat Secur ities Market (Oman), NA STRAQ NASD AQ Trade and Q uote D ata, NBBO Na tional Best Bid and Offer, NZX Ne w Zealand Stock Exchan ge, O MXS Stockh olm Stock Excha nge Index, OPRA Opti on Price Repo rting Author ity, SEE Stoc k Exchan ge of Si ngapo re, SET St ock Exchan ge of Thailand, SEHK Stock Excha nge of Honk Kong, SFE Syd ney Future s Exchan ge, SOD Summ ary of Deposi ts, TAIEX Taiwa n Stock Exchan ge, TAQ Trade and Quot es, TE J Taiwan Econom ic Journal , TRTH refer to Thoms on Reut ers Tick History, TSE Toron to St ock Exchan ge
decrease may not have the desired effect since traders would still continue to use the artificially large tick size.
3.1.2 Tick size changes and market liquidity
In Table2, we consider the studies that focus on the implications of change in tick size on asset liquidity. From a methodological perspective, there is an overlap in the methods employed for the studies included in Tables1and2as for both sets of studies the bid–ask spread is the main variable of interest. The classification as to whether a study is more relevant to trading costs or liquidity is based on self-selection, namely we allow the study itself to identify its main contribution to the literature. Also, for reasons of clarity, we avoid double-entries across the two tables.
Studies that investigate the effect of a tick size change on liquidity are conducted across a range of markets and instruments, and over a relatively long time-span. As anticipated, most studies report that a decrease in tick size has positive implications for liquidity. In particular, decreasing the tick size almost always increases liquidity for the more heavily-traded stocks (Hameed and Terry1998and Anderson and Peng2014) and for stocks with a larger relative tick size (Aitken and Comerton-Forde2005). Ahn et al. (1996) show that the decrease in tick size has no impact on the liquidity of infrequently traded stocks. Further, a number of studies show that a smaller tick size leads to an increase in negotiation costs which might, to an extent, mitigate the benefits of an increased liquidity (see Hameed and Terry1998).
The majority of studies in Table2show that both spreads and depths at the best quote decline following a tick size decrease. In relation to the latter, ap Gwilym et al. (2005) show that the benefit of a smaller monetary spread outweighs the reduction in quoted depth. Also, traders who tend to trade on the best bid and ask experience an increase in liquidity, yet the opposite effect may be experienced by larger traders (Chung et al.2005
and Cai et al.2008). Verousis et al. (2016) show that the ability of the options market to absorb large trades diminishes following a tick size reduction. The latter observation reflects the fact that larger traders may exhaust the depth at the best ask and bid, but only a limited number of studies focus on the effect of tick size changes on asset depth beyond the first level of the limit order book (see Table2below). Evidently, this is a shortcoming in the literature to date, which is somewhat mitigated by the use of effective spreads as a hybrid measure of liquidity.
3.1.2.1 Tick size changes and effects on market making What is of particular interest to changes in the minimum tick size and market structure is the relationship between the former, and market making activities. The professional literature clearly identifies the decrease in the minimum tick size as one of the main reasons why market making has become unprofitable with wider consequences regarding ability to support illiquid stocks and initial price offerings (IPOs). In Table3, we present the studies that relate the change in the minimum tick size with market making.
Theoretically, Bernhardt and Hughson (1996) show that discreteness—the existence of the minimum tick size—limits competition, whilst also permitting market makers to offer profitable quotes. The question is therefore, do minimum tick size changes make market making more profitable?
Table3a shows the studies that investigate the implications for market making when there is a decrease in the minimum tick size. Studies in this area show that a decrease in
Table 2 Empi rical studies on the effect of a mini mum tick size on li quidity Reference Market (s) (n o. of assets) Period(s) (approxi mate) Sam ple/ frequ ency Main findin g(s) after tic k size reduction Impl ication s o f a sm aller tick for market struct ure Hameed and Terry (1998 ) SES (238) Jan 80–J ul 94 Daily da ta A negat ive relationshi p between tick size and pr ice clusterin g Lowers tradi ng costs and improv es liqui dity in the cas e o f active ly trade d stocks but incre ases negot iation costs for the thinl y traded stocks Chung et al. ( 2005 ) KLS E (812) Jan 96–Dec 01 Daily da ta Wide r sprea ds and less quote clust ering for sto cks that are subj ect to large r man datory tic k sizes A larger tick for higher priced stock s is detri mental to market liqui dity but this effect is miti gated by lower negotiat ion costs Al-Yahyaee ( 2013 ) All MSM stocks Jan 97–J un 10 Daily da ta An increase (decrease) in ex-day premium s (ab norma l returns) An improv emen t in liqui dity and red uction in exe cution costs in a futures market settin g Harri s ( 1994 ) NY SE and AMEX (529) Jan 89–Dec 89 ISSM A decli ne in spreads and dept hs Benefit s the small liquidi ty-demandin g traders but hur ts the large liqui dity-dema nding traders Aitken and Comert on-Forde (2005 ) ASX (674) Oct 95–Fe b 9 6 TAQ A S X A n increase in li quidity A clear er benefi t for sto cks with a larger rela tive tic k size Gwil ym et al. ( 2005 ) UK long gilt futures Aug 97–Oct 98 TAQ LI FFE A drop in the monetary va lue of the spread The benefi t o f narrow er mo netary spreads out weigh the reduction in quoted de pth Alampi eski and Lepone (2009 ) SFE (3, 10 year bonds, 90-day Bill Futures) Dec 06–Ma r 0 7 TAQ SF E A decline in spreads, dept hs an d a red uction in exe cution costs An improv emen t in liqui dity and red uction in exe cution costs in a futures market settin g Anderson and Peng ( 2014 ) NZX (34) Sep 10–Au g 1 1 and May 11–May 12 TAQ SIR CA A decli ne in spreads and dept hs but a small er incre ase in liquidi ty fo r small er firm s A clear er bene fit for the larger , more active sto cks Cai et al. ( 2008 ) Toky oSE (226) Jan 97–Dec 97 TAQ Toky oSE Liqui dity effects are as ymmetr ic fo r tick-incre asing and ti ck-decr easing ev ents Benefit s less the small limit-o rder trade rs who do not exhaust the depth at the best quote Ahn et al. ( 1996 ) AMEX (3 04), NYSE (377) Jun 92–No v 9 2 TAQ U S A decr ease in quote d and effective spr eads A red uction in trade size but no impa ct on the liqui dity of infre quently traded stock s
Table 2 continu ed Reference Market (s) (n o. of assets) Period(s) (approxi mate) Sam ple/ frequ ency Main findin g(s) after tic k size reduction Impl ication s o f a sm aller tick for market struct ure Chung et al. (2004) NY SE (2603 ) Aug 00–J an 01 TAQ U S A larger liquidi ty benefi t for sto cks with higher pr oportio ns of one-tic k spreads and odd-six teenth quot es, and more frequ ent trading bef ore dec imalizati on Increases pr ice compe tition and red uces bin ding const raints: sub-pen ny prici ng may fu rther red uce the spreads of high-vol ume, low-ri sk, or low-p rice d stocks Gerace et al. ( 2012 ) HK Ex (4 0) Jan 05–J an 06 TRTH A decli ne in spreads and dept hs Impro ves market liquidi ty Vero usis et al. ( 2016 ) NY SE LIFFE Jan 09–M ar 10 TAQ LI FFE Option liqui dity increased but at a decr easing rate with opt ion mo neyness The ability of the market to absorb large trades dimi nishes Acronyms are de fined in Table 1
Table 3 Empi rical studies on the effect of a tic k size change on market mak ing Reference Mar ket(s) (no. of assets) Perio d(s) (ap proxim ate) Sampl e/ frequ ency Main findin g(s) after tick size red uction Impl ication s o f a sm aller tick for market structure Panel A: The effect of a minimum tick size dec rease on marke t m aking activ ities Stone ( 2009 ) U S options (26) Aug 06–Au g 0 7 T A Q OPRA A narrow er bid –ask spread redistributes the gains of innovat ion fro m the ex changes’ market makers to investo rs Decreases the w illingn ess of market mak ers to trade fart her-from-the-strike sec urities Porte r and Weaver (1997 ) TSE (480) Mar 96 and May 96 TA Q TS E A negligibl e impac t o n inte rnalization and member profits A sm aller tick might result in higher commi ssion pr ofits Bacidor e ( 2001 ) TSE (318) 12 Feb–14 Jun 96 TA Q TS E Tra ders have a small er incen tive to improv e the qual ity of thei r informa tion hence a drop in the ad verse selection componen t o f the spre ad Shifts eco nomic ren ts and red uces costly inform ation acq uisition
MacKinnon and Nemiroff (
2004 ) TSE (167) Jan 96–J ul 96 Tr ades TS E A very large de cline in the profits to liquidi ty provider s Given a decision to provi de liqui dity, an age nt ha s an incen tive to do so at sm aller price increment s (e.g., a small er spre ad), but there is a grea tly reduced incen tive to provi de liqui dity in the first place. Bacidor e ( 1997 ) TSE (489) Feb 96–J un 97 TA Q TS E A reduc tion in spreads when the tick size is large Leads to an increase in li quidity but a decr ease in li quidity provi ders’ pr ofits He and Wu ( 2005 ) NYSE (116) Aug 00–Sep 00 an d De c 00–J an 01 TA Q U S A reduction in market -making and round ing error co sts, but not in public news costs A dec line in market mak ers’ costs for supp lying li quidity reduc es spreads Coughen our and Harris ( 2004 ) NYSE (1181 ) Dec 00 and Feb 01–M ar 01 TA Q U S D ecimalization relaxed the publ ic or der precedence rule an d led to more price aggressi veness by the special ists No change in the aver age special ist gross tradi ng pr ofits. Speci alist partic ipation increased for sto cks w here the cost and oppo rtunit y o f obta ining order pr ecedence were relatively expensive and sca rce pr ior to the tick cha nge Bess embind er ( 2003 ) NASDAQ and N YSE (3 00 pairs) Jan 01 and Apr 01–Au g 01 TA Q U S Pos t-deci malization execution costs are similar across N ASDAQ and NYSE stocks Does not affect liquidi ty supp ly
Table 3 continu ed Reference Mar ket(s) (no. of assets) Perio d(s) (ap proxim ate) Sampl e/ frequ ency Main findin g(s) after tick size red uction Impl ication s o f a sm aller tick for market structure Chung and Van Ness ( 2001 ) NASDAQ (134) Oct 96–Sep 97 TA Q U S A decline in sprea ds Makes it less costl y for market mak ers to mana ge thei r inve ntories Chung et al. ( 2004c ) NASDAQ and N YSE (5 17 pairs) May 01 TA Q U S Pos t-deci malization, the relative sizes of NASDAQ and NY SE sprea ds depend largel y o n the av eraging method s For low-v olu me stocks, special ists red uce execution costs but for large stocks com peting dealer s pr ovide mo re benefi ts Charo enwong et al. ( 2016 ) NYSE (230 IPOs) Jan 98–Dec 04 TA Q U S Rel ation between spr eads and IPO underp ricin g become s negative Benefit s fro m the increase d price competi tion are felt mo re by hot IPOs Reference Ma rket(s) (no. of assets) Perio d(s) (ap proxim ate) Sam ple/frequency Main finding( s) Impli cations of a larger tick for market struct ure Panel B: The effect of a large minimum ti ck size on tradin g costs Boll en et al. ( 2003 ) S&P 500 futures Nov 05–Oct 98 CTR The incre ase in tick size led to an increase in the bid– ask sprea d and a red uction in tradi ng volum e A large tic k increa ses market mak er rev enue Angel ( 1997 ) NYSE and AMEX (1160 split s) Jan 84–Dec 93 TAQ US Idios yncrati c risk, firm size, and visibili ty of the firm affect the optimal relative tick size Prov ides an incen tive fo r dealers to mak e market s and for inve stors to provi de liqui dity by placing limit order s Anshu man and Kalay ( 1998 ) Theory Theory Theory The mini mum tick cau ses time-v arying bid–ask spreads, as ymmetric commissi ons, and market breakdowns The minim um tick permit s a com petitive market mak er to realize econom ic profits that he lp reco up fixed costs
Table 3 continu ed Reference Ma rket(s) (no. of assets) Perio d(s) (ap proxim ate) Sam ple/frequency Main finding( s) Impli cations of a larger tick for market struct ure Gibs on et al. ( 2003 ) NYSE (415) Dec 00–M ar 01 TAQ US De cimalisa tion led to a decrease in order-processi ng costs but not to adverse selection and invento ry costs A large tic k size allows market make rs to enjoy sprea ds that are larger than their actual costs Reference Market (s) (n o. of assets) Period( s) (appr oximate ) Sampl e/frequency Main find ing(s ) Impli cations of discrete ness for market struct ure Panel C: The eff ect of discreteness o n m arket making Chor dia an d Subrahm anyam ( 1995 ) NY SE (24) Ja n 88–Dec 91 ISSM The pra ctice of payme nt-for-order flow and the possibi lity of inferior execution can arise naturally in respons e to a finite tick size A small er tic k will make the com petition for order flow more transp arent and redirec t o rders to the least cost provide r o f market marking se rvices Christ ie and Schu ltz ( 1994 ) NA SDAQ & NYSE (100 pairs) Ja n 91–Dec 91 ISSM Spreads in the minim um ti ck are non-ex istent for a majori ty of NASDAQ stocks Ma rket makers may collude to impose an artific ially highe r tick size than the mini mum tick size permit ted Bour ghelle and D eclerck ( 2004 ) Euron ext Paris (232) O ct 98–Mar 99 TAQ Euron ext An incre asing but convex relationship be tween the relative ti ck size and the relative spr ead A change in tick size changes the level of transp arency in liqui dity supply Chung et al. ( 2004 b ) N A SDAQ (3242 ) N ov 00 and Jun 01 TAQ NAST RAQ Spreads are posi tively related to the propo rtion of internalized volum e A small er tic k size leads to lower or der preferencing
Table 3 continu ed Reference Market (s) (n o. of assets) Period( s) (appr oximate ) Sampl e/frequency Main find ing(s ) Impli cations of discrete ness for market struct ure Ascioglu et al. ( 2010 ) Toky oSE (1656 ) Jul 04–Fe b 0 7 TAQ Toky oSE Tra de size, the number of trades, and price are the most import ant determinant s o f wheth er the minim um tic k size is a bindin g constra int Tick size rules shou ld be set based on tradi ng activity and price, rat her than price alon e Ahn et al. ( 2007 ) Toky oSE (3785 ) Ja n 98–Jul 98 TAQ Toky oSE A decrease in quoted and effective spre ads but no increase in tradi ng volume The minim um tick size creates and maint ains econom ic rents for li quidity provi ders Ball and Ch ordia ( 2001 ) N Y S E (14) Feb 97–No v 9 7 TAQ US Obse rved prices and quot ed spreads do not corres pond to the equi libriu m prices and true spreads that woul d exist in a market with no minim um tic k size For large stocks, mo st of the quote d spread is attribu table to price round ing Panel D: The effect of a tic k size chang e o n broker acti vities Schu ltz ( 2000 ) N A SDAQ & NYSE (235 spl its) A p r 93–M ar 94 TAQ US An incre ase in trading costs , and weak evidenc e that costs of market making decline fo llowing splits A large relati ve ti ck pr ovides a m o tive for brokers to prom ote a stock Kada pakkam, Krishna murthy and Tse ( 2005 ) NY SE (526 split s), NASDAQ (722 splits) Ja n 95–Dec 96, Ja n 98– Dec 99 and Feb 01– Dec 02 TAQ US Pos t-decimalization, the increase in sprea ds, the decrease in the average buy order size and the increase in the frequ ency of small transact ions are small er in magnitud e after the spl it than be fore de cimalization
Table 3 continu ed Reference Market (s) (n o. of assets) Period( s) (appr oximate ) Sampl e/frequency Main find ing(s ) Impli cations of discrete ness for market struct ure Chou, Lee and Chen ( 2005 ) NY SE (724 spl its) Ja n 96–May 00 CRSP Abnorm al ex-spl it day returns decrease and abnorm al trading vol umes incre ase Sho rt-term traders arb itrage activities increase as costs decr ease Acronyms are de fined in Table 1
tick size leads to a decrease in market making profits. In particular, Stone (2009) shows that a narrower bid–ask spread redistributes profits from market makers to investors. Bessembinder (2003) also noted that reducing the minimum tick size on NASDAQ equates execution costs of the dealer market with a limit order book market,withouthaving an adverse effect on liquidity supply. A number of interesting patterns in market structure do arise though: in dealer markets, the mechanism through which a reduction in the tick size leads to an increase in spreads is via a decrease in liquidity providers’ profits (He and Wu
2005and Bacidore1997). That reduction in profits reduces the incentive of market makers to provide accurate information, therefore the adverse selection component of the spread decreases (Bacidore2001) whilst also making it easier for market makers to manage their inventories (Chung and Van Ness 2001). Furthermore, market makers are still able to provide liquidity although the incentive to do so is greatly reduced (Stone 2009 and MacKinnon and Nemiroff2004). A crucial finding for market structure is that, for low-volume stocks, the existence of specialists leads to a reduction in trading costs whereas for large stocks, competition amongst dealers proves more beneficial for the market (Chung et al.2004c). Interestingly, in a recent study, Charoenwong et al. (2016) show that deci-malisation has not affected the flipping strategy of institutions for cold IPOs. However, institutions are found to flip more hot-IPOs post-decimalisation due to the lower cost of flipping for IPOs that have substantial price increases in aftermarket trading.
In Table3, Panel B, we present the studies that have focused on the implications which increasing the minimum tick size has on market making. Studies in this area have shown that increasing the tick size (1) leads to an increase in market making profits and hence to an increase in liquidity supply by the latter (Bollen et al.2003) and Anshuman and Kalay
1998) and (2) helps market makers to recover fixed costs. At the same time, Angel (1997) shows that in a large tick regime, investors are able to supply liquidity by placing limit orders. In Table3, Panel C, we conclude this section by presenting the studies concerned with the general implications of a minimum tick on market making activities. Ball and Chordia (2001) show empirically that, with the existence of a minimum tick, prices and spreads do not correspond to the equilibrium prices which would exist without a minimum tick size. Crucially, all studies in this field indicate that pricing and competition on exchanges largely depend on the regulations governing the minimum tick size. Chordia and Subrahmanyam (1995) demonstrate that the existence of a finite minimum tick leads naturally to a curtailing of competition via the payment-for-order-flow practices. More importantly, Christie and Schultz (1994) show that the minimum tick may artificially arise due to market maker collusion, and both Bourghelle and Declerck (2004) and Chordia and Subrahmanyam (1995) show that a change in the tick size alters the level of transparency in liquidity supply.
Finally, in Table3, Panel D, we present the two studies that discuss the implications of a tick size change on broker activities. Crucially, stock splits increase the relative tick size which, as explained above, leads to an increase in market making profits. As a conse-quence, brokers may have a greater incentive to promote a stock that has seen an increase in its relative tick size because they may capture some of the additional benefit generated by market makers.3Whilst there are only two empirical studies in this field, they both show that an increase in the relative tick size supports the broker promotion hypothesis. Importantly, Chou et al. (2005) show that abnormal ex-split day returns decrease and abnormal ex-split trading volume increases post-decimalisation which confirms the
3
The increased revenue can be captured either by payment-for-order flow agreement, or by brokerage houses operating separate in-house market making operations (Schultz2000).
hypothesis that arbitrageurs engage in more trading activities as transaction costs are reduced.
3.1.3 Tick size changes, execution speed and HFT
Until recently, a largely overlooked component of liquidity was execution speed. In this respect, there are only a handful of earlier studies that investigate the implications for execution speed of a change in the minimum tick size (see Coughenour and Harris2004). However, this field is now clearly a future area of research as execution speed is the cornerstone of HFT. In Table4, we present the studies that investigate the implications of a change in the minimum tick size for the occurrence and profitability of HFT strategies. In Table4, Panel A, we discuss the studies which relate HFT to a small tick size, and in Panel B we refer to studies which relate HFT to a large relative tick size.
In Table4, Panel A, all studies uniformly agree that a reduction in the minimum tick size leads to an increase in HFT. Mahmoodzadeh and Genc¸ay (2014) show that HFT profitability increases as a smaller tick affords HFTRs the opportunity to front-run indi-vidual (manual) traders by implementing sub-penny strategies. A direct implication of the latter is an increase in spreads for the manual traders and a decrease in spreads for the HFTRs. Coughenour and Harris (2004) show that front-running is easier for low-priced stocks and Uno and Shibata (2011) show that the decrease in spreads is also accompanied by an increase in adverse selection costs. So, crucially, the speed of quote adjustment substantially increases after a minimum tick size decrease (Chung et al.2008). As we will discuss in Sect.5.2, the suggested minimum resting time regulations target the speed of quote adjustment with an intention to limit HFT. A further area of interest originates from the interaction of HFT with alternative trading systems (or dark pools). To this end, Bartlett III and McCrary (2013) and O’Hara et al. (2015) show that there is often a trade-off between HFT and trading in alternative venues: reducing the tick size leads to an increase in HFT (that is, an increase in displayed liquidity) and a decrease in trading in alternative trading systems (that is, a decrease in un-displayed liquidity). The authors further argue that the recent proposal to increase the minimum tick size for small capitalization stocks may potentially harm organized exchanges and HFT and shift trading to alternative trading systems. In Table4, Panel B, we show the studies that discuss the implications of a large tick size for HFT and market structure. All studies show that a large relative tick size attracts more HFTRs, thus increasing the latter’s liquidity provision. Hagstro¨mer and Norde´n (2013) demonstrate that the share of trading activity attributed to HFT strategies increases with the minimum tick size. O’Hara et al. (2015) show that, in contrast to the recent SEC proposals, in today’s ‘‘high frequency’’ markets, there is little evidence that stocks with a higher relative tick size (a large tick size relative to the stock price) have greater liquidity. Equally, Yao and Ye (2015) show that a large relative tick size decreases liquidity but increases HFT liquidity provision. From a market microstructure perspective, the latter result has wide implications: increasing the tick size in order to enhance liquidity for the least-active stocks may attract more liquidity supply from HFTRs but the authors find no evidence that it will attract more trading volume. Clearly, this area is under-researched and future research will show how liquidity provision works in both this and alternative market settings.
Table 4 Empi rical studies on the effect of a mini mum tick size ch ange on execution spe ed and HFT Reference Market (s) (n o. of assets) Period(s) (approxi mate) Sample / frequency Ma in find ing(s) after ti ck size red uction Impli cations of a small er tic k for market struct ure Panel A: The effect of tick size de crease on execution speed and HFT Mahmoo dza deh and Genc ¸a y ( 2014 ) EB S (4 curren cy pairs) May 11–Oct 11 EBS TAQ and depth A reduction (increase ) in spr eads fo r H FTs (manu al traders) Prov ides H FTrs with the oppo rtunit y to impl emen t sub-penny jumping strat egies, front-run nin g manual traders Uno and Shibat a ( 2011 ) Toky oSE (1457 ) De c 09–J an 10 TAQ TokyoS E A drop in spreads an d an increase in ad verse se lection costs Lea ds to a shift towards m o re H FT Coughen our an d Harris ( 2004 ) NY SE (1811 ) D ec 00–Feb 01 TAQ U S Fron t-running is easier for the low pr iced stocks but special ist profi ts in oth er sto cks decrease Lea ds to an increase H F T profits for specialists handl ing low priced stock s Chung et al. ( 2008 ) NY SE (1450 ), NASDAQ (2713 ) Oc t 05–Dec 05 TAQ U S The speed of quote ad justment incre ases after decimalization Tick size has a significant impact on the speed of quot e adjustm ent Bart lett III and McCrary (2013 ) US exc hanges (962) Jan 01–De c 1 1 TAQ U S Sub-penny pr icing is associ ated with mo re HFT and a decrease in the tra ding of un-di splaye d liquidi ty A reform to change the tic k sizes should be accompani ed by limitations on exchanges’ make r/taker fees in or der to minim ize possibl e market manipu lation Reference Ma rket(s) (no. of as sets) Per iod(s) (approxi mate) Sample /frequency Main find ing(s) Impli cations of a large relative tick for market struct ure Panel B: The effect of a large minimum ti ck on marke t m aking Hagstro ¨mer and N orde ´n( 2013 ) OMXS 30 (30) Feb 10–Ma r 1 2 ITCH A large tick size mak es market making more profitabl e and arb itrage trading mo re costly In creases the share of trading activity due to marke t-mak ing HFT s
Table 4 continu ed Reference Ma rket(s) (no. of as sets) Per iod(s) (approxi mate) Sample /frequency Main find ing(s) Impli cations of a large relative tick for market struct ure Yao an d Y e ( 2015 ) NASDAQ and NY SE (1 17 pairs) 10/10/ 2014 NA SDAQ TotalVi ewITCH A large relative tick size decreases liqui dity but increases H F T liqui dity provisi on A ttracts mo re liqui dity by HFT s and increase s market mak ing rev enue O’Hara et al. ( 2015 ) NYSE (360) May 12–J un 12 TAQ US A larger relati ve tick size does not subst antially enhance sto ck liqui dity H FTs par ticipate more in tradi ng for sto cks with larger relative tic k sizes Acronyms are de fined in Table 1
3.1.4 Tick size changes and volatility
This last sub-section on market quality indicators investigates the effect of a change in tick size on volatility. In Table5, we present the studies that show the reaction to volatility of a change in the minimum tick size or equivalently the level of price discreteness. Most studies confirm that a large tick size has a negative impact on volatility. Hau (2006) shows that a larger tick size increases the costs of speculation4and overall stock return volatility. Ke et al. (2004) show that the tick size is more binding on volatility in the middle of the trading day and Jiang et al. (2009) show that the effect of tick size on volatility is more pronounced on dealer markets rather than on limit order markets. Mu¨nnix et al. (2010) demonstrate the minimum tick size has a wider impact on the microstructure of financial returns. Crucially, the tick size can alter the tail behaviour of the return distribution; a larger tick size can lead to heavier tails. In relation to the latter and the effect of a minimum tick size on price diffusion, La Spada et al. (2011) show that a decrease in tick size leads to more volatility clustering, or equivalently to a higher return autocorrelation.5
3.2 Effect of tick size changes on market structure
3.2.1 Effect of tick size changes on market design
3.2.1.1 Tick size changes’ effects on market design In this section, we survey the studies that investigate the implications of a tick size change on market design. We sort studies first by sample, and then in ascending order by end date of the used sample. As expected, several studies present results that may be classified to more than one sub-section but we avoid any overlap by focusing on the main implications for market structure and market quality. In Table6, the main focus is on how the implementation of the minimum tick size rules affects trading across different trading mechanisms.
Clearly the majority of work on market design involves a comparison of NASDAQ with NYSE, thus most studies concentrate on the comparison of samples between the two exchanges. Nevertheless, the study by Huang and Stoll (2001) concentrates on the dif-ferences between NYSE, an auction market, and LSE, a dealer market. The authors argue that microstructure characteristics, such as the tick size, are endogenous to market struc-ture; that is the difference between an auction and a dealer market. Empirically, the findings of Huang and Stoll (2001) are confirmed by Chung and Chuwonganant (2002) who show that execution costs are lower in auction markets than they are in dealer markets. Theoretically, for a dealer market, Kadan (2006) shows that the welfare of investors is a function of the number of dealers in the market; if the number of dealers in the market is large, investors will prefer a small tick size. The latter result is in contrast to the policy of reducing the tick size across all contracts because if the number of dealers in a stock is small, then setting a large tick size may benefit investors.
The studies that investigate the effect of tick size changes on the NYSE show that a decrease in tick size leads to a reduction in spreads and depths at the best quote. Bacidore et al. (2003) argue that a smaller tick leads to less displayed liquidity on the order book, but that that has no effect on execution quality. Goldstein et al. (2010) show that
4
In Table4, Panel B, Hagstro¨mer and Norde´n (2013) show that a larger tick makes arbitrage trading more costly (see also Chen et al.2009).
5
On a related subject, French and Foster III (2002) show that the decrease in tick size does not affect the observed increase in stock return variance following a stock split.
Table 5 Empi rical studies on the effect of a mini mum tick size on vol atility Reference Market(s) (no. of asse ts) Period( s) (appr oximate) Sample / frequenc y Main findin g(s) afte r tick size reduction Impli cations of discret eness for market struct ure French and Foster III ( 2002 ) A MEX (1590 split s) Jan 96–Dec 98 CRS P Reducti on not one of the cause s o f observed increa ses in sto ck return va riances follow ing sto ck split s Does not affect the post -split variance incre ase Hau ( 2006 ) CAC 40 Index stocks Jan 95–Dec 99 TAQ Paris Bourse Intraday vola tility of individu al sto cks increa ses by more than 30% due to tick size var iations A larger tick increase s stock retur n volatili ty and increa ses the costs of specul ation Ke et al. ( 2004 ) Taiwan SE (80) Jan 98–Dec 99 TAQ Taiwan SE A larger tick size is associ ated with a wider bid –ask spread, larger vol atility, and mo re negat ive autoc orrelation A larger tick size tend s to b e bin ding when bid–ask spre ads are narrowe r and return volatility is sm aller in the middl e o f the tradi ng period Jiang et al. ( 2009 ) N ASDAQ and NYSE (895 pairs) May 01–J ul 01 TAQ US Post-deci malizat ion, NA SDAQ vol atility and costs are higher than for NYSE stocks The differenc es cannot be attribu ted to the char acteristics of the sto cks traded in the two market s Mu ¨nnix etal. (2010 ) N YSE (5 0) Jan 07–Dec 07 TAQ US The tic k size contribu tes to the decay of the cor relation coef ficient towards small er return int ervals The tick size has a large impac t o n the struct ure of finan cial return distrib utions La Spad a et al. ( 2011 ) N YSE (5 ) ± 100 Jun 97 and Ja n 0 1 TAQ US Reducing the tic k size leads to an increase in return au tocorrel ation A decr ease in tick size leads to mo re cluste red vol atility. Acronyms are de fined in Table 1
Table 6 Empi rical studies on the effect of a mini mum tick size on market desig n Reference Market (s) (no. of assets) Period(s) (approxi mate) Sample / frequenc y Main find ing(s) after tic k size reduction Impli cations of a small er tick for market structure Alexan der and Peterson ( 2002 ) NY SE (230,1 34 pairs of short-sell orders) Jun 97–J ul 97 NBBO Decim alization led to a bett er exec ution of short market or der but to a worse exe cution fo r short at-the -quote li mit or ders A small tick is in contras t w ith the obje ctives of the Uptick Ru le Chak ravarty et al. ( 2004 ) NY SE (7 9) Oc t 00–Ma r 0 1 and Apr 00–Jun 00 NBBO Decim alization led to a decr ease in dept h and spr eads Redu ces bin ding const raints and incre ases price com petition Kada n ( 2006 ) Theory Theory Theory Change depend s o n the number of dealers in the market Ch ange will have an ambigu ous effect on spreads Bacidor e et al. ( 2003 ) NY SE (1 58 pairs) De c 00–Fe b 0 1 SOD & NY SE Master Files A dec rease in li mit or der size an d an increase in limit order cancellations Less dis playe d liquidi ty on the limit order book but exec ution quality is not affected Gold stein et al. ( 2010 ) NY SE (3 00) Jun 00 and Mar 01 TAQ NBBO participation by non-NY SE venues dec lined A venues abilit y to attract trades improv es as the tick decr eases Chan and Hwa ng ( 2002 ) SE HK (6 38) May 96 and D ec 9 7 TAQ SEHK Follow ing a tick size reduc tion, spreads dec rease and depths increase Inc reases market qual ity in a pure order-driven market Huang and St oll ( 2001 ) LS E and NYSE (19 pairs) Jan 95–De c 9 5 TAQ US & TAQ LSE Spreads and quot e sizes are related to the abse nce of ti ck sizes in dealer market s Marke t cha racterist ics are endog enous to the market struct ure Bess embind er ( 2000 ) NA SDAQ (765) Jan 95–De c 9 5 TAQ US Quote d and effective bid –ask sprea ds drop w hen tick size dec reases. There is no evid ence of a reduction in liquidi ty with the sm aller tick size Ch anges in the ti ck size can affec t equi librium spreads on a dealer market and the relation between tic k size and market qual ity is mo re complex than the impos ition of a constr aint on minim um spre ad widths Biais et al. ( 2010 ) N A SDAQ & ISLAND (7 pairs) Mar 00 and Jun 01 NA SDAQ Spreads fel l for both markets after NASDAQ dec imaliza tion Co mpetition amo ng market s complem ents competi tion among trader s
Table 6 continu ed Reference Market (s) (no. of assets) Period(s) (approxi mate) Sample / frequenc y Main find ing(s) after tic k size reduction Impli cations of a small er tick for market structure Rone n and Weaver ( 2001 ) AMEX (324) Apr 97–Jun 97 TAQ Amex A red uction in the mini mum tick dec reases spr eads and vol atility but not depth Impro ves market qual ity but also enc ourages queue-j umping in the order book Chung and Chuwong anant ( 2002 ) NY SE (2 223) May 97–J ul 97 TAQ US The minim um pr ice variat ion is a bin ding const raint on absol ute spre ads ev en after the ti ck-size reduc tion, especially for low-p rice and/ or large-volum e stocks Redu ces price rigidity and increa ses price competi tion Chung and Chuwong anant ( 2004 ) NA SDAQ (2073 ), NYSE (2242 ) May 97–J ul 97 TAQ US Smaller tick sizes are valu able in reducin g market fric tion only if market make rs com pete on price w ith public traders Execut ion costs are lower in auction market s than in pure dealer market s Zhao and Ch ung ( 2006 ) NY SE (1 746) Nov 00 TAQ US Decim alization led to an increa se in inform ation-base d trading Raise s the informat ional efficien cy of asset prices Chien et al. ( 2014 ) Taiwan SE (50) Nov 04–M ay 05 TEJ A thinner order book and a decrease in its inform ation cont ent Lower s the incenti ve to of fer liquidi ty and reduces the rela tive informa tion conte nt of the order book Portni aguina et al. ( 2006 ) Simu lation Simu lation Simu lation A sm aller tick size facili tates the special ist’s abil ity to step ah ead of the limi t orde r book , res ulting in a red uction in the cumulativ e dept h o f the limit or der book at prices ab ove the mini mum tick Leads to an increa se in the spe cialist participation and spe cialist pr ofit increases slightly for sm all market orde rs, and consider ably fo r large market order s Acronyms are de fined in Table 1
decimalisation increases quote competition between exchanges. Chan and Hwang (2002) argue that market quality increases on a limit order book market after the tick size decrease. However, regarding dealer markets, Bessembinder (2000) argues that the rela-tionship between tick size and market quality is relatively more complex than is hypoth-esized. In relation to the latter, Chakravarty et al. (2004) and Chung and Chuwonganant (2002) show that the smaller tick increases price competition on the limit order book, hence reducing price rigidity, and Zhao and Chung (2006) show that a smaller tick increases the informational efficiency of prices. The latter is clearly related to price dis-covery studies which will be discussed in Sect.3.2.2. With regard to the implications of a tick size change to market structure, Alexander and Peterson (2002) show that a small tick is in contrast with the objectives of the Uptick Rule.6 In addition, a smaller tick size encourages front-running in the limit order book (Ronen and Weaver 2001 and Portni-aguina et al.2006). Finally, Biais et al. (2010) show the effect of the tick size change on market structure through the change in competition between Island and Nasdaq. In par-ticular, their study shows that Island traders undercut competition with Nasdaq traders by taking advantage of a finer tick size and spreads decreased further in Island after the reduction in the tick size for Nasdaq stocks.
3.2.1.2 Effect of tick size changes on institutional versus retail traders In Table7, we present the set of studies that discuss the implications of a minimum tick size change both for institutional traders and for retail traders. One difficulty with this type of study is the definition of institutional traders. Papers in this field either infer institutional traders by classifying trade size (see Oppenheimer and Sabherwal2003and Lin et al.2009) or they use proprietary datasets which directly classify trader types (see Bollen and Busse2006
and Chakravarty et al.2005).
Clearly, the most significant finding of this literature is that a reduction in tick size does not have a uniform effect across all trader types. On a limit order market such as the Hong Kong Stock Exchange or the NYSE, reducing the tick size leads to a deterioration in market depth and hence a decrease in liquidity for the larger institutions (Pan et al.2012
and Goldstein and Kavajecz2000). In relation to the latter, Lin et al. (2009) show that if an exchange facing competition from a another exchange reduces its tick size then institu-tional order flow may potentially migrate to the competing exchange. Oppenheimer and Sabherwal (2003) and Chakravarty et al. (2005) report that retail traders appear to be trading more frequently with a smaller tick size.7 Conversely, institutional traders trade less frequently and also fragment their orders at a lesser rate (less stealth trading) which in turn decreases adverse selecting costs for large and medium sized trades. Jones and Lipson (2001) show that the move to a smaller tick size increases execution costs for institutional investors. However, Chakravarty et al.(2005)document that—whilst in general the finding of Jones and Lipson (2001) is correct—for the institutional investors who work their orders over multiple days, trading costs declined. Finally, Bollen and Busse (2006) document an increase in trading costs for large orders originating from pension funds, mutual funds and hedge funds, hence confirming the finding that institutional investors may be damaged by a move to a finer price grid.
6 The Uptick rule allowed the short selling of securities on upticks only. The rule was eliminated in 2007
and in 2010, SEC introduced the Alternative uptick rule which imposes restrictions on the stocks that are triggered by a circuit breaker only. Seehttp://www.sec.gov/news/press/2010/2010-26.htm.
7
For the stock exchange of Thailand, Pavabutr and Prangwattananon (2009) show that retail trading activites are not affected by the minimum tick size decrease.
Table 7 Empi rical studies on the effect of a mini mum tick size on ins titutio nal ve rsus retail tradi ng Reference Mar ket(s) (no. of asse ts) Period(s) (approxi mate) Sam ple/ frequ ency Main findin g(s) after tic k size reduction Impli cations of a small er tick for market structure Boll en and Busse ( 2006 ) US exchanges (440 U S mu tual funds) Jan 97–No v 97, Apr 00–Aug 00 and Apr 01–Aug 01 Dail y For large order s from pension fu nds, mu tual funds, and hedge funds, tighter bid–ask spr eads do not necessaril y impl y lower tradi ng costs An increase in trading costs for som e actively mana ged funds. Pan et al. ( 2012 ) HKEx (200) Apr 06–Oct 06 HKEx: or der book depth An increase in the transac tion costs for large ins titutio ns De creases liquidi ty for the more liquid sto cks on a pure limit order market Gold stein and Kavajecz ( 2000 ) NYSE (100) May 97–S ep 97 Supe rDOT N YSE A decline in spre ads and a decline in de pths througho ut the enti re limit order book Benefi ts (wo rse of f) mo re retail or ders (larger orders) Pavab utr and Prangw attananon ( 2009 ) SET (79) Oc t 01–No v 0 1 TAQ SE T The tick red uction is associated with a dec line in spreads, quot ed and accu mulate d market de pths Ha s n o signific ant impa ct on retail inv estors’ trading activities Griffiths et al. ( 1998 ) TSE (60) Jan 96–J ul 96 TAQ TS E The tick size reduction led to signifi cantly lower returns on non-b lock and small trades for the upstairs traders and the desig nated market markers Sma ller retur ns for upst airs traders and market make rs Oppenh eime r and Sabherwal ( 2003 ) TSE and U S Exchan ges (126 cro ss-listed ) Jan 01–Feb 01 an d Mar 01–Apr 01 TAQ U S an d TSE Post-US decima lization, U S tradi ng of TS E cross-listed sto cks increa ses but this increa se is not at the expense o f TS E volum e. Leads to a d ecrease in spreads and an increase in retail-sized tra ding Lin et al. ( 2009 ) Paris (1 5), NY SE (1 6) Jan 01–F eb 01 TAQ U S an d Eur onext Decima lization mad e the US market less compe titive for ins titutions trading French sto cks Leads to a m igration of instituti onal order flow Jones and Lip son ( 2001 ) NYSE (1690 ) ± 100 days around Jun 97 TAQ U S Realized exe cution costs increased fo r insti tutional trades It may lead to a reduction of liquidi ty fo r insti tutional trades
Table 7 continu ed Reference Mar ket(s) (no. of asse ts) Period(s) (approxi mate) Sam ple/ frequ ency Main findin g(s) after tic k size reduction Impli cations of a small er tick for market structure Chak ravarty et al. (2005) NYSE (34) Nov 00–J an 01 TAQ U S (Pl exus) Post-deci malizat ion ins titutio nal tradi ng costs declined, mo re so fo r stock s where the minim um tick sizes were like ly to have bee n binding. Benefi ts tho se ins titutions that are worki ng their orders on the exc hange floor Chak ravarty et al. (2005) NASDAQ and NY SE (3 04 pairs) Jan 01–F eb 01 TAQ U S Post-deci malizat ion, the percentage of the spread due to the adve rse selection co mponent increased but the dollar adve rse selection co st dec reased Leads to less steal th trading and less instituti onal trading over all Acronyms are de fined in Table 1
3.2.1.3 Tick size changes and dark pool trading There are a limited (but increasing) number of studies that investigate the implications for market structure in a trading environment that is characterized by market fragmentation. In particular, the element of interest here is the provision of liquidity when an exchange competes with an alternative trading system, such as a dark pool on which there is no regulated minimum tick size. From a theoretical perspective, Buti et al. (2013) investigate how the tick size affects liquid and less liquid stocks on the limit order book. The authors show that reducing the tick size may have detrimental effects on less liquid stocks which disappear if the limit order book faces competition from alternative trading systems. Crucially, these results tend to support SEC’s proposed plans to increase the tick size for the less liquid stocks. These results are con-firmed empirically in Werner et al. (2015). It is worth mentioning that these results complement the findings of Bartlett and McCrary (2013) and O’Hara et al. (2015), dis-cussed in Sect.3.1.3. In particular, the findings of the latter show how HFTRs are responsible for the shift in liquidity from a dark pool to the limit order book because they increase the supply of liquidity following a tick size decrease. However, the question of how multiple tick size regimes affect market liquidity in a fragmented market remains to be answered.
3.2.2 Effect of tick size changes on the price discovery process
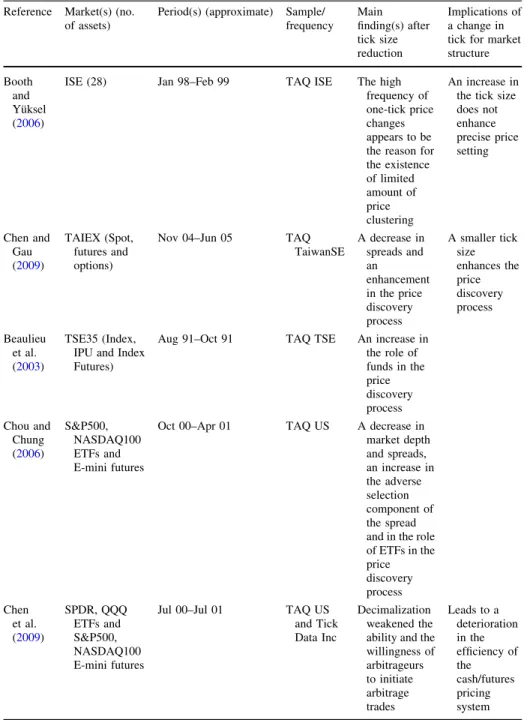
In this section, we present the studies that investigate the effects of changes in the tick size on the price discovery process. Studies in this area focus on the interaction of trading between the spot and derivatives contracts. We present the set of studies in Table8.
The empirical literature agrees that a decrease in the minimum tick size enhances the price discovery process (Chen and Gau2009; Beaulieu et al.2003 and Chou and Chung
2006). In particular, Beaulieu et al. (2003) and Chou and Chung (2006) also document an increased participation of funds in the price discovery process following a decrease in the minimum tick size. Booth and Yu¨ksel (2006) confirm the above findings for the Istanbul stock exchange. Finally, Chen et al. (2009) show that a small tick reduces the willingness of arbitrageurs to initiate arbitrage trades, a finding that is related to the profitability of investments in a small tick size regime and leads to a loss in pricing efficiency.8
4 Related research: the minimum trade unit and odd-lot trading
In this section, we discuss the empirical literature on a subject closely related to the minimum tick size regulations. The minimum trade unit (MTU) refers to the minimum amount of shares that can be traded in a single transaction. In most stock exchanges the MTU is equal to one share. Notable examples of equity markets where the MTU is not one share are the Toronto, Tokyo, Hong Kong, and Taiwan exchanges. Research on the MTU is scant but, as recent research has documented, the pervasiveness of HFT has shifted the interest to this field as HFTRs tend to trade on relatively small quantities. We therefore present the empirical papers in the field with the intention to inform the reader of a possible future topic for research. We present the studies on the MTU in Table9, Panel B.
8 In two related studies, Jakob and Ma (2004) and Graham et al. (2003) investigate the effect of a tick size
decrease on the ex-dividend day stock price behaviour, showing that the existence of a minimum tick is not responsible for the ex-dividend price behaviour, that is the empirical finding that prices drop by less than the dividend amount on the ex-dividend date (see also Bali and Hite,1998).
Amihud et al. (1999) investigate the effect of voluntary reductions in the MTU at the Tokyo Stock Exchange; they find an increase both in liquidity and valuation associated with MTU reductions. Hauser and Lauterbach (2003) test the asset pricing effects of MTU Table 8 Empirical studies on the effect of a minimum tick size on price discovery
Reference Market(s) (no. of assets)
Period(s) (approximate) Sample/ frequency Main finding(s) after tick size reduction Implications of a change in tick for market structure Booth
and Yu¨ksel (2006)
ISE (28) Jan 98–Feb 99 TAQ ISE The high frequency of one-tick price changes appears to be the reason for the existence of limited amount of price clustering An increase in the tick size does not enhance precise price setting Chen and Gau (2009) TAIEX (Spot, futures and options)
Nov 04–Jun 05 TAQ TaiwanSE A decrease in spreads and an enhancement in the price discovery process A smaller tick size enhances the price discovery process Beaulieu et al. (2003) TSE35 (Index, IPU and Index Futures)
Aug 91–Oct 91 TAQ TSE An increase in the role of funds in the price discovery process Chou and Chung (2006) S&P500, NASDAQ100 ETFs and E-mini futures
Oct 00–Apr 01 TAQ US A decrease in market depth and spreads, an increase in the adverse selection component of the spread and in the role of ETFs in the price discovery process Chen et al. (2009) SPDR, QQQ ETFs and S&P500, NASDAQ100 E-mini futures
Jul 00–Jul 01 TAQ US and Tick Data Inc
Decimalization weakened the ability and the willingness of arbitrageurs to initiate arbitrage trades Leads to a deterioration in the efficiency of the cash/futures pricing system Acronyms are defined in Table1
Table 9 Empi rical studies on the minim um transac tion size Reference Market (s) (n o. of assets) Period(s) (approxi mate) Sample / frequency Main effect(s) of MTU reducti on Impl ication s o f an MTU reduction for market structure Panel A: Empirical research on the minim um trade unit (MTU) Amihu d, Mendelson and Uno ( 1999 ) Toky o Stock Exchan ge (66) Jan 91–Dec 96 Dail y Increase in valua tion and liqui dity Comp anies can increa se their investo r base, valuati on effi ciency and liquidi ty by reducin g MTU Hauser and Lauterbach (2003 ) Tel Aviv St ock Exchan ge (987) Jun 98–Fe b 0 0 Dail y Increase in valua tion. The same effec t is not found for the most illi quid sto cks Gozlu klu et al. ( 2015 ) Bo rsa Italia na (55) De c 01–Feb0 2 TAQ Increase in liquidi ty and dec rease in adverse selection costs The remov al of the MTU const raint faci litates the pa rticipat ion of retail trader s. This has benefic ial effects o n li quidity and adve rse selection co sts Reference Market (s) (no. of asse ts) Period(s) (approxi mate) Sampl e/frequency Main find ing(s) Impli cations of odd-lot tradi ng for market structur e Panel B: Empirical research on odd -lot tra ding Wu ( 1972 ) N YSE (100) Jan 37–De c 6 7 W eekly Ste ady decrease in the propo rtion of odd-l ot trading O dd-lot traders trade again st the market an d are theref ore price stabi lizers Lakon ishok and Mabe rly ( 1990 ) N YSE (all listed ) Jan 62–De c 8 6 S&P dail y Odd-l ot trading is higher on Monda ys than in the other days In dividua l inv estors may cont ribute to the Weekend effect Dyl and Maberl y ( 1992 ) N YSE (all listed ) D ec 66–J an 86 S&P dail y The ratio of odd-l ot sa les to odd-lot purchases substant ially decreases at the turn of the year and such decrease is highly significa nt in expl aining turn or the year retur ns In dividua l inv estors may cont ribute to the January effect
Table 9 continu ed Reference Market (s) (no. of asse ts) Period(s) (approxi mate) Sampl e/frequency Main find ing(s) Impli cations of odd-lot tradi ng for market structur e O’Hara et al. ( 2014 ) N ASDAQ (1 20) Jan 08–De c 0 9 TAQ Odd-l ot transact ions are commo n and substant ially contribu te to price discover y Em pirica l ana lyses w ith TAQ data may lead to biased result s John son et al. ( 2014 ) N ASDAQ (3 401) Jul 10–Ma r 1 1 TAQ Intent ional odd-lot trades contribu te more to price discover y than circumst antial odd lot trades Rel ative impor tance of intent ional odd-l ot tradi ng Acronyms are de fined in Table 1
changes at the Tel Aviv Stock Exchange; their results show an increase (decrease) in price level and demonstrate mixed evidence regarding the change in price noisiness after MTU reductions (increases). Gozluklu et al. (2015) examine the natural experiment of Borsa Italiana (the main Italian Stock Exchange), where in 2002 the MTU was reduced to one share by the exchange; they find a substantial increase in liquidity and a concurrent decrease in adverse selection costs after the event.
Related to the research on the MTU, a handful of studies examine the effects and the sources of odd-lot trading; these papers mostly focus on the US markets. Odd-lot trades are those trades which are executed at a size lower than the round lot, and they are subject to different handling and reporting rules than the round lot. A recent SEC Release (SEC
2014b) discusses odd lot trading in US markets and how it was affected by changes in
reporting requirements. We present the set of empirical studies in this field in Table9, Panel B. Wu (1972) provides an early study of odd-lot trading and its trend over time. Some papers use odd-lot trades as a proxy for individuals’ transactions and investigate time of the week and of the year price anomalies (see Dyl and Maberly1992; Lakonishok and Maberly1990). After the advent of high frequency trading however, the assumption that odd-lots are mainly originated by individual investors is inappropriate; accordingly, O’Hara et al. (2014) show that odd-lot trading is partly attributable to HFT and they document a bias in empirical studies which ignore odd-lots. Developing O’Hara et al. (2014), Johnson et al. (2014) compare circumstantial odd-lots and intentional odd-lots.
4.1 Research on the minimum trade unit
At the Tokyo Stock Exchange, changes in the MTU are voluntary, as they are decided by a meeting of the companies’ directors. Amihud et al. (1999) examine the effects of voluntary reductions in the MTU in the Japanese equity market. Consistent with the view that companies reduce the MTU in order to increase the investor base, the results show an increase in the number of individual investors after the MTU reductions. Amihud et al. (1999) also document positive cumulative abnormal returns after both the announcement and the actual reduction in the MTU. Furthermore, they find that trading volume and liquidity, measured by the Amihud’s illiquidity ratio, increase after the MTU changes. Amihud et al. (1999) argue that the value and liquidity effects are due to the increase in the investor base; specifically, if more investors hold the stock, information availability on the fundamental value increases, thereby increasing both liquidity and valuation.
Hauser and Lauterbach (2003) examine a set of changes—both increases and decreases, decided by an exchange board—in the MTU at the Tel Aviv Stock Exchange between 1998 and 1999. After MTU increases they find a decrease in trading volume, which is used as a proxy for the investor base, a decrease in valuation and an increase in return volatility, which is used as a proxy of price noisiness; after MTU decreases, they document an increase in trading volume, an increase in valuation and an increase in return volatility. They also estimate a model relating stock returns around the MTU changes to changes in trading volume, which is used as a proxy of trading volume, and in return volatility; consistent with Merton’s (1987) model, the coefficient of volume change is positive and the coefficient of volatility change is negative. The cross-sectional variation of the results reveals further interesting differences; in particular, extremely thin trading stocks lose value after an MTU reduction and drive the increase in price noisiness when considering the whole sample. Hauser and Lauterbach (2003) argue that an increase in investor base can be detrimental to value if the joining traders are predominantly noise traders or speculators.