VVB VVB LAUFERSWEILER VERLAG STAUFENBERGRING 15 D-35396 GIESSEN Tel: 0641-5599888 Fax: -5599890 [email protected] www.doktorverlag.de
VVB LAUFERSWEILER VERLAG
édition scientifique
9 7 8 3 8 3 5 9 6 5 3 8 6 ISBN: 978-3-8359-6538-6
STEPHAN JUNG
+
ABIOTIC CHALLENGES FOR THE MAIZE PM H
-ATPASE
STEPHAN JUNG
Abiotic stress – A challenge for the master enzyme
+plasma membrane H -ATPase. A case study for
maize with special consideration of salt stress
and Mg deficiency
VVB
VVB LAUFERSWEILER VERLAG
édition scientifique
A thesis submitted for the requirement of the
doctoral degree in agricultural sciences
Faculty of Agricultural Sciences,
Nutritional Sciences, and Environmental Management
Justus Liebig University Giessen
Das Werk ist in allen seinen Teilen urheberrechtlich geschützt.
Die rechtliche Verantwortung für den gesamten Inhalt dieses Buches liegt ausschließlich bei dem Autor dieses Werkes.
Jede Verwertung ist ohne schriftliche Zustimmung des Autors oder des Verlages unzulässig. Das gilt insbesondere für Vervielfältigungen, Übersetzungen, Mikroverfilmungen und die Einspeicherung in und Verarbeitung durch
elektronische Systeme. 1. Auflage 2017
All rights reserved. No part of this publication may be reproduced, stored in a retrieval system, or transmitted,
in any form or by any means, electronic, mechanical, photocopying, recording, or otherwise, without the prior
written permission of the Author or the Publishers. st
1 Edition 2017
© 2017 by VVB LAUFERSWEILER VERLAG, Giessen Printed in Germany
VVB LAUFERSWEILER VERLAG
STAUFENBERGRING 15, D-35396 GIESSEN Tel: 0641-5599888 Fax: 0641-5599890 email: [email protected] édition linguistiqueInstitute of Plant Nutrition Justus Liebig University Giessen
Prof. Dr. Sven Schubert
Abiotic stress – A challenge for the master enzyme plasma
membrane H
+-ATPase. A case study for maize with special
consideration of salt stress and Mg deficiency
A thesis submitted for the requirement of the doctoral degree in agricultural sciences Faculty of Agricultural Sciences, Nutritional Sciences,
and Environmental Management Justus Liebig University Giessen
Submitted by
Stephan Jung
from AachenDate of thesis disputation: February 1, 2017
Examination Commission
Chairperson: Prof. Dr. Joachim Aurbacher
Supervisor: Prof. Dr. Sven Schubert
Co-supervisor: Prof. Dr. Sven Schubert
Examiner: Prof. Dr. Bernd Honermeier
Examiner: Prof. Dr. Rod Snowdon
Table of contents
1. Introduction... 1 1.1 Abiotic stress ... 1 1.2 Maize ... 2 1.3 Plasma membrane H+ -ATPase ... 3 1.4 Mg deficiency ... 41.4.1 Mg – the forgotten macronutrient in crop production ... 4
1.4.2 Stumbling blocks for the determination of concentration in Mg-deficient plant material .. 9
1.5 Salt stress ... 11
1.6 Hypotheses ... 15
2. Materials and methods ... 17
2.1 Stumbling blocks for chlorophyll concentration measurements in Mg-deficient plant material ... 17
2.1.1 Plant cultivation and harvest... 17
2.1.2 Pigment extraction ... 18
2.1.3 Determination of chlorophyll concentrations ... 18
2.1.4 Statistical analyses ... 19
2.2 Effect of Mg deficiency on plasma membrane H+ -ATPase activity and the implications for maize growth ... 20
2.2.1 Plant cultivation and harvest ... 20
2.2.2 Analyses of cation, chlorophyll, sugar, and protein concentrations ... 21
2.2.3 Analyses of DNA content ... 22
2.2.4 Determination of apoplastic pH ... 22
2.2.5 Plasma membrane (PM) isolation ... 23
2.2.6 Kinetic assays of hydrolytic PM H+ -ATPase activity ... 23
2.2.7 Measurement of proton-pumping activity ... 24
2.2.8 Relative abundance of RNA plasma membrane H+ -ATPase isoforms ... 25
2.2.9 Gel electrophoresis and immune detection of plasma membrane H+ -ATPases ... 27
2.2.10 Statistical analyses ... 27
2.3 Effect of salt stress on plasma membrane H+ -ATPase activity and its implications for kernel development of maize ... 27
2.3.1 Plant cultivation and harvest... 27
2.3.2 Sugar determination ... 29
2.3.3 Acid invertase enzyme extraction and activity measurements ... 30
2.3.5 Kinetic assays of hydrolytic PM H+
-ATPase activity of maize kernels ... 30
2.3.6 Measurement of proton-pumping activity of PM H+-ATPase of maize kernels ... 31
2.3.7 Relative abundance of RNA plasma membrane H+
-ATPase isoforms ... 31
2.3.8 Gel electrophoresis and immunodetection of plasma membrane H+
-ATPase ... 31
2.3.9 Statistical analyses ... 31
3. Results ... 33
3.1 Stumbling blocks for chlorophyll concentration measurements in Mg-deficient plant material ... 33
3.1.1 Effect of Mg deficiency on maize growth and N-tester results ... 33
3.1.2 Effect of addition of MgCO3 during extraction of maize leaves grown under Mg
deficiency on chlorophyll concentrations ... 35
3.2 Effect of Mg deficiency on plasma membrane H+-ATPase activity and the implications for
maize growth ... 37
3.2.1 Effect of slowly developing Mg deficiency on maize growth... 37
3.2.2 Effect of Mg deficiency on chlorophyll, sugar, and protein concentrations of maize . 39
3.2.3 Effect of Mg deficiency on DNA contents of maize ... 43
3.2.4 Effect of Mg deficiency on apoplastic pH of young developing leaves ... 45
3.2.5 Effect of Mg deficiency on plasma membrane H+
-ATPase activity ... 46
3.3 Effect of salt stress on plasma membrane H+
-ATPase activity and its implications for kernel development of maize ... 53
3.3.1 Effect of salt stress on maize yield determinants ... 53
3.3.2 Effect of salt stress on maize kernel sugar metabolism ... 57
3.3.3 Effect of salt stress on maize kernel PM H+
-ATPase activity ... 61
4. Discussion ... 67
4.1 The photometric standard method using acetone extracts to determine chlorophyll is applicable to Mg-deficient maize tissue ... 67
4.2 Reduced assimilate availability in growing sink tissue is responsible for early growth inhibition under Mg deficiency in maize ... 70
4.3 Reduced cell division in growing sink tissue is responsible for early growth inhibition of maize under Mg deficiency ... 71
4.4 Altered PM H+
-ATPase activity is responsible for reduced leaf apoplastic acidification reducing extension growth under Mg deficiency in maize ... 72
4.5 Source leaf sugar supply limits maize kernel development under salt stress ... 77
4.6 Sink hexose supply limits maize kernel development under salt stress ... 78
4.7 Plasma membrane H+
-ATPase activity of young maize kernels is reduced under salt stress, inhibiting hexose uptake of the sink tissue, leading to kernel starvation ... 80
5.1 Reduced PM H+
-ATPase activity limits cell-extension growth under Mg deficiency in
maize……….84
5.2 Reduced PM H+ -ATPase activity limits maize kernel sugar uptake under salt stress ... 86
5.3 Contribution of the PM H+ -ATPase to physiological responses under abiotic stress differs depending on plant organ ... 88
6. Summary ... 90 7. Zusammenfassung ... 92 8. References ... 95 Appendix ... I Acknowledgment... IV Declaration ... VII
1. Introduction
1.1
Abiotic stress
The sessile nature of plants is a challenge: Abiotic stresses - arising from an excess or deficit in the
physical or chemical environment - are threatening the plants´ development on a regular basis. Examples for these physical or chemical constraints are: Nutrient excess or deficiency, heavy-metal toxicity, cold, heat, excess water, or water-limiting conditions. Even in agricultural systems, the
total avoidance of abiotic stress is nearly impossible for plants. Consequently, crops rarely achieve their genetically predetermined maximum yield potential. Boyer (1982) estimated that field-grown
crops in the United States just achieve 22% of their potential genetic yield due to abiotic stress. However, given the fact that plants face multiple situations with one or more abiotic stress events during their lifespan, plants have evolutionary determined strategies and mechanisms to cope with
abiotic stresses. The extent to which a specific plant can cope with abiotic stress depends on the stress intensity, the plant´s individual evolutionary set of available strategies, and their underlying
mechanisms to counter the stress impact. These sets of countermeasures are species or even genotype- specific. However, some strategies can be found in nearly all land plants, e.g. the strategy to accumulate osmotically active solutes under drought stress in order to decrease the osmotic
potential in cells to ensure water uptake by roots. Many others strategies and especially their underlying mechanisms are often very specific among plant species. Mostly they are still unknown even for important agricultural crop plants. Understanding of these strategies and mechanisms is
imperative in order to use this knowledge to increase yield security in the plant breeding process (Cramer et al., 2011). Improving crops by plant breeding is the only viable way, since crop plants
is limited. This is especially true for the most important crop plants on which world food security
depends on.
1.2
Maize
Maize is one of the world’s most important crop plants. It is the second largest agricultural commodity in terms of tons, stressing its worldwide importance. The world production of the
commodity maize increased from roughly 600 million tons in the year 2000 to over 1 billion in 2014 which means a yearly growth rate of 4% (FAO, 2015).
Maize or corn (Zea mays L.) belongs to the family Poaceae together with its ancestor the wild plant teosinte. Its origin is the region of Mesoamerica where the C4 plant was domesticated by selection of key mutations (Matsuoka et al., 2002). The grains are used for human and livestock consumption
as well as for the ethanol production; therefore, total grain yield is an important agronomical factor. There are two components of grain yield: Kernel number and kernel weight. Both components can
be negatively affected by abiotic stress. However, a lower kernel number is often partly compensated by a higher grain weight, depending on stress intensity and the physiological stage in which the stress occurs (Borrás et al., 2003). There is apparently an evolutionary-conserved
strategy to maintain the full kernel set. Schubert et al. (2009) developed salt-resistant maize hybrids which are able to maintain kernel set under salt stress. In contrast, kernel setting of salt-sensitive genotypes is affected by salt stress. This example shows that maize has an unexplored genetic
potential to implement strategies in future breeding processes which could prevent the reduction of yield due to abiotic stress. These strategies and their underlying mechanisms have to be identified
1.3
Plasma membrane H
+-ATPase
The plasma membrane (PM) H+-ATPase is the powerhouse of the plant metabolism, since it is
responsible for the energization of most transport processes in plants. The energization is conducted by the establishment of an electrochemical proton gradient across the plasma membrane (Palmgren, 2001). The active transport of protons is fueled with the substrate Mg-ATP (Hanstein et al., 2011).
The proton transport into the apoplastic space acidifies the cell wall. This acidification of the cell wall is a requisite for cell-extension growth (Hager et al., 1971; Dünser and Kleine-Vehn, 2015). Additionally, cations cross the plasma membrane through ion channels, attracted by the negative
membrane potential of the cytoplasm. The electrochemical gradient energizes transport processes of symporters and antiporters in the PM (Palmgren, 2001).
Since the PM H+-ATPase is so important for plant physiological processes, it is not astonishing that abiotic stress has an impact on the function of the enzyme (Palmgren, 1991; Falhof et al.,
2016). The enzyme has an auto-inhibitory domain at the C-terminus. Binding of effector molecules or phosphorylation at the auto-inhibitory domain has a strong influence on the enzymes activity.
There are two activity states: an auto-inhibited state, where ATP hydrolysis is only loosely coupled to H+ transport, and an upregulated state with tight coupling between ATP hydrolysis and H+ pumping (Falhof et al., 2016). There are various phosphorylation sites at the auto-inhibitory domain
that can be affected either by phosphorylation or dephosphorylation reactions caused by various environmental stimuli including abiotic stress. This flexibility of the enzyme regarding the H+
pumping activity can be used for breeding strategies. Therefore, alteration of the PM H+-ATPase activity can play an important role in strengthening mechanisms that help to counteraffect abiotic stress.
For example, Gévaudant et al. (2007) showed that salt resistance of tobacco was improved since
one isoform of PM H+-ATPase was constitutively activated and expressed in transgenic tobacco. It was confirmed that these transformed plants were able to increase the pH gradient at the plasma membrane of root cells. The electrochemical gradient that is generated by the PM H+-ATPase
energizes the SOS1 Na+/H+ antiporter. It is believed that the higher pH gradient increased the pumping activity of SOS1, which excluded potential toxic Na+ from the cytoplasm and increased growth of the transformed tobacco compared to the wildtype under salt stress. There are other
examples: It was also shown that the maize hybrid Pioneer 3906 was not able to maintain apoplastic acidification in developing leaves under salt stress, which resulted in a reduction of turgor-driven
cell-extension growth. In contrast, a salt-resistant maize genotype (SR03) that was bred from the same genetic background as Pioneer 3906 was able to maintain or even to increase the apoplastic acidification and to decrease growth reduction under salt stress (Zörb et al., 2015). Thus, the genetic
potential to reduce the impacts of salt stress on growth by improving the pumping activity of PM H+-ATPase had already been available and was brought into light in a newly bred hybrid.
1.4
Mg deficiency
1.4.1 Mg – the forgotten macronutrient in crop production
Mg is one of the nine macronutrients for plants and a deficiency in only one plant nutrient
unavoidably leads to a disturbed plant development and a consequent yield loss. Astonishingly, magnesium (Mg) is often neglected in the agricultural fertilization practice (Guo et al., 2016). The
negligence of Mg fertilization is responsible for crop yield losses worldwide caused by Mg deficiency in plants.
In plants, Mg plays an important role in the structure of chlorophyll, the assembly of ribosome
subunits during translation, and the activation of various enzymes (Shaul, 2002; Hawkesford et al., 2012). Moreover, Mg is essential for the formation of Mg-ATP which is the true substrate for the plant PM H+-ATPases (Palmgren, 2001; Hanstein et al., 2011). In recent years, studies on Mg
transporters and their efficiency under low Mg conditions were conducted (Hermans et al., 2013; Kobayashi and Tanoi, 2015), increasing the knowledge about Mg uptake by plants considerably. However, little is known about the physiological processes which are impaired under Mg
deficiency and inhibit plant growth. Particularly, it is important to know which physiological process is most sensitive to a developing Mg deficiency and is responsible for impaired vegetative
growth. (Cakmak et al., 1994a) described that one of the first processes affected under Mg deficiency was the translocation of sucrose from source leaves to roots. It was concluded that a lack of assimilates led to growth inhibition of roots, since roots as a sink organs are like developing
young leaves dependent on assimilates from source tissue: Photosynthetic active leaves. An accumulation of sugars in source leaves was also found in other plant species due to Mg deficiency:
Bean plants (Cakmak et al., 1994a), maize (Mengutay et al., 2013), spinach (Fischer et al., 1998), and sugar beet (Hermans et al., 2004a).
Some authors supposed that a decrease of PM H+-ATPase activity was responsible for a reduced
phloem transport of sucrose from leaf source tissue to sink tissues (e.g. (Cakmak et al., 1994a; Neuhaus et al., 2013). Since sucrose is mostly loaded into the phloem by sucrose/ H+ cotranporters,
a decrease in the substrate Mg-ATP for the PM H+-ATPase undoubtedly leads to a lower pH gradient which in turn reduces the transport rate of sucrose as well. However, even if PM H+ -ATPase activity is partially impaired under Mg deficiency (which was never measured), the
question remains whether a reduced loading of photoassimilates into the phloem in source leaves
would also mean that there is a lack of photoassimilates in the sink tissue that reduces plant growth.
For example, Hermans and Verbruggen (2005) using radiolabeled sucrose, showed that sucrose transport from the source leaves of Arabidopsis to the roots was not inhibited. Fischer et al. (1998) found for spinach that sugars also accumulated in sink leaves that were shaded. This shading prevented photosynthetic activity of these sink leaves, making the sink leaves entirely dependent on photoassimilates from source leaves. From these findings, it can be concluded that apparently
photosynthesis is not the primary limiting process of plant growth under Mg-limiting conditions.
However, since growth of sink organs such as roots or developing leaves is impaired by Mg deficiency, there have to be other reasons. To our knowledge no study has been conducted which
considered the effect of Mg deficiency on the two growth processes cell division and cell extension separately. In order to identify the process that is most sensitive to Mg deficiency, these growth
processes cell division and cell extension were studied in the present work including their underlying physiological mechanisms.
Both, DNA replication and gene expression determine the rate of cell division. The Mg concentration in the cytoplasm has to be in an optimal range for both processes for normal function (Stout and Arens, 1970; Robinson and Bryant, 1975; Kiss, 1988). Therefore, if a lack of Mg inhibits
the DNA polymerase activity, a lower number of DNA will be present in the analyzed tissue. Since DNA replication is required for cell division, a lower DNA content indicates a lower number of
of the total cell DNA and is therefore negligible (Lutz et al., 2011). Additionally, cell division in
maize just occurs in a thin cell layer close to the apex (Jackson, 2009). Above this thin cell layer, the meristematic tissue, cell growth is only realized by cell-extension growth in maize.
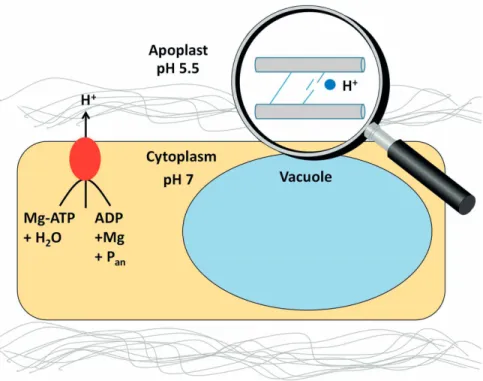
Cell-extension growth is driven by apoplastic acidification that is necessary for the loosening of
cell-wall compounds, which in turn enables turgor-driven extension growth (Figure 1). Plasma membrane (PM) H+-ATPases play an important role in cell-extension growth, because these enzymes are responsible for cell-wall acidification (Bogoslavsky and Neumann, 1998; Waldron
Figure 1: Apoplastic acidification is mainly driven by plasma membrane (PM) H+-ATPase (red oval). Cell wall loosening enzymes (blue circles) are activated by low pH, breaking connections between polysaccharide chains such as pectin, cellulose, and hemicellulose (grey lines). Turgor facilitates cell-extension growth. (inspired by Dünser and Kleine-Vehn, 2015)
In order to identify the limiting process for vegetative growth of maize under Mg deficiency,
time-course experiments with maize were conducted under control and Mg-deficient conditions to identify which physiological process is most sensitive to Mg deficiency. It was tested whether
assimilate availability and/ or cell division in sink tissue limits growth. In addition, it is hypothesized that a reduced apoplastic acidification limits extension growth by decreased PM H+
-ATPase activity and that the expression pattern of H+-ATPase isoform transcripts is altered under
Mg deficiency.
1.4.2 Stumbling blocks for the determination of concentration in Mg deficient plant material
Approximately 10% of Mg in plants are bound as central atom of chlorophyll and a reduction in chlorophyll concentration is often found under Mg deficiency (Hawkesford et al., 2012). However, some studies showed that the chlorophyll concentrations under Mg deficiency were affected a few
days after plant growth and other physiological parameters (Hermans et al., 2004b; Cakmak and Kirkby, 2008). It is astonishing that other physiological processes are impaired when such a big
share of the plants´ total Mg content is used for chlorophyll. Therefore, it was questioned whether the standard method for chlorophyll determination in leaves is suitable for leaf tissue that was cultivated under Mg-deficient conditions.
A standard method for chlorophyll determination is the extraction of pigments with organic
solvents such as acetone, ethanol or methanol and the following quantification. Before extraction, MgCO3 is often added to the leaf tissue in order to avoid the loss of Mg as central atom of
chlorophyll during the extraction process (Wrolstad et al., 2004; Zörb, 2004). However, Mg could
be inserted non-enzymatically or enzymatically into Mg-free chlorophyll precursors or metabolites during pigment extraction of leaf tissue with organic solvents (Figure 2). This could lead to an overestimation of chlorophyll concentrations, especially in plants grown under Mg-deficient conditions. Highly concentrated organic solvents do not guarantee a total inhibition of enzymes. Hu et al. (2013) showed that chlorophyll was converted to chlorophyllide during pigment extraction
with organic solvents, because the ester bond of chlorophyll was hydrolyzed by means of the still active enzyme chlorophyllase (EC: 3.1.1.14), resulting in chlorophyllide and a phytol chain.
Figure 2: Theoretical transformation of pheophytin a into chlorophyll a by addition of Mg 2+
as MgCO3 or other Mg salts. Other pheopigments such as protoporphyrin IX may also be susceptible.
One goal of this study was to investigate the effect of MgCO3 addition before extraction of plant
pigments on chlorophyll concentrations, in order to evaluate the conventional photometric chlorophyll determination procedure in maize leaves grown under Mg deficiency. Consequently, it is hypothesized that the Mg chelatase (EC: 6.6.1.1) is still active in an aqueous acetone extract and inserts free Mg, added as MgCO3 prior extraction, into protoporphyrin IX or other Mg-free
porphyrin molecules, especially in plant tissue grown under Mg-deficient conditions. As a reference method, the non-destructive chlorophyll determination with the N-tester was used.
1.5
Salt stress
Salinity is one of the major reasons for yield losses of crops in areas where evapotranspiration
exceeds precipitation. This natural occurrence is worsened by irrigation practices that are not adapted to the environmental conditions in arid and semiarid areas (Qadir et al., 2006). Besides increasing efforts to avoid anthropogenic salinization of soils and active attempts of soil
desalinization salt-resistant crops are grown to diminish salt stress effects. In order to develop those crops the physiological processes which lead to yield losses under salt stress have to be understood (Munns, 2011).
A model explaining the main physiological effects of salt stress on wheat was first developed by Munns (1993) and refined by Munns and Tester (2008). The model describes two phases of salt
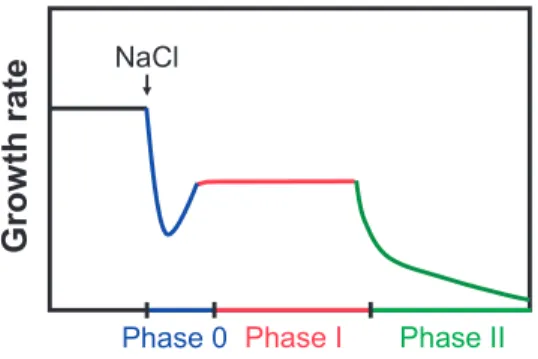
stress that affect wheat growth. The model was confirmed for maize by Schubert (2011) and extended to an additional phase (Figure 3). Phase 0 occurs directly after initializing salt stress, affecting plants´ water uptake and causing a strong decrease of growth. Phase 0 is followed by
Phase I that exhibits a recovery of growth rate which is however still lower than under unstressed conditions. This osmotic phase is similar to drought stress (Munns, 2011). Phase II is entered when
salt concentrations reach toxic levels in plant tissues. In maize, Na+ accumulates especially in older leaves, causing necrosis of leaf tissue (Fortmeier and Schubert, 1995). The described effects mainly occur in the vegetative growth stage. However, they have also consequences for the generative
Figure 3: Model of three-phase growth reduction of maize by salt stress (Schubert 2011).
It is well known that abiotic stress such as salt stress reduces the number of maize kernels reaching maturity (Schubert et al., 2009; Hütsch et al., 2015). Earlier studies found that a reduction in kernel
number is caused by decreased sugar availability in the maize kernels if drought stress occurs in the weeks around husk emergence and right after silk pollination (Zinselmeier et al., 1999). The
authors concluded that the assimilate supply to the kernels was reduced due to the decrease of acid invertase activity under drought stress. More recently, Oury et al. (2015) and Oury et al. (2016) showed that maize silk development was impaired by drought stress, leading to a reduced
fertilization of ovaries and thus to less kernels, especially in the apical part of maize cobs. In these drought-stress studies, acid invertase activity was reduced. However, not only sucrose accumulated
in kernel tissue, but also hexose concentrations were higher or at least not reduced under drought stress. Therefore, the authors argued that not a lack of hexoses led to kernel abortion, but rather a reduction in successful ovary fertilization.
Grow
th ra
te
Phase I
Phase II
NaCl
Phase 0
In our previous study we also found that a reduction of acid invertase activity around pollination
occurred under drought stress as well as under salt stress (Hütsch et al., 2015). Additionally, we showed that while acid invertase activity was strongly reduced, the hexose concentrations were not. Instead, they were even higher under both stress conditions. While a higher sucrose
concentration is a good parameter to exclude that source limitation is responsible for kernel starvation and abortion (Henry et al., 2015; Hütsch et al., 2015; Oury et al., 2016), higher hexose concentrations do not necessarily rule out kernel starvation. On the opposite, higher hexose
concentrations could very well point to kernel starvation and subsequent abortion. The maternal and daughter cell tissues of the kernels are physically isolated from each other due to a lack of
plasmodesmata (symplastic) continuity (Tang and Boyer, 2013). Therefore, after unloading of sucrose from phloem, driven by acid invertase activity, the resulting hexoses have to be transported from the apoplast of pedicle and placento-chalaza tissue into the cytoplasm of the endosperm tissue
by hexose carriers (Bihmidine et al., 2013). These carriers are hexose/ H+ symporters which are energized by the pH gradient at the plasma membrane (Figure 4). This pH gradient is established
Figure 4: (A) Morphology of young maize kernels (redrawn after Bihmidine et al., 2013). (B) Sucrose (Suc) transport from source (leaves) to the sink (kernels) of maize. Suc moves through the phloem to the sink where it is released non-selectively trough the plasma membrane (orange). In the kernels apoplast it is hydrolyzed by means of acid invertase to Glucose (Glu) and Fructose (Fru). The daughter cells take up Glu und Fru selectively with hexose transporters (black). The transporters are energized with the pH gradient, established by the PM H+-ATPase (red). (Partly redrawn after Tang and Boyer, 2013).
pedicle placenta-chalaza pericarp nucellus endosperm embryo maternal tissue A
A
Suc Suc Phloem sieve element Suc Glu Glu Fru Fru pH 7 Endosperm Cytosol Embryo PM PMDaughter cell tissue Kernel apoplast
Maternal tissue
InvertaseGlu + Fru
ATP + H2O ADP + Pan H+ H+ H+
Source
Sink
pH 5.5B
Under salt stress, the activity of this enzyme is often reduced in maize leaves during the vegetative
stage (Zörb et al., 2005b; Hatzig et al., 2010). If the activity of the PM H+-ATPase is also reduced in the developing maize kernels under salt stress, the pH gradient will not be properly established, resulting in an accumulation of hexoses in the apoplast. Reduced transport of hexoses into the
cytoplasm could than lead to kernel starvation in the first days after fertilization. No others studies are known which investigated the relationship between PM H+-ATPase activity and kernel abortion. Therefore, it was hypothesized that kernel PM H+-ATPase activity is inhibited by salt
stress, resulting in reduced hexose uptake which in turn leads to kernel abortion.
1.6 Hypotheses
In the first part of this thesis the effect of the abiotic stress Mg deficiency on the PM H+-ATPases´
and their involvement in the vegetative growth process of maize were examined. In addition, other physiological parameters which are not directly dependent on the PM H+-ATPase were also
investigated in order to determine their contribution to reduced vegetative growth under Mg
deficiency. A standard method for chlorophyll determination was examined to evaluate if it is applicable for Mg-deficient plant material. Therefore, the following hypotheses were tested:
1. The photometric standard method using acetone extracts to determine chlorophyll concentrations is applicable to Mg-deficient maize tissue.
2. Reduced assimilate availability in growing sink tissue is responsible for early growth inhibition under Mg deficiency in maize.
3. Reduced cell division in growing sink tissue is responsible for early growth inhibition of maize under Mg deficiency.
4. Altered PM H+-ATPase activity is responsible for reduced leaf apoplastic acidification reducing extension growth under Mg deficiency in maize.
In the second part of this thesis the effect of the abiotic stress salinity on the PM H+-ATPases and
their role in the generative stage, namely in the development of young maize kernels and grain
yield were examined by testing the following hypotheses:
5. Source leaf sugar supply limits maize kernel development under salt stress. 6. Sink hexose supply limits maize kernel development under salt stress.
7. Plasma membrane H+-ATPase activity of young maize kernels is reduced under salt stress, inhibiting hexose uptake of the sink tissue, leading to kernel starvation.
2. Materials and methods
2.1
Stumbling blocks for chlorophyll concentration measurements in
Mg-deficient plant material
2.1.1 Plant cultivation and harvest
The experiment was set up in hydroponics in a completely randomized design with four replications and two Mg treatments: Mg control (500 μM) and Mg deficiency (25 μM). Maize seeds (Zea mays
L. cv. Amadeo) were soaked in aerated 1 mM CaSO4 solution for 1 d and then packed between
filter paper moistened with 1 mM CaSO4. The seeds germinated in the dark for 3 d and in the light
for 4 d. The experiment was conducted in a climate chamber under the following conditions: light intensity was 500 μE m−2 s−1 (Philips Master HPI-T Plus 400 W) for 16 h at 26°C and 18°C for 8
h in the dark period, respectively. The relative humidity was 50%. On day 8, plants were transferred into plastic pots (eight plants per pot) containing 10 L of aerated half-strength nutrient solution. The plants received full-strength nutrient solution on day 12 (4 d after start of differential Mg treatment). The full-strength nutrient solution for control plants contained (in mM): Ca(NO3)2, 2.0;
K2SO4, 1.0; KH2PO4, 0.2; MgSO4, 0.5; CaCl2, 2.0; Na2SiO3, 1.0 (in μM) H3BO4, 1.0; MnSO4, 2.0;
ZnSO4, 0.5; CuSO4, 0.3; (NH4)6Mo7O24, 0.01; Fe-EDTA, 200; NiSO4, 0.1. In the Mg-deficiency
treatment (25 μM Mg), 475 μM CaSO4 were used to supplement the missing S. Plants were
harvested 5 d and 8 d after onset (DAO) of differential Mg treatment. Before each harvest, the light transmission was measured individually for each investigated leaf (30 measurements leaf-1 pot-1)
with a chlorophyll meter (N-tester®, Yara International ASA, Oslo). Fresh weight was determined
ground with mortar and pestle in liquid N2 and stored at -20°C until further analysis. Part of the
ground plant material was lyophilized for dry-weight determination.
2.1.2 Pigment extraction
Chlorophyll concentration was determined after aqueous acetone extraction (Zörb, 2004). Frozen plant material (0.8 or 1.0 g) was extracted with acetone. The final acetone concentration was 80%;
the individual water contents of the different leaves were considered to adjust the target acetone concentration. Each biological replicate was extracted twice: with and without MgCO3 addition
(50 mg) to the frozen plant material before extraction with acetone. The samples were kept in the dark and on ice before and after extraction until spectrophotometric measurement at 5°C.
2.1.3 Determination of chlorophyll concentrations
Chlorophyll a and b concentrations were measured photometrically at 664 nm and 647 nm in quartz cuvettes (Cary 100, Agilent). In addition, an absorption spectrum for each sample was recorded
ranging from 350 to 900 nm. The concentrations were calculated by means of the equations given by Porra et al. (1989):
Chlorophyll a conc. (μg mL-1) = 12.25 A664 - 2.55 A647, (1) Chlorophyll b conc. (μg mL-1) = 20.31 A647 - 4.9 A664, (2) Chlorophyll a+b conc. (μg mL-1) = 17.76 A647 + 7.34 A664. (3)
In order to investigate the possibility of subliminal enzymatic or non-enzymatic reactions in the
filtered leaf-acetone extract, the extracts were also incubated at 25°C for 10 min and the light absorbance was measured afterwards as described above. In addition to the normal extraction method, a modified extraction method was used. The plant material was incubated with deionized
water (with and without 50 mg MgCO3) at 25°C for 10 min before acetone extraction. This was done to exclude the possibility that protoporphyrin IX or other Mg-free porphyrine molecules, already existent in plant leaves and especially in plant tissues grown under Mg deficiency, were
converted to chlorophyll during the extraction process. To quantify the pheophytin concentrations in the pigment extracts, each plant acetone-extract was acidified immediately after photometrical
measurement by the addition of 10 μL 8 M HCl (3 mL chlorophyll extract), which resulted in a pH in the range of 2.0-2.5. Chlorophyll was transformed to pheophytin by HCl addition and the extracts were measured again at 665 nm to calculate the pheophytin concentrations. The pheophytin
concentrations were calculated by means of the equation given by Lorenzen (1967):
Pheophytin a conc. (μg mL-1) =
26.7 [1.7 A665 (after acidification) - A664 (before acidification)]. (4)
2.1.4 Statistical analyses
Data shown are means of four biological replications. Variations among biological replications are characterized by standard errors (± SE). Control and Mg-deficient treatments were compared using
the two-tailed student’s t-test. Likewise, the samples augmented with MgCO3 were compared to the samples without MgCO3 addition by means of the two-tailed student’s t-test.
2.2
Effect of Mg deficiency on plasma membrane H
+-ATPase activity and the
implications for maize growth
2.2.1 Plant cultivation and harvest
In order to identify the most sensitive physiological process under Mg deficiency several parameters were measured. For these measurements a sufficiently large amount of plant material was needed, making several experiments necessary. All experiments were conducted under the
same experimental conditions. The first experiment was conducted to determine the time frame in which growth reduction occurred after onset of Mg deficiency, as well as for the determination of DNA content and concentrations of sugars, chlorophyll, and protein. The second experiment was
conducted to determine the effect of Mg deficiency on the apoplastic pH of developing leaves. The third experiment was conducted to confirm the results of Experiment 2 and to measure the relative
RNA abundance of different H+-ATPase isoforms. The last experiment was conducted to isolate plasma membrane vesicles for the determination of hydrolytic and pumping activity of PM H+
-ATPases.
The experiments were set up in a completely randomized design in hydroponics with four
replications and two Mg treatments: Mg control (500 μM) and Mg deficiency (25 μM). Maize seeds (Zea mays L. cv. Amadeo) were soaked in an aerated 1 mM CaSO4 solution for 1 d and then packed between filter paper moistened with 1 mM CaSO4. The seeds were germinated for 3 d in the dark and 4 d in the light. Plants were grown in a climate chamber at 26°C for 16 h light period (light intensity was 500 μE m−2 s−1) and at 18°C for 8 h dark period. The relative humidity was
50%. On day 8, 70 plants were transferred into boxes containing 40 L of aerated half-strength nutrient solution (eight boxes control, eight boxes Mg deficiency). At this time, the different Mg
treatments were started. Plants received full-strength nutrient solution 1 d after the onset (DAO) of
differential Mg nutrition. The control full-strength nutrient solution contained (in mM): Ca(NO3)2, 1.0; NH4NO3 1.0 K2SO4, 1.0; KH2PO4, 0.2; MgSO4, 0.5; CaCl2, 2.0; Na2SiO3 1.0; (in μM) Fe-EDTA, 200; H3BO4, 1.0; MnSO4, 2.0; ZnSO4, 0.5; CuSO4, 0.3; (NH4)6Mo7O24, 0.01; NiSO4, 0.1.
In the Mg deficiency treatment (25 μM Mg), 475 μM CaSO4 were used to supplement the missing S. In order to obtain a time course of emerging Mg deficiency, plants were harvested every day or every second day. The nutrient solution was renewed every second day. In the morning of each
day, the widths and lengths of individual leaf blades were measured. Leaf blade area was calculated as the product of width and length divided by 2. The plant organs (shoots and roots) were pooled.
Shoots were divided into separate leaves; leaves 1 and 2 were preserved together. Fresh weights were determined for every individual plant part and plant material was frozen immediately in liquid N2. Roots were sopped in 1 mM CaSO4 solution, washed with deionized water and blotted dry with
paper towels before fresh-weight determination. Plant material was ground with mortar and pestle in liquid N2 for further analyses and stored at -80°C. A part of the ground plant material was
lyophilized for the determination of soluble sugars. An aliquot of the plant material was oven-dried at 105°C for cation determination.
2.2.2 Analyses of cation, chlorophyll, sugar, and protein concentrations
Cations were analyzed after dry-ashing of the plant material at 550°C. The ash was boiled with 5 mL 5 M HNO3 and, after filtration, cation concentrations were measured with AAS (Varian Spectra AA 220FS). Pigments were extracted with aqueous acetone (80%) from the frozen plant
material, in the presense of MgCO3. The chlorophyll a+b concentrations were measured according to Zörb (2004).The sugars glucose, fructose, and sucrose were determined enzymatically with UV
test kits (Boehringer Mannheim/Roche-Biopharm). Approximately 10 mg of lyophilized plant
material were extracted in 75°C hot deionized water for 30 min. After centrifugation, the extracts were analyzed according to the manufacturer´s instructions and measured photometrically at 340 nm.Protein concentrations were determined with the Bradford method (Bradford, 1976) after
extraction of 100 mg lyophilized plant material with phosphate-buffered saline Tween (PBST).
2.2.3 Analyses of DNA content
DNA was isolated from frozen plant material (100 mg) using the Qiagen®DNeasy Plant Mini Kit
according to the manufacturer’s instructions. DNA concentration was determined photometrically (Varian Cary 4 Bio) with a TrayCell (Model 105.810-UVS by Hellma) at 260 nm and purity was
determined as the 280 nm : 260 nm ratio. DNA content was calculated by multiplication of DNA concentrations and leaf or root dry weight.
2.2.4 Determination of apoplastic pH
In Experiments 2 and 3, leaf-blade tissue of 3 cm² of the growing zone of developing leaves was excised with a razor blade. The apoplast of leaf segments was infiltrated with 50 mM fluorescein isothiocyanate (FITC)-dextran (MW = 10,000 g mol-1, Sigma-Aldrich, Germany) by means of the
vacuum-infiltration technique (Mühling and Läuchli, 2000). The apoplastic pH was calculated after measuring the fluorescence-emission intensity of several spots of each leaf blade (Pitann et al.,
2.2.5 Plasma membrane (PM) isolation
Plasma membrane vesicles were isolated from the growing 4th leaf blade 5 d after onset of differential Mg nutrition. The lower part of this leaf blade, which was still partly covered with the surrounding 3rd leaf, was used for vesicle isolation. This leaf part was chosen to obtain still
expanding leaf tissue. The plant material was placed on ice immediately after cutting. The material was homogenized according to Briskin and Poole (1983), De Michelis and Spanswick (1986), and
Galtier et al. (1988). Phase partitioning of membranes was performed with a polymer concentration of 6.2% (Zörb et al., 2005a; Hanstein et al., 2011). Quantification of proteins was done with the method of Bradford (1976). Vesicle aliquots were stored in liquid N2. Vesicle purity was confirmed
using specific ATPase and pyrophosphatase inhibitors (Gallagher and Leonard, 1982; Yan et al., 1998; Hanstein et al., 2011).
2.2.6 Kinetic assays of hydrolytic PM H+-ATPase activity
In order to determine the Michaelis constant (Km) and turnover number (Kr) of the PM H+-ATPase (EC: 3.6.3.6) the hydrolytic activity of each sample was measured for ten different ATP
concentrations in each assay. The hydrolytic activity assays were conducted in the presence of either 5 or 1 mM Mg according to Hanstein et al. (2011). The Michaelis constant (Km) is the substrate concentration at which the reaction rate is half of Vmax, which represents the maximum
reaction rate achieved by an enzyme at maximum substrate saturation. The turnover number (Kr) is defined as the maximum number of chemical conversions of substrate molecules per second that
a single catalytic site executes for a given enzyme concentration. It is calculated by dividing Vmax by the catalyst site concentration [E]T.
Normalization of ATPase activities
The normalization procedure eliminated slight variations in enzyme concentrations of replicates. Such differences could have occurred when enzyme concentrations slightly differed between stored
vesicle aliquots for replicates. Normalized activities were determined for each replicate as follows: (i) calculating the sum of activities over the whole range of ATP concentrations for each replicate (individual sum), (ii) determining the mean sum of all replicates, and (iii) multiplying the activity
values of a replicate with the ratio between the mean sum and the individual sum of that replicate (Hanstein et al. 2011).
Non-linear regression analysis with DynaFit
The measured activity data were subjected to non-linear regression analysis as described by (Hanstein et al., 2011). DynaFit was used to fit a mechanistic model to the measured enzyme
activities (Kuzmič, 1996). All calculations were based on the measured activities of four biological replicates. In all fitting procedures, the rate constants for association were used as constants (based on literature values), and the rate constants for dissociation were used for fitting. The fitting
procedure requires that initial values are specified which were also derived from literature values (Wang et al., 2013). All constants and initial values are defined in the used DynaFit script
(Appendix Figure 1).
2.2.7 Measurement of proton-pumping activity
The formation of a pH gradient across the plasma membrane of inside-out vesicles was measured
of 5 mM (Yan et al., 1998) (Figure 5). Proton transport was characterized using the following
parameters: Active transport was quantified as initial rate during the first 2 min after addition of Mg-ATP. The maximum pH gradient was determined as the maximum quenching of absorbance (ΔA492), and passive proton transport was determined as initial rate of proton efflux for 1 min after addition of the specific inhibitor of PM ATPase vanadate.
Figure 5: Determination of the pH gradient across the plasma membrane of inside-out vesicles, measured as the quenching of absorbance by acridine orange (AO).
2.2.8 Relative abundance of RNA plasma membrane H+-ATPase isoforms
In silico analysis of the maize genome (http://www.maizegdb.org/; Maize B73 RefGen_v2) allowed the identification of ten candidate genes for PM H+-ATPase isoforms. However, only six of the candidates were reported to be transcribed in leaf tissue (Sekhon et al., 2011). These six leaf isoforms of PM H+-ATPase were defined as MHA1-6 in the present study. The stability of
transcription level of six reference genes, which were suggested by Manoli et al. (2012), were tested in the selected leaf segments. Cullin (CUL) and ubiquitin carrier protein (UBCP) were
assessed as most stable reference genes using the algorithm of the Normfinder software (http://moma.dk/normfinder-software) and were used as normalization base for the present experiment. Primer pairs representing six different PM H+-ATPase isoform genes were designed
Mg-ATP + H2O ADP +Mg + Pan H+ AO AOH+ AO (A492)
using Primer3Plus (ver. 0.4.0; http://frodo.wi.mit.edu/primer3) and the PRaTo software
(http://prato.daapv.unipd.it/) was used to rank the primer pairs according to their qPCR performing potential (Nonis et al. 2011). To increase the specificity of amplification primers were designed in the 3_UTR region of the genes and were tested in silico for specificity by means of NCBI primer blast (http://www.ncbi.nlm.nih.gov/tools/primer-blast/). Accession number, primer sequence, their position on transcript, and expected size of amplicon are provided in Appendix Table 1.
Approximately 100 mg frozen plant material derived from the same growing leaf blade segments as for the apoplastic pH determination were used to extract RNA with the Qiagen RNeasy Plant Mini Kit according to the manufacture’s instruction. The RNA extractions and all further steps were performed in triplicate. RNA purity was checked by measuring the absorbance ratio (A260/A280). Qiagen´s QuantiTec Reverse Transcription Kit was used to reverse-transcribe 10 ng of the isolated RNA according to the manufacturer’s instructions. Sigma´s SYBR® Green JumpStart™ Taq ReadyMix™ for High Throughput qPCR was used to set up the qPCR reactions. The sample cDNA concentration was 100 ng in a final reaction volume of 20 μL. The final concentration of primers was 2 pmol μL-1 for reference genes and genes of interest. Candidate
transcripts were amplified with the Rotor Gene 3000 system (Corbett Research, Mortlake, Australia). The Following cycling parameters were chosen: Initial inactivation at 94°C for 2 min; 40 cycles: denaturation at 94°C for 15 s, annealing at primer pairs specific temperature (Appendix Table 1) for 30 s, elongation at 72°C for 30 s. At the end of each cycle the fluorescence signal was measured. After the 40th cycle, a melt-curve analysis (melting: 60-99°C) was performed to control
specificity of the primer pairs. All samples and reference genes were run in triplicate. In each run and for each primer pair, a negative template control (NTC) was included to ensure the absence of contamination. In addition, the presence of genomic DNA contamination was excluded by running no RT-controls. The specificity of amplification was confirmed by sequencing.
2.2.9 Gel electrophoresis and immune detection of plasma membrane H+-ATPases
The abundance of PM H+-ATPases was measured according to Zörb et al. (2005a) with some modifications after separation of isolated vesicle proteins (0.2 μg) by SDS-polyacrylamide gel electrophoresis (SDS-PAGE). After separation of proteins with SDS-PAGE, samples were
transferred onto polyvinylidene difluoride (PVDF) membrane filters (0.2 μm, Macherey-Nagel) using a semi-dry blotting system. A polyclonal antibody specific for the central part of plant H+
-ATPase (Agrisera) was used. Alkaline-phosphatase-conjugated anti-rabbit IgG (Agrisera) was used as secondary antibody. The H+-ATPase immunoreactive bands were quantified densitometrically with the software ImageJ 1.49v (National Institutes of Health, USA). Controls
and samples were run in triplicate.
2.2.10 Statistical analyses
Data shown are means of four biological replications. Variation among the biological replications is characterized by standard errors (± SE). Control and Mg-deficiency treatments were compared using the two-tailed student´s t-test. The enzymatic constants were evaluated using a two-way
ANOVA, the means were then compared with HSD (SigmaStat 3.5, Systat, Germany).
2.3
Effect of salt stress on plasma membrane H
+-ATPase activity and its
implications for kernel development of maize
2.3.1 Plant cultivation and harvest
Maize plants (Zea mays L. cvs. Pioneer 3906 and Fabregas) were cultivated according to Hütsch et al. (2015) using the container technique. 120 L plastic containers were filled with 145 kg of a
Brown Earth subsoil (loamy sand: 15.8% clay, 30.8% silt, 53.4% sand; pH (CaCl2) 7.1). The topsoil
layer was fertilized with a compound fertilizer and micronutrients according to Hütsch et al. (2015). The plants were cultivated in the vegetation hall of the experimental station of the Institute of Plant Nutrition in Giessen under natural light conditions. The containers were set up in a completely
randomized design and their position was changed at least once a week. The containers were repeated four times with four plants per container. There were two treatments, a control treatment and a salt stress treatment (NaCl). The salt stress treatment was established by mixing NaCl into
the soil to achieve 11 dS m-1 electrical conductivity throughout the soil profile of 90 cm. Silks were hand-pollinated with fresh pollen from unstressed maize plants 5 d after first silk appearance. Just
prior to pollination silks were cut 1 cm above the tips of the husk leaves and silk fresh weight was determined. For each individual treatment and genotype three harvests were conducted: Two intermediate harvests were conducted 0 and 2 d after pollination (0 and 2 DAP) and one harvest at
kernel maturity. This resulted in different pollination and harvest dates depending on treatment and genotype (Table 1).
Table 1: Harvest of developing kernels: days after sowing (DAS); days after pollination (DAP).
DAS Treatment
66 DAS Fabregas Control 0 DAP 68 DAS Fabregas Control 2 DAP 69 DAS Fabregas NaCl 0 DAP 71 DAS Fabregas NaCl 2 DAP 72 DAS Pioneer 3906 Control 0 DAP 74 DAS Pioneer 3906 Control 2 DAP 75 DAS Pioneer 3906 NaCl 0 DAP 77 DAS Pioneer 3906 NaCl 2 DAP
Plants were harvested according to Hütsch et al. (2015). For each maize genotype and treatment four containers with four plants were harvested (Figure 6). In case a second or third cob developed,
Shoots were cut into pieces of 10–20 cm and dried at 105°C for 72 h for dry-weight determination.
For laboratory analyses, the frozen kernels were ground under liquid N2 using mortar and pestle and stored at -80°C until further analysis. Due to the difficulty to discriminate between maternal and daughter tissue in the first days after pollination (Wang and Ruan, 2013) in this and other
studies enzyme activities and assimilate concentrations were determined in a mixture of maternal tissue (nucellus, pericarp, placenta-chalaza and pedicle) as well as of endosperm and embryonic tissue (Zinselmeier et al., 1999; Hütsch et al., 2014) (Figure 4). In the mature maize plants straw
and cob fresh and dry mass, and kernel dry mass (105°C drying), as well as kernel number and kernel weight were determined.
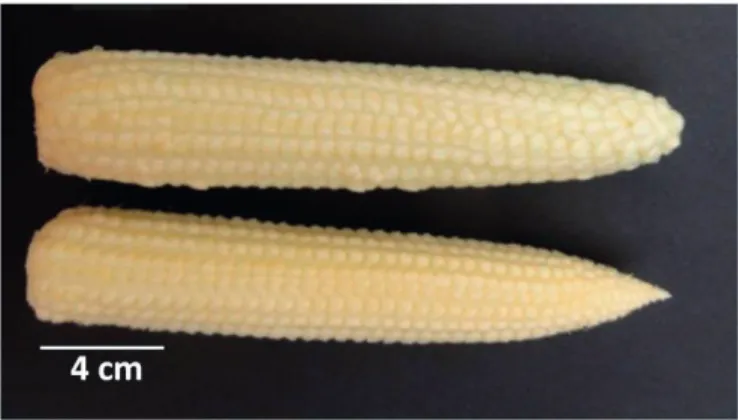
Figure 6: Photograph of a young maize cob 2 d after pollination (DAP).
2.3.2 Sugar determination
An aliquot (100 mg) of frozen, ground kernels was lyophilized for 48 h. Sucrose, glucose, and fructose were analyzed in approximately 10 mg dry weight of pulverized samples. Samples were extracted with 1.8 mL double-deionized water in a shaking heat block at 75°C for 30 min. The
extracts were centrifuged until they were free of plant residues. The supernatants were stored
at -20°C. Enzymatic sugar determination was conducted with UV test kits (Boehringer Mannheim/Roche-Biopharm). Each kernel sample was extracted in duplicate prior to sugar analysis. Sugar contents were calculated by multiplication of sugar concentrations and total kernel
fresh weights.
2.3.3 Acid invertase enzyme extraction and activity measurements
Extraction of enzymes and incubation for the determination of acid invertase (EC 3.2.1.26) activity
were performed according to Zinselmeier et al. (1999) modified by Hütsch et al. (2015). In the present study, only acid invertase activity was determined, since it was shown by Hütsch et al.,
(2014 and 2015) that activities of other invertases or sucrose synthase (EC 2.4.1.13) were negligible in maize kernels around pollination.
2.3.4 Plasma membrane (PM) isolation of maize kernels
Frozen and ground kernels were used for the isolation of PM vesicles. Otherwise the isolation was conducted in the same manner as described in Chapter 2.2.5 for maize leaves.
2.3.5 Kinetic assays of hydrolytic PM H+-ATPase activity of maize kernels
PM H+-ATPase hydrolytic activity of maize kernels was determined as described in Chapter 2.2.6 with the exception that the measurements were conducted with 10 mM Mg present in the in vitro
in Chapter 2.2.6. However, all data shown here were not normalized and based on a model
assuming a Michaelis-Menten relationship which was the best fitting model.
2.3.6 Measurement of proton-pumping activity of PM H+-ATPase of maize kernels
Active transport rate, passive transport rate, and maximum pH gradient were measured as described
in Chapter 2.2.7.
2.3.7 Relative abundance of RNA plasma membrane H+-ATPase isoforms
The qPCR analyses for maize kernel was conducted as described in Chapter 2.2.8 for maize leaf
tissue.
2.3.8 Gel electrophoresis and immunodetection of plasma membrane H+-ATPase
The abundance of PM H+-ATPase was measured according to Zörb et al. (2005a) with modifications (described in Chapter 2.2.9) after separation of isolated vesicle proteins (0.5 μg) with SDS.
2.3.9 Statistical analyses
Means were calculated from four replicates per treatment and genotype. Variation among the biological replications is characterized by standard errors (± SE). Planned contrasts were conducted
differences are indicated by *P ≤ 5%, **P ≤ 1%, and ***P ≤ 0.1%. Additionally, three-way
ANOVAs were conducted to test for unanticipated differences (a posteriori). Multiple comparisons separating means in homogenous subgroups were performed using the post hoc Tukey test (P ≤ 5 %). Significant differences are indicated by different small letters. All statistical tests
3.
Results
3.1
Stumbling blocks for chlorophyll concentration measurements in
Mg-deficient plant material
3.1.1 Effect of Mg deficiency on maize growth and N-tester results
At the first harvest (5 DAO), the plant fresh weights were not significantly reduced under low Mg
supply. However, for the 3rd leaf that had emerged a decrease of fresh weight under Mg deficiency was observed (control 500 μM Mg = 0.47 ± 0.02 g; Mg deficiency 25 μM Mg = 0.43 ± 0.03 g),
becoming significant (P = 1%) 3 d later at the second harvest (8 DAO: control 500 μM Mg = 1.04 ± 0.03 g; Mg deficiency 25 μM Mg = 0.88 ± 0.02 g) (Figure 7). Already at the first harvest (5 DAO), the N-tester-values were reduced significantly for all leaves under low Mg supply (Table
Figure 7 Effect of Mg nutrition on maize appearance 8 d after onset (DAO) of differential Mg treatment;control nutrient solution with 500 μM Mg, Mg deficiency with 25 μM Mg.
Table 2: Effect of Mg nutrition on maize leaf N-tester readings (dimensionless) 5 and 8 d after onset (DAO) of differential Mg treatment; control nutrient solution with 500 μM Mg, Mg deficiency with 25 μM Mg; means (n = 4) ± SE; **P = 1% = ***P = 0.1%; difference in percentage between control and Mg-deficiency treatment on the same harvest date.
Treatment Harvest 2nd leaf 3rd leaf
Control (500 μM Mg) 5 DAO 552 ± 10 -34% 376 ± 13 -26% Mg deficiency (25 μM Mg) 365*** ± 23 277** ± 13 Control (500 μM Mg) 8 DAO 648 ± 10 -51% 617 ± 12 -55% Mg deficiency (25 μM Mg) 320*** ± 18 279*** ± 6
3.1.2 Effect of addition of MgCO3 during extraction of maize leaves grown under Mg
deficiency on chlorophyll concentrations
The classical destructive method to measure chlorophyll concentration showed always a significant reduction of chlorophyll concentration for the 2nd leaf (Figure 8 A) and the 3rd leaf under Mg
deficiency (Figure 8 B). No differences in chlorophyll a and chlorophyll a+b concentrations were observed between samples with and without MgCO3 addition (Figure 8). However, 8 d after onset
of differential Mg treatment (8 DAO), the chlorophyll b concentration of the 3rd leaf decreased slightly but significantly when MgCO3 had been added before extraction. At the first harvest (5 DAO), only a trend of decrease in chlorophyll b concentration was observed after addition of
MgCO3 (Figure 8). There was no indication that new chlorophyll was formed enzymatically or non-enzymatically from the extracted pigments, when the plant acetone extract was incubated at
25°C for 10 min, or when the plant material was incubated in deionized water at 25°C for 10 min before acetone extraction (data not shown).
Figure 8: Effect of Mg nutrition on chlorophyll concentrations of the 3rd maize leaf 5 d (A) and 8 d (B) after onset (DAO) of differential Mg treatment; control nutrient solution with 500 μM Mg, Mg deficiency with 25 μM Mg, with +MgCO3 and without -MgCO3 addition before pigment extraction with aqueous acetone; means (n = 4) ± SE; differences between treatments extracted with and without MgCO3 addition during extraction are significant with *P = 5%; significant differences between control and Mg-deficiency treatment not marked in figures with P = 0.1%; FW = fresh weight. 0 0.2 0.4 0.6 0.8 1 1.2 1.4 1.6 1.8
Control -Mg Control +Mg Mg deficiency -Mg Mg deficiency +Mg C h lo ro p h y ll c onc ent ra ti o n (m g g -1 FW) Chlorophyll a Chlorophyll b Chlorophyll a+b
A
0 0.2 0.4 0.6 0.8 1 1.2 1.4 1.6 1.8Control -Mg Control +Mg Mg deficiency -Mg Mg deficiency +Mg Chl o ro p h y ll c o nc ent rat io n ( m g g -1 FW) * *
B
Mg deficiency +MgCO3 Mg deficiency +MgCO3 Control +MgCO3 Control -MgCO33.2
Effect of Mg deficiency on plasma membrane H
+-ATPase activity and the
implications for maize growth
3.2.1 Effect of slowly developing Mg deficiency on maize growth
The Mg deficiency was induced in the Mg-deficiency treatment right from the start of maize cultivation, when plants were transferred first into nutrient solution. Four days after onset of differential Mg nutrition, the Mg concentration of roots was reduced by 61% relative to control
roots; in the 1st and 2nd leaf the Mg concentration was reduced significantly by 30% (Appendix Figure 2). Shoot and root concentrations of potassium and calcium were not significantly affected during the first days (data not shown).
The first evidence of reduced growth was found on days 5-6 after the onset of differential Mg nutrition. The growth rate of the 4th emerged leaf blade was significantly reduced (Figure 9). Leaf
blade 4 was not visible yet at onset of Mg deficiency and reached its final size 8 d later. Therefore, leaf 4 was a developing leaf during this timeframe. It is important to note that the final size of each
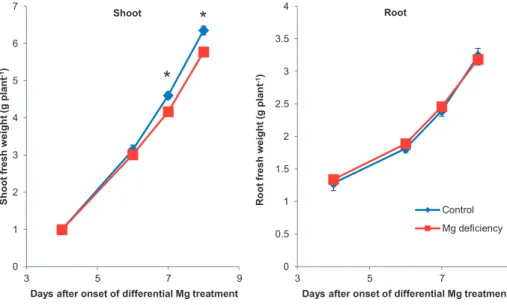
leaf blade was the same at the end. However, leaf growth was delayed in the Mg-deficiency treatment. There was no evidence for a reduction in root fresh weight in the first 10 d after onset of Mg deficiency (Figure 10). Shoot fresh weight production was significantly reduced by Mg
deficiency on day 7 (Figure 10). 10 DAO dry weight of leaf blade 3 was significantly higher under Mg deficiency (data not shown). Dry weights of the whole shoot or leaf blade 4 were not altered
during the duration of the experiment (data not shown). These results were confirmed by three independent experiments for maize under the described growth conditions.
Figure 9: Effect of Mg nutrition on the growth rate of leaf 4 of maize grown with two different Mg treatments. Control (blue) nutrient solution with 500 μM Mg, Mg deficiency (red) with 25 μM Mg. Means (n = 4) ± SE. Significant differences at *P = 5% between control and the Mg-deficiency treatment.
Figure 10: Effect of Mg nutrition on shoot and root fresh weights of maize. Control (blue) nutrient solution with 500 μM Mg, Mg deficiency (red) with 25 μM; means (n = 4) ± SE. Significant differences at *P = 5% between control and Mg-deficiency treatment.
600 800 1000 1200 1400 1600
Day 5-6 Day 6-7 Day 7-8 Day 8-9 Day 9-10
Gr ow th r a te lea f 4 (c m ² da y -1)
Days after onset of differential Mg treatment
Control Mg deficiency
*
*
*
0 1 2 3 4 5 6 7 3 5 7 9 S hoot f resh w e ig h t (g plant -1)Days after onset of differential Mg treatment Shoot
*
*
0 0.5 1 1.5 2 2.5 3 3.5 4 3 5 7 9 R o ot fr esh w e ight ( g plant -1)Days after onset of differential Mg treatment Root
Control Mg deficiency
3.2.2 Effect of Mg deficiency on chlorophyll, sugar, and protein concentrations of maize
The chlorophyll, sugar, and protein concentrations were measured in source and sink tissue, to determine if any of these parameters could have limited growth.
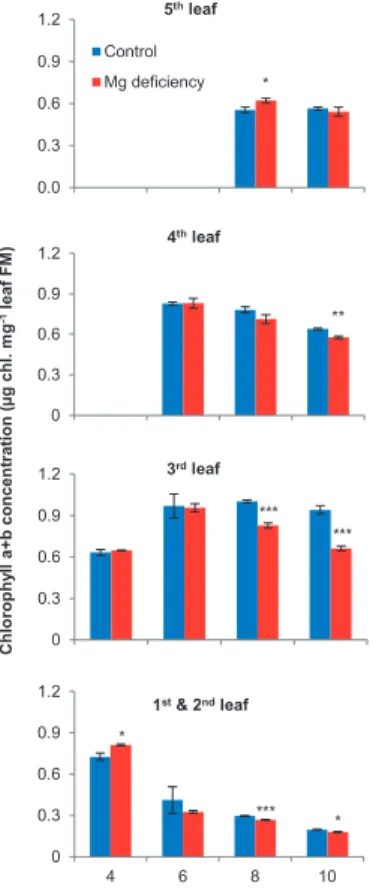
A significant decrease in chlorophyll concentration was found in the older leaves 8 d after onset of differential Mg nutrition (Figure 11). Hence, this difference occurred 3 d after the first measured effect on growth of leaf 4 (Figure 9). A parameter for photosynthesis output is the sugar
concentration of leaf blade tissue. The soluble sugars glucose, fructose, and sucrose accumulated in the mature leaves 6 d after onset of treatment (Figure 12). There was no reduction in hexose
concentrations in the younger leaves while the leaf blades were still growing (leaf blade 4 and 5) in Mg-deficient plants (Figure 9). There was a clear pattern when leaf blades had reached the final size: First there was an accumulation of sucrose, followed by an accumulation of glucose and
fructose. In roots and root tips there was a decrease in sucrose concentration on day 8, but this difference disappeared on day 10 (Figure 12). Therefore, no lasting changes in sugar concentrations
were observed during the timeframe when the first decrease in leaf growth occurred.
Protein concentration was measured to assess whether amino acid supply or the translation process
itself might be inhibited under Mg deficiency in sink tissues. The concentration of soluble proteins was significantly decreased in the roots of the Mg-deficient treatment on day 8 after the onset of differential Mg nutrition (Figure 13). However, there was no reduction of soluble proteins in root
tips. In growing leaves, protein concentrations were not affected by low Mg supply during the timeframe of the experiment, either (Figure 13).
Figure 11: Effect of Mg nutrition on chlorophyll (a + b) concentrations of leaves of maize. Control (blue) nutrient solution with 500 μM Mg and Mg deficiency (red) with 25 μM Mg; means (n =4) ± SE. Significant differences at *P = 5%, **P = 1%, ***P = 0.1% between control and the respective Mg-deficiency treatment. 0.0 0.3 0.6 0.9 1.2 4 6 8 10 Chl . a+b c onc ent ra ti on (μ g c h l. m g l eaf FM-1 )
Days after start of differential Mg treatment 5thleaf Control Mg deficiency * 0 0.3 0.6 0.9 1.2 4 6 8 10 Chl . a+b c onc ent ra ti on (μ g c h l. m g l eaf FM-1 )
Days after start of differential Mg treatment 4thleaf ** 0 0.3 0.6 0.9 1.2 4 6 8 10 Chl . a+b c onc ent ra ti on (μ g c h l. m g l eaf FM-1 )
Days after start of differential Mg treatment 3rdleaf *** *** 0 0.3 0.6 0.9 1.2 4 6 8 10 Chl . a+b c onc ent ra ti on (μ g c h l. m g l eaf FM-1 )
Days after onset of differential Mg treatment
1st& 2ndleaf * *** * Chlor ophy ll a+ b c oncen tration (μg chl. m g -1 leaf F M )
0 0.5 1 1.5 2 2.5 4 6 8 10 Fruc to s e c onc . (μ m o l Fruc ti s e m g -1 leaf F W )
Days after start of differential Mg treatment 3rd leaf *** *** * * 0 0.2 0.4 0.6 0.8 1 4 6 8 10 Fr uc to s e c onc . (μmo l F ru c to s e m g -1 r o ot F W )
Days after start of differential Mg treatment root * * 0 0.1 0.2 0.3 0.4 0.5 0.6 4 6 8 10 Gl uc o s e c onc . (μ m o l G luc o s e m g -1 l e af )
Days after start of differential Mg treatment 5thleaf 0 0.2 0.4 0.6 0.8 1 4 6 8 10 Fru c to se c o nc . (μmo l F ru c ti se mg -1 le af F W )
Days after start of differential Mg treatment 1. & 2. leaf * 0 0.2 0.4 0.6 0.8 4 6 8 10 Fr uc to s e c onc . (μ mo l F ru c to s e mg -1 l e a f)
Days after start of differential Mg treatment 4th leaf * ** 0 0.1 0.2 0.3 0.4 0.5 0.6 4 6 8 10 Fr uc to s e c onc . (μ m o l Fr uc to s e m g -1 leaf )
Days after start of differential Mg treatment 5th leaf 0 0.2 0.4 0.6 0.8 1 4 6 8 10 S u c ro s e c onc . (μ m o l S u c ro s e m g -1 l e af FW )
Days after start of differential Mg treatment * *** *** 0 0.1 0.2 0.3 0.4 0.5 0.6 4 6 8 10 S u c ro s e c onc . (μ g S u c ros e m g -1 l e a f)
Days after start of differential Mg treatment 5th leaf Control Mg deficiency 0 0.2 0.4 0.6 0.8 1 4 6 8 10 S u c ros e c onc . (μmo l Suc ro s e m g -1 r o ot FW )
Days after start of differential Mg treatment root *** 0.0 1.0 2.0 3.0 4.0 4 6 8 10 G lu co se conc . (μ g Gluc o se mg -1 DW )
Days after onset of differential Mg treatment Root tip 0 0.2 0.4 0.6 0.8 4 6 8 10 Gl uc o s e c onc . (μ m o l G luc o s e m g -1 l e af )
Days after start of differential Mg treatment 4thleaf * Fr u c to se co nc. (μmol Gluc o se m g -1FW ) 0 0.5 1 1.5 2 2.5 4 6 8 10 G luc o s e c onc . (μ m o l G lu cose m g -1 l f F W )
Days after start of differential Mg treatment 3rdleaf *** *** 0 0.2 0.4 0.6 0.8 1 4 6 8 10 G luc os e c onc . (μ m o l G luc os e m g -1 l e af FW )
Days after start of differential Mg treatment 1st& 2nd 0 0.2 0.4 0.6 0.8 1 4 6 8 10 G luc os e c onc . (μ m o l Gl uc o s e m g -1 r o o t FW )
Days after start of differential Mg treatment Root G lu co se co n c . (μ m o l G lu co se m g -1 FW ) 0 0.2 0.4 0.6 0.8 4 6 8 10 S u c ro s e c onc . (μ gl S u c ros e m g -1 l e a f)
Days after start of differential Mg treatment *** *** 0 0.5 1 1.5 2 2.5 4 6 8 10 Suc ro s e c onc . (μ m o l S u c ros e mg -1 lea f F W )
Days after start of differential Mg treatment *** *** *** S u cr o se conc . (μ m o l G lu cose m g -1 FW ) 0.0 1.0 2.0 3.0 4.0 4 6 8 10 Fruct o se conc. (μ g F ructo se m g -1 DW )
Days after onset of differential Mg treatment Chart Title * ** 0.0 1.0 2.0 3.0 4.0 4 6 8 10 S u cro se conc. (μ g S u cr ose m g -1 DW )
Days after onset of differential Mg treatment
Chart Title
**
Days after onset of differential Mg treatment
Days after onset of differential Mg treatment
Days after onset of differential Mg treatment
Figure 12: Effect of Mg nutrition on glucose, fructose, and sucrose concentrations of maize. Control (blue) nutrient solution with 500 μM Mg, Mg deficiency (red) with 25 μM Mg; means (n = 4) ± SE. Significant differences at *P = 5%, **P = 1%, ***P=0.1%; FW = fresh weight; DW =