Exploring the Effects of Group Size and Table Size on
Interactions with Tabletop Shared-Display Groupware
Kathy Ryall, Clifton Forlines, Chia Shen
Mitsubishi Electric Research Laboratories
201 Broadway
Cambridge, MA 02139
{ryall, forlines, shen}@merl.com
Meredith Ringel Morris
Stanford University
353 Serra Mall
Stanford, CA 94305
[email protected]
ABSTRACT
Interactive tabletops have been previously proposed and studied in the domain of co-located group applications. However, little fundamental research has been done to explore the issue of size. In this paper we identify a number of size considerations for tabletop design, and present an experiment to explore some of these issues, in particular the effects of group size and table size on the speed at which the task was performed, the distribution of work among group members, issues of shared resources, and user preference for table size. Our findings shed light on (1) how work strategies are affected by group size, (2) how social interaction varies with respect to table size, and (3) how the speed of task performance is influenced by group size but not by table size. In addition, our experiments revealed that for larger groups, designers might need to add additional vertical displays for shared information. This finding opens the door for extending single-display groupware to shared-single-display groupware settings that involve multiple, shared displays.
Categories and Subject Descriptors
H.5.3. [Information Interfaces and Presentation (e.g., HCI)]: Group and Organization Interfaces.
General Terms
Design, Experimentation, Human Factors.
Keywords
Multi-user interfaces, tabletop interfaces, shared-display groupware.
1. INTRODUCTION AND MOTIVATION
Single- or shared-display groupware [25] for tabletop applications is an emerging but as yet largely unexplored research area. Until recently, most application development and experimentation were one-of-a-kind prototypes, making it difficult to reuse components or share results. Recent technology developments in multi-user input devices (e.g., DiamondTouch [4], SmartSkin [13], and DViT [22]) have made it easier to build tabletop shared-displaygroupware applications. Software infrastructure (e.g., DiamondSpin [20]) provides support for rapid prototyping of tabletop applications, and enables people to explore interface design and interaction techniques for these settings. Even with these advances some very fundamental questions remain unanswered, and in fact unasked. Some questions that have yet to be addressed relate to size – how large an interaction surface is optimal for group interaction, and how does the size of the group influence the optimal digital tabletop size?
In much the same way that a larger monitor, or even multiple monitors is more desirable in certain circumstances, intuition tells us that a larger digital tabletop is desirable. More display space permits people to display more information (e.g., documents, applications), but also raises questions of how best to use and manage the space [5]. A larger physical space should support a larger number of users, providing each with a physical space at the table and room to manipulate objects.
Since its first appearance, the form factor of the user multi-touch DiamondTouch technology has undergone many changes, most notably in the size of its touch surface. The finished size for the first generation units were 76cm x 60cm, and 98cm x 77cm for the second-generation units. One of the most-requested changes is to make it bigger. Everyone from first-time application users to long-term application developers would like to see bigger tables, and usually ask, “How big can you make this?”In an informal survey of DiamondTouch users, all twelverespondents stated that a bigger touch surface would be useful (and implicitly asked if they could get one!). The primary reasons for wanting a larger table included supporting additional users. When asked how many users they hoped to support, however, many were interested in relatively small group sizes (two to five people), although some hoped to support groups of as many as ten or twenty people. Only one or two could imagine uses for surfaces that were smaller than the original table, but they were not actively exploring that design space. When asked what size would be optimal, answers varied from “desktop” to “conference table” to arbitrarily large (via a tiling scheme).
A larger digital tabletop for shared display groupware applications does seem appealing. In addition to potentially allowing larger amounts of information to be displayed, a larger tabletop surface would also allow for each person to have some personal/private space of his own. Previously published work ([17], [18], [19], [21]) has investigated the issue of public and private workspaces for shared display groupware applications; most conclude that some amount of private space is needed. So it Permission to make digital or hard copies of all or part of this work for
personal or classroom use is granted without fee provided that copies are not made or distributed for profit or commercial advantage and that copies bear this notice and the full citation on the first page. To copy otherwise, or republish, to post on servers or to redistribute to lists, requires prior specific permission and/or a fee.
CSCW ’04, November 6–10, 2004, Chicago, Illinois, USA. Copyright 2004 ACM 1-58113-000-0/00/0004…$5.00.
would seem that bigger is better with respect to tabletop surface sizes. The question of appropriate surface size is a rich area for exploration: What is the best table size for a particular group size? How does the nature of the task influence the appropriate table size? What other factors should be considered when designing interactive shared surfaces (i.e., tabletop) environments for group activities? The determining factors for these questions will inevitably be a combination of the nature of the tasks and the size of a co-located group.
While many groups have reported experience in developing digital tabletop applications ([14], [19], [20], [27]), no one has formally examined the impact of interactive table size and its interaction with group size. In this paper we report on the results of an experiment that begins to investigate the issue of size on shared digital tabletops that afford simultaneous multi-user touch operations. In Section 2 we identify a number of size issues that are important considerations for any designer of tabletop environments. In Section 3 we describe our user study followed by its results in Section 4. We situate our work relative to earlier and current research in Section 5. We conclude in Section 6 by outlining a set of issues still to be examined and directions for future work. Throughout this paper, when we refer to tabletops, we are referring to computationally augmented tabletops that serve as interactive workspaces for groups of people, supporting simultaneous, identifiable input from multiple group members.
2. SIZE CONSIDERATIONS
In this section we identify potential issues that may arise from using larger interactive table surfaces and the tradeoffs to be considered when designing tabletop applications. Our earlier work ([19], [20]) has helped us identify a number of these issues; while some of the problems may seem obvious, they may not be apparent to people who have no direct experience using and/or designing projected tabletop environments, or who have not had access to larger interactive tables. Although our study only addresses a subset of these issues directly, we believe it is important to identify the larger set of issues so that future researchers may explore them.
Resource Management: Resources may be physical (e.g.,
papers, books) or digital (e.g., documents, images, widgets). Their position on the table (or in the more general work environment) will depend on the physical table size and the size of the group. Likewise, resource utilization depends on table and group size. For example, on larger tables it may be difficult to share one copy of a particular resource (digital or physical).
Work Strategy: One should also consider the impact of table size
on the work group dynamics – the distribution of work across group members, the different roles the members of the group may assume, and the problem-solving strategies used by the group. Studies have explored these issues in non-computer mediated settings [24], but have not explored them in shared-display groupware settings.
Social Interactions: In contrast to work strategy, which focuses
on group processes, social interaction refers to the interpersonal relationships, interactions between people, and people’s personal preferences. In a direct-touch environment, such as our digital tabletops, it is easy to directly manipulate objects on the table if they are within reach – but what if they are in someone else’s
(personal) space? Another distinguishing characteristic of our work is the multi-user interface support. The interactive tabletop we use supports parallel inputs from multiple people. With a shared single-input device system (i.e., one keyboard or mouse that is controlled by a single person or passed around amongst members of the group) it is clear what each group member is contributing. With simultaneous input, especially around larger tables, everyone may not keep track of everyone else’s actions. It may not always be clear whether everyone is contributing.
Display Resolution: In addition to the physical size of a display,
the resolution of the display is an important (and often overlooked) quality. When dealing with desktop monitors, people often talk about a “larger” monitor when what they mean is a monitor that is both larger in size and higher in resolution. The DiamondTouch devices used in our experiment, as well as other contemporary touch input surfaces such as SmartSkin and DViT, are input devices for sensing touch. A projector is used to display documents on the device surface, making projector resolution a limiting factor; simply increasing the surface area of the table therefore does not increase the amount of information that can be displayed. In the physical world, as the area of a surface increases, its resolution also increases – more documents can be placed without sacrificing readability. In the electronic world, increasing a projected surface area does not mean increasing the display resolution; for that a higher-resolution projector or multiple-projector display is required. Today’s standard projector resolution is 1024x768 pixels. While higher resolution projectors and displays are available, upgrading to a high-resolution projectors or plasma displays is typically cost-prohibitive.
Physical Reach: Another consideration is physical reach. In a
true direct-manipulation interface, if you cannot reach something, you cannot interact with it. While this seems an obvious statement, we have seen a number of situations in which menus were poorly placed, or a group size of fewer number than expected were present, making it difficult (or impossible) to reach some of the materials on the table. Interaction techniques can be developed to automatically bring objects out of reach closer to a user, such as the throw and take gestures developed in Roomware [26]; in VR settings numerous techniques (e.g., [2],[11],[12]) provide access and manipulation of objects that are out of reach. The effects of these techniques in a multi-person multi-touch environment, however, are not well understood.
Visibility: Documents on the far side of the table are not only
hard to reach, but also are hard to read. This difficulty has both benefits and drawbacks. On the positive side, people can retain a level of privacy for documents that are kept close to them and in this way create a personal area on the table. On the negative side, limiting the readability of documents on the table may limit the shared context of the group and handicap group cohesion.
Task: The impact of table size on group activities likely varies
with task type. For example, productivity tasks that can be easily accomplished in a divide-and-conquer fashion might be well-suited to a larger table size in order to provide enough room for each group member to have their own individual work area in addition to a central, shared area. However, a larger table might be detrimental to other activities such as those for entertainment, where the ability to easily see the interactions of all other group
members and the physical proximity of the group might enhance the sense of camaraderie and enjoyment. Awareness of the workspace and each other’s current activities are necessary requirements for tasks with many coordinated activities. We suspect that the impact of task type on the acceptability of a particular table size is large. In this paper we focus on one particular task that is representative of a class of tasks in which several group members work together to accomplish a goal and everyone in the group jointly owns all information.
In our study we have chosen to explore some of the above issues while consciously excluding others. We designed our study around a single task, which is described in more detail in the next section. We explore issues of table size and group size as they relate to work strategies, social interactions, and resource management. Issues relating to display resolution, physical reach, task, and visibility are left for future work.
3. USER STUDY
In this section, we describe an experiment that we conducted in order to observe groups of varying sizes working on two different table sizes on a collaborative task. The task we chose was based on the game “Magnetic Poetry” (http://www.magneticpoetry.com). Groups searched for words on the table with the goal of reproducing a target poem (Figure 1).
We gathered three sources of data: (1) direct observations of group interactions, (2) performance measurements recorded by our testing software, and (3) mid- and post-study questionnaires completed individually by each subject. We stated the following hypotheses:
H1. The size of the table will affect the speed with which groups will be able to assemble poems.
H2. The size of the group will affect the speed with which groups will be able to assemble poems.
H3. There will be an interaction effect between the size of the table and the size of the group; specifically, larger groups will benefit more from a larger table than smaller groups in terms of task time.
H4. Users’ subjective preference will be affected by the size of the table and the size of the group.
H5. The number of example poem printouts given to the group will affect the speed with which groups will be able to assemble poems.
3.1 Task Description
The experimental task we chose was a variation of Magnetic Poetry in which groups assembled target poems using word tiles on the tabletop. A printed sheet of paper showing a completed poem was handed to the group. The eight poems used in this study contained between 16 and 56 words. For each poem, all of the word tiles needed to build that poem along with an extra 124 “distracter” words were projected on the tabletop. The distracter words were randomly selected for each trial, and were included so that subjects would need to search for tiles. Poems were randomly chosen for each trial and a single poem was never given to the same group twice. All timing scores were made on a word per minute basis to account for differences in poem length.
Subjects moved tiles around the table using their finger, and all of the tiles on the table would automatically rotate as they were
Figure 1. A group of three people collaborate to assemble a poem on a 107 cm (diagonal) table.
moved around so that they always faced the outside of the table. In addition to the word tiles, the table contained a single poem container into which words were placed and arranged in order. The container behaved in the same manner as the tiles (moveable by simple touch, and obeying the same auto-rotation rules as individual tiles). In addition, words tiles placed into the container would align themselves with it. The ease of moving the container provided easy access for different people (sitting at different locations around the table), and handled the occlusion problem of word tiles that may lie beneath it. A screenshot of the testing application is shown in Figure 2.
Working together, groups would search for and then assemble the tiles needed for the poem. Many poems contained the same word multiple times, with groups only being given a single instance of it. Similarly, many of the words in a poem had to be derived from a root word on the table (such as changing “dream” to “dreams”).
Figure 2. The testing application: word tiles on the table face the outside of the table. Words placed into the gray poem container align themselves with the container.
Figure 3. Subjects used pop-up menus to duplicate or to change the beginning or ending of words.
The application provided pop-up menus to allow users to duplicate or to change the prefix or suffix of any tile. A picture of a pop-up menu is shown in Figure 3.
This task has many characteristics that we felt would be present in other collaborative around-the-table applications – searching the table for words that the poem contains, repositioning virtual objects on the table (in this case, individual word tiles), passing
tiles to other group members, and managing digital and physical shared resources (the poem container and the printed example poem). Additionally, the task included a mix of individual and collaborative activities with groups often searching for words in parallel and then assembling poems together. Our design decisions for this task (e.g., text orientation, automatic rotation, inclusion of distracter tiles) were chosen with the goal of creating a representative collaborative task.
3.2 Task Setup
3.2.1 Hardware Setup
The testing application ran on a 3 GHz Pentium 4 Windows PC. The two tables used were rectangular DiamondTouch devices, both having a 4:3 aspect ratio with touch surfaces measuring 80cm and 107cm diagonally. The touch surface is embedded in a molded case, making the finished sizes for the DiamondTouch devices 76cm x 60cm and 98cm x 77cm respectively. Although the diagonals of the two tables differ by only about 33%, the l07cm table’s touch surface is approximately 80% larger than the 80cm table, and its overall size (including the casing) is approximately 65% larger. In terms of people’s interactions with and at the table, the major difference between the two tables is that most individuals cannot sit on one of the short sides (1st User or 2nd User in Figure 4) of the 107cm table and reach all the way to the opposite side. The other difference is more psychological; the 80cm table has a cozier feeling, and may be a bit crowded for larger groups. While the choice of table sizes was limited due to the availability of the DiamondTouch hardware (and comparable touch technologies), we believe these two sizes offer enough difference to begin exploring the effect of table size for group collaborations. The computer sent a video signal to an XVGA (1024 x 768) projector, which was positioned over the table. Seats were positioned at the center of each of the four sides of the table. As shown in Figure 4, groups of two sat opposite each other across the long dimension of the table. Groups of three and four filled in the remaining two sides. The two-person groups were seated face-to-face rather than 90-degree adjacent around the corner for two key reasons. First, when sitting face-to-face, any tile is never upside down (i.e., more than 90-degrees rotated) to
Figure 4. Subjects’ seating assignments.
both users. Second, when using the larger table the entire physical surface would be reachable. Side-by-side seating was not considered, as the smaller table does not comfortably seat two people side-by-side. An investigation of seating positions for groups of varying sizes is left for future study.
3.2.2 Software Setup
The Magnetic Poetry testing application was built using the DiamondSpin toolkit [20]. It recorded the input from all of the subjects in a group. Each touch on the table was logged to a file, and recorded the time of the touch, the user ID, the position of the touch, the object being touched (a word tile, the poem container, or a menu), and the type of action being performed (picking something up, dropping something, placing into or taking a tile out of the poem container, or operating a menu).
Because the projector resolution was the same for each table, if the testing application simply projected the same image on each table, word tiles would have appeared larger on the 107cm table, since the same number of pixels would be spread out over a larger area. We were concerned that making the tiles physically larger on one of the tables would make them easier to target with one’s finger. To account for this difference, the testing application checked which of the two tables was currently active, and scaled the word tiles so that they would appear the same physical size once they were projected on either of the two tables. Each word tile was 2.54cm in height, and ranged from 1-8cm wide, depending on the length of the word.
3.3 Procedure
Groups of two, three, and four were solicited from local universities for the study. Five groups of each size participated in the experiment for a total of 45 subjects, each of whom was paid $20 for an hour of their time. Subjects’ ages ranged from 18 to 28 and were roughly evenly split by gender. All but one of the groups knew each other well before participating.
Groups were first given instructions on and allowed to experiment with moving tiles on the table with their finger, placing these tiles into the poem container, and duplicating or modifying words. Once the subjects were comfortable with the interface, they began the experimental trials. At the beginning of each trial, the groups were handed either a single printout of the completed target poem or were given as many copies as there were group members. The decision to use a single or multiple sheets was counterbalanced among the groups. The group was then asked to “build the printed poem as quickly and as accurately as you can.” Once the poem was complete, the group signaled the experimenter who would load the next trial.
Each group completed between two and four trials (as time allowed) on each of the two tables. The order of the table sizes was counterbalanced. After the group finished with the trials on each table, every subject independently filled out a questionnaire.
4. RESULTS AND OBSERVATIONS
In this section we present the findings of our study. We first present our results, based on our initial hypotheses. We then present a subset of our observations and non-hypothesized findings. In both cases we discuss the implications of our findings, and indicate new questions they raise. As noted in Section 3.2.2, our software logged people’s interactions with the touch surface. In the following discussion we measure work distributionby measuring the number of touches for each person, and a person’s roleby the types of touch.
These results exclude the data from a single trial by one of the groups of 3 people. This trial had a words-per-minute score that was over 4 standard deviations from the mean for all trials, and probably resulted from a recording or measurement error. The outlier score is visible in Figure 6.
4.1 Results
H1. The size of the table had no significant effect on the speed
with which groups were able to assemble poems. For every
poem built by each group, the testing application recorded the time between the initial presentation of the tiles on the table and the moment the final word was put into place. By dividing this time by the number of words in a poem, each poem received a words-per-minute (WPM) score for speed. The WPM means for the two table sizes were similar, with the larger table having a slightly higher mean words-per-minute (M = 4.64 vs. M = 4.34 for table sizes 107cm and 80cm respectively). A repeated measures ANOVA found no main effect for table size, F(1, 12) = 0.76, p = .40, d = 0.13. The mean WPM scores for the two table sizes are shown in Figure 5.
H2. Larger groups were significantly faster at assembling
poems than smaller groups. Larger groups had larger mean
WPM scores than smaller groups (M = 3.64 vs. M = 4.45 vs. M = 5.38 for groups of 2, 3, and 4 respectively). A repeated measures ANOVA found that there was a main effect for group size, F(2,12) = 5.56 , p = 0.019, d = 0.75. The mean WPM scores for each group size are shown in Figure 6.
While larger groups were faster (every addition of a group member increased the WPM score by about 1), it is clear that continuing to add people cannot lead to faster and faster scores. In our experiments having twice as many people working on the task did not lead to twice the speed. A future study might test groups of 5, 6, 7, and beyond to better understand the numerical relationship between group size and speed.
It became clear through observation that the majority of time was taken searching for words on the table. Because the majority of time was spent searching, we conjecture that in addition to the obvious advantage of parallelism groups of 4 had an extra advantage – they had members present at every side of the table and thus every word tile was right side up for someone. Smaller groups had the difficult task of searching through text that was more greatly rotated from their point of view. A future study might use pictures that are rotationally symmetric so that multiple viewpoints do not offer such an advantage.
H3. There was no significant interaction effect between table
size and group size. Figure 7 shows WPM scores for each table
size by each group size. A repeated measures ANOVA found no interaction effect between table size and group size, F(2, 12) = 0.14 , p = 0.87. While we were surprised that the smaller table did not penalize larger groups, we were equally surprised that using the larger table did not penalize smaller groups. The data suggests that smaller groups may have benefited more from the larger table than larger groups did – a seemingly counter-intuitive result.
M ean W or ds Per M inut e 2 3 4 5 6 7 8 107 cm 80 cm Table Size
Figure 5. Groups were not significantly faster at building poems with the 107cm table than while using the 80cm table.
Me an Wo rd s P er Min ute 2.5 3 3.5 4 4.5 5 5.5 6 6.5 2 3 4 Group Size
Figure 6. Larger groups were significantly faster at building poems than smaller groups.
WPM by Group and Table Size
0 1 2 3 4 5 6 2 3 4 Group Size M ean W or ds per M inut e 107 cm 80 cm
Figure 7. Larger groups did not benefit statistically from a larger table. Conversely, smaller groups seemed to benefit more from the larger table, although not significantly so.
After reading the questionnaire responses, we made a conjecture for this discrepancy based on the well-studied notion of the
Diffusion of Responsibility[3]. People seemed to separate the table into three areas – parts only they could reach, parts they and their partner(s) could reach, and parts only their partner(s) could reach. Subjects felt most responsible for the section only they could reach. When tiles were clearly in someone’s personal section, no coordination was needed – the responsibility for those tiles was clear. Shared sections of the table were the responsibility of “someone” (often “someone else”) – groups needed to coordinate the searching of these areas. When the large table was divided into these three sections, the size of the group determined the size of these shared spaces. Fewer people around the table lead to more personal area and less shared area. As a result, more tiles were present in an individual’s space, and therefore more tiles were clearly the responsibility of one person. On the small table, every person could reach every part of the table, so the entire workspace was “everyone’s responsibility” and thus “no one person’s responsibility”. A more detailed investigation of this effect deserves further investigation in future studies.
H4. Subjects’ agreement with certain statements about the task was affected by the size of the table, but never by the size
of the group. At the end of working on each size table, we asked
every member of each group to rate their agreement with four statements about the task. Their responses were given on a 7-point Likert scale, with 1 representing strong disagreement and 7 representing strong agreement. Subjects agreed more strongly with the statement "Overall, I felt the table was good for this task" for the large table than for the small table. A Wilcoxon matched-pairs signed-ranks test indicates that there was a significant difference in their opinions (W+ = 69, W- = 207, N = 45, p = 0.037). Subjects agreed slightly more with the statement "It was hard to reach the tiles I wanted" for the large table than for the small table, although this difference was not significant (W+ = 111.50, W- = 266.50, N = 45, p = 0.064). Subjects’ agreement with the statements “It was hard to find the tiles I wanted” and “I think my group worked very well together” were statistically indistinguishable for the two table sizes. The mean agreement with each statement for each table size is shown in Table 1. Kruskal-Wallis tests indicate that there were no significant differences in the agreements with each statement among the three group sizes. The mean agreement with each statement for each group size is shown in Table 2.
H5. The number of example poem printouts given to the
group did not significantly affect the group’s task time. For
each poem, groups were either handed a single printout of the target poem or they were given as many printouts as group members. This represents usage scenarios in which the resources of a collaborative activity are either duplicated among the users or remain a single, shared resource. While the trials with multiple sheets had a slightly higher mean WPM score (M=4.41 vs. M=4.72 for single and multiple sheets respectively), a repeated measures ANOVA found no statistical difference between these two groups, F(1,12) = 0.60, p = 0.45. The mean WPM scores for single and multiple sheet trials are shown in Figure 8.
As noted earlier, observation revealed that the majority of time was taken searching for words on the table; therefore, it is now not surprising that forcing groups to share this printed resource id not lead to longer task times, since little time was spent reading
Table 1. Agreement by table size.
80 cm 107 cm Mean (SD) Mean (SD)
p-value Overall, I felt the table was good for
this task.
5.2 (1.4) 5.7 (1.1) 0.04 It was hard to reach the tiles I wanted. 2.6 (1.3) 3.1 (1.6) 0.06 It was hard to find the tiles I wanted. 4.6 (1.4) 4.7 (1.4) 0.59 I think my group worked very well
together.
5.6 (0.8) 6.0 (1.0) 0.44
Table 2. Agreement by group size.
2 3 4 Mean (SD) Mean (SD) Mean (SD) p-value Overall, I felt the table
was good for this task.
5.4 (1.7) 5.7 (0.7) 5.3 (1.4) 0.74 It was hard to reach the
tiles I wanted.
2.7 (1.5) 3.1 (1.5) 2.7 (1.4) 0.32 It was hard to find the
tiles I wanted.
4.4 (1.5) 5.0 (1.4) 4.6 (1.2) 0.20 I think my group worked
very well together.
6.2 (0.5) 5.8 (1.3) 6.0 (0.8) 0.73 M ean W or ds Per M inut e 2 3 4 5 6 7 8 Multiple Single Number Of Sheets
Figure 8. There was no significant difference in the speed of groups using a single example poem vs. multiple poems.
the target poem. While the number of printouts did not affect the task times, its effect on group strategy is discussed in section 4.2.
4.2 Non-hypothesized Findings / Observations
This section describes additional findings drawn from 3 sources – direct observation of the groups’ interactions, the questionnaires that subjects completed after using each table size, and additional analysis of the application logs. We have organized these findings by the size considerations we identified in Section 2.4.2.1 Resource Management
The number of poem printouts given to a group affected the distribution of labor and the strategy that the group
employed. We were very interested in our data’s lack of support
for H5; the number of poem printouts given to the group did not significantly affect the group’s task time. It seemed “obvious” to
us that the extra burden of collaboration added by relying on a single sheet should have been reflected in task time. How were groups effectively adapting their strategy to the situation? The standard deviation of touches among group members tells us how equally each group member was contributing to the manipulation of word tiles on the digital tabletop. Trials in which a single example poem was given to the group had significantly higher standard deviations than trials in which multiple sheets were given out (M = 68.9 vs. M = 99.5 for multiple and single sheets respectively, F(1,12) = 6.56, p = 0.02, d = 0.65).
This numerical difference agreed with our observations. When a single sheet was given to the group, the holder of that sheet often became a conductor of sorts and took charge of coordinating the group. The conductor often said things like, “you take the first two lines, you take the next two… etc.” or told the group what words they should look for. The conductor was often less involved with the manipulation of words on the tabletop.
The size of the group greatly affected the way in which a
physical shared resource was positioned. For groups of two, the
printed poem given to the group was almost always placed flat on the table and oriented to the average point-of-view of the group members. Groups of three normally placed it flat on the table oriented toward the center group member. It was occasionally reoriented toward another member for close inspection. For groups of four, one person almost always held the single sheet vertically in the air so that everyone could read it.
This observation has implications for the design of tabletop displays. It suggests that for small groups, given that the position of people around the table is known, designers can rely on the horizontal tabletop surface to display information that is concurrently visible by all people. For larger groups, designers may need to add additional vertical displays for shared information, or they might need to provide multiple views of that information displayed at multiple orientations.
The size of the group affected the way in which the digital
shared resource was positioned and used. In general, groups of
two shared the poem container more than groups of three and four, often passing the container back and forth across the table as they worked together to assemble their poems. Larger groups usually assigned one person as the “poem assembler” and that person usually parked the poem container in front of himself as he gathered words from other members of the group.
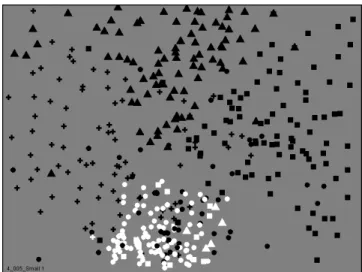
Figures 9 and 10 show the activity maps that our software recorded. The activity maps indicate both the location and the
type of each touch point, as well as who touched the table for a group of two and a group of four respectively. The shapes used in the figures indicate who was touching – squares indicate user 1, crosses are user 2, triangles are user 3, and circles are user 4. The color of the shape indicates which type of touch occurred – black indicating the picking up or dropping of a word tile and white indicating the placing of a word tile into the poem container. Figure 9 shows the roughly equal participation of both members of a group of two in placing words into the poem container. The distribution of white markers around the tabletop tells us that the poem container was frequently passed back and forth between these two subjects. Figure 10 tells a different story. In this four-person trial, almost all of the interactions with the shared poem container were performed by user 4 (white circles). Additionally, these actions occurred only in a small area of the tabletop.
Figure 9. Activity map for a two-person trial: shape indicates user, color indicates interaction with word tiles (black) or the
poem container (white). In this group of 2, both users performed a roughly equal number of operations with the
poem container.
Figure 10. Activity map for a four-person trial: in this group of 4, almost all of the interaction with the poem container (white) was performed by user 4 (circles) in a small region of the table.
4.2.2 Work Strategy
Table size did not affect the distribution of work. The testing
application logged the number and type of touches by each member of the group. We computed the standard deviation of the number of touches by each group member for every group, and then normalized these values by dividing them by the maximum possible standard deviation for that trial (a fictional case in which one group member performed all of the touches). A normalized standard deviation close to 1 meant that certain group members were manipulating documents much more than others; a normalized standard deviation close to 0 meant a more equal distribution of document manipulation among group members. There was no statistical difference between the mean normalized standard deviations of total touches for the two table sizes. Similarly, comparisons between the mean normalized standard deviations for each type of touch (picking something up, dropping
something, placing into or taking a tile out of the poem container, or operating a menu) show no differences between the two table sizes. The mean normalized standard deviations for each table size for each type of touch are shown in Table 3.
In groups of three and four, work moves from parallel mode to collective mode for the last few words whereas groups of
two work closely together throughout. We observed that groups
of two very often worked closely with one another throughout the entire trial, picking words one at a time to look for together and then placing the words into the container as they were found. Groups of three and four normally worked in a very different way, dividing the poem into sections for each subject and working in parallel to find words from their section only. Once a group member finished with his or her section, he or she would then aid a teammate in finishing other parts of the poem.
4.2.3 Social Interactions
Groups of four seemed to generate more suspicion of one another and a greater need to emphasize one’s contribution to
the task. While subjects in all group sizes would sometime
verbally blame their teammates for problems or emphasize their own contributions, this type of behavior occurred most frequently in groups of four. It was common to overhear accusations of the type “did you miss it?”, “you’re covering the words!”, “who put this extra word on here, and why?” and self-praise of the type “I
got _”, “I put it in…”, “I already duplicated it!”, and “I’m done with my part, who still needs help?”
Subjects often seemed reluctant to grab a word that was near
a partner. On several occasions, we witnessed a subject point to
a word that was well within their reach and say to their partner “we need that, grab it!” What was interesting about this behavior is why they did not simply grab the word themselves. Did subjects have a sense of their partner’s “personal space” on the table, and would reaching into this space and taking out a tile have violated some social convention? Was putting word tiles into the poem container their partner’s job and not their own? Figure 11 shows the clustering of touches into regions near each of the subjects for the same activity maps shown in Figures 9 and 10. A future study could bring subjects back into the lab to view the videotapes of their own session so that we could ask the motivation for this type of behavior.
Table 3. Table size did not affect the distribution of work for any of the 5 touch types or the total touches from each group. A mean close to 0 corresponds to an equal distribution of touches among group members; means close to 1 corresponds
to the majority of touches coming from one group member.
80 cm 107 cm
Mean (SD) Mean (SD) comparison Total touches 0.21 (0.07) 0.19 (0.08) F(1,12) = 0.65, p = 0.44 Picking a tile up 0.17 (0.05) 0.18 (0.07) F(1,12) = 0.09, p = 0.77 Dropping a tile 0.19 (0.05) 0.21 (0.08) F(1,12) = 0.28, p = 0.60 Placing a tile into
the container
0.45 (0.20) 0.50 (0.25) F(1,12) = 1.49, p = 0.25 Taking a tile out
of the container
0.66 (0.17) 0.70 (0.26) F(1,12) = 0.73, p = 0.41 Menu operation 0.67 (0.16) 0.62 (0.17) F(1,12) = 0.57, p = 0.46
Subjects’ subjective preference seems to have been influenced by the order with which they used the large and small table.
As reported above, there was a small but non-significant difference between subjects’ agreement with the statement “tiles were hard to reach” for the large and small tables; however, the order with which groups used the two tables seems to influence their opinion of the size. For groups that started with the large table, a Wilcoxon matched-pairs signed-ranks test indicates there was no significant difference between their agreement with the statement “tiles were hard to reach” for each table (W+ = 52.50, W- = 67.50, N = 45, p <= 0.67), but for groups that started with the small table, there was a significant difference (W+ = 12, W- = 66, N = 45, p <= 0.034). Similarly, groups that started with the large table rated it better overall (W+ = 10, W- = 126, N = 45, p <= 0.001) while groups that started with the small table found no significant difference between the tables (W+ = 18, W- = 10, N = 45, p <= 0.578). This influence is shown in Figure 12.
5. RELATED WORK
Group work and processes have been studied in many early observational studies. Classical group processes and group productivity have been studied in the field of social psychology for many decades. In [24], Steiner attempts to explicate the
(a) Group of two.
(b) Group of four.
Figure 11. People tended to interact in the area near where they were sitting, and hesitated to cross into other people’s sections. (Same data as Figs 9-10 with division superimposed.)
processes that influence the productivity of relatively small, task-oriented groups. Steiner states that group performance depends upon three classes of variables: task demands, resources and process. Task demands include the requirements imposed on the group by the task itself or by the rules governing task performance. Resources include all the relevant abilities, skills, tools and the like that are possessed by persons attempting to perform the task. Process refers to the steps actually taken by a group when attempting a task, including all those interpersonal and intrapersonal actions that group members engage in. In the analysis of our user study data, we have explicitly paid attention to these three variables. As Steiner pointed out, the question of "What is the effect of group size on task performance" is meaningless without a satisfactory taxonomy of tasks. The group task we examined in this paper falls into Steiner's dimensionality of divisible tasks, in which the task can be partially divided into subtasks, and the outcome of our subjects' task completion is a collaborative combination of additive subtasks.
A thorough discussion of group performance in the realm of social psychology is out of the scope of this paper. Kerr [10] provides an up-to-date review on theory and research on small group performance and decision-making processes.
Bly [1] studied groups of two people working on collaborative design. Her study included both co-located collaborative sessions, and distant sessions with media link or telephone link. She found that co-located shared space could enhance the design process. One interesting finding in this work showed that, in the face-to-face session, many interactions occurred on shared clusters of the design space. In contrast, our finding indicates people’s hesitation to reach into others’ spaces. This difference in our respective findings is due to the variation of the two task types, task demand and resources involved – ours is a divisible task while Bly’s task is a co-design task, not an additively divisible task. Group size was also not part of the Bly study.
Hall [7] discussed the phenomenon that people usually are comfortable working at arm’s length. This is a distance that preserves their personal space. Our finding of subjects’ reluctance to reach into areas of the table that are close to their partners can be partly explained by this preferred interaction distance. This also has implications in the design of the size of the table in relationship to the size of a collaborative group.
Observations by Tang [28] reported that users delineate distinct areas on a tabletop to work and interact with task objects. These areas are also used to mediate interaction among the users around the table. Group tasks that require coordination and collaborative actions might be best served by users sitting closer around a table to allow workspace awareness [23]. With respect to this body of early research, our work presented in this paper investigates how regions of a computationally augmented tabletop are being used in relationship to group size and the size of the tabletop.
Since Stewart et. al. [25] first brought forth the notion of single-display groupware, there have been numerous studies and prototypes examining the design, implementation and social issues of shared displays and interactive rooms ([8], [9], [15], [16], [17], [26]). Some of them contained computationally augmented tables as part of the environment ([14], [19], [27]). Group size has not been investigated in any of these systems so far. Scott et. al. [17] outline system guidelines for co-located
0 1 2 3 4 5 6 7
Large Table First Small Table First
Me a n A g re e m e n
t Overall, the Large table w as good forthis task Overall, the Small table w as good for this task
Tiles w ere hard to reach on the Large table
Tiles w ere hard to reach on the Small table
Figure 12. The order in which groups used the two tables affected their overall opinion of the two sizes, as well as their agreement with the statement that tiles were hard to reach (higher numbers mean more agreement with the statement).
tabletop applications. They do not, however, include any discussion of the size of the table in their guidelines.
Elliott and Hearst [6] explored size implications for an architectural task, investigating differences across three sizes of display/input surfaces: tablet, monitor, and digital desk. While this work is interesting, it includes a number of issues we chose to exclude (e.g., differing input devices, different resolutions, and different display orientations), and does not address groups of users. To our knowledge, no work on table size has been conducted for groups.
6. DISCUSSION AND CONCLUSION
User experience in working around a digital tabletop is still a largely unexplored research area. When people work in co-located groups, their interactions with the digital tabletop and with physical resources are different from when they work alone. “Does the size of digital tabletops affect collaborative task execution?” “Does group size affect collaboration around an interactive tabletop?” and “How do table size and group size interact in co-located collaboration?” are the set of research questions we begin to address in this paper. The steps we took included identifying the key issues in this research space and then carrying out user studies to examine these questions within the realm of one particular collaborative task scenario. Our findings offer interesting insights into the roles that digital table size and group size play in co-located face-to-face collaborative activities. In particular, our analysis shows that, within the two table sizes we tested, the size of the interactive tabletop does not affect the speed of task completion while the group size does. Our observations reveal that with different group sizes, people develop different work strategies in achieving the same collaborative goal. More interestingly, we see how the distribution of resources strongly influences how people work together for different group sizes, and that the work strategies used by the groups differed depending on the resource distribution. This has strong implications in the design of digital tabletops to enhance co-located group cohesion and collaboration. In addition, our experiments revealed that for larger groups designers might need to add additional vertical displays for shared information. This finding opens the door for extending single-display groupware to shared-display groupware settings with multiple shared displays. Our current research provides a strong foundation for future work. These experiments focused on a single, representative
collaborative task. It was designed to incorporate many characteristics that we felt would be present in other collaborative around-the-table applications -- search, manipulation, and coordination of documents and objects as well as management of shared resources; the task includes a mix of individual and collaborative activities, typical of group work practices [28]. Examining size-related issues across a larger number of tasks would provide additional insights. Content creation and multi-device interaction, and mixed-surface interactions (e.g., wall and table) considerations are also left to future work. Of the size considerations we identified in Section 2, this current study focused on supporting additional users (particularly in an around-the-table configuration) and touched a bit on personal workspaces for individuals. Display resolution and physical reach are two particularly important issues not yet addressed by our work. The work presented in this paper is only a beginning in our research effort in understanding how people interact around computationally augmented tabletops in particular, and what the salient parameters are in the design of effective shared-display groupware at large. The findings reported in this paper provide initial guidelines for interactive tabletop designers, while at the same time bring forth open questions that require further probing.
7. ACKNOWLEDGMENTS
The authors would like to thank Kate Everitt and Mike Wu for their discussions on tabletop computing environments, Kori Inkpen for helping us to clarify some of the evaluation results, and all the reviewers whose comments strengthened our paper.
8. REFERENCES
[1] Bly, S.A., A Use of Drawing Surfaces in Different Collaborative
Settings. Proc. Of the ACM Conference on Computer-Supported Cooperative Work (CSCW) 1988, 250-256.
[2] Bowman, D., and Hodges, L. An Evaluation of Techniques for
Grabbing and Manipulating Remote Objects in Immersive Virtual Environments. 1997 Symposium on Interactive 3D Graphics, pages 35-38.
[3] Darley, J.M., and Latane, B., Bystander intervention in
emergencies: Diffusion of responsibility. Journal of Personality and Social Psychology, 8, 377-383. 1968.
[4] Dietz, P. and Leigh, D. DiamondTouch: A Multi-User Touch
Technology. Proc. UIST 2001, 219-226.
[5] Grudin, J. Partitioning Digital Worlds: Focal and Peripheral
Awareness in Multiple Monitor Use. Proc. CHI 2001, 458-465.
[6] Elliott, A., and Hearst, M. A Comparison of the affordances of a
digital desk and tablet for architectural image tasks. International Journal of Human-Computer Studies, 56(2), 173-197.
[7] Hall, E.T. Distances in Man: The Hidden Dimension. Double
Day, Garden City, NY.
[8] Izadi, S. et al. Dynamo: A Public Interactive Surface Supporting
the Cooperative Sharing and Exchange of Media. Proc. UIST
2003, 159-168.
[9] Johanson, B., A. Fox, and T. Winograd. Experiences with
Ubiquitous Computing Rooms. IEEEPervasive Computing
Magazine, 1 (2002): 67-74.
[10] Kerr, N., Group Performance and Decision Making, Annual Review of Psychology, January 2004, Vol. 55, pp. 623-655.
[11] Pierce, J., Stearns, B., and Pausch, R. Voodoo Dolls: Seamless Interaction at Multiple Scales in Virtual Environments.
Proceedings of the 1999 Symposium on Interactive 3D Graphics, pages 141-145.
[12] Poupyrev, I., Billinghurst, M., Weghorst, S., and Ichikawa, T. Go-Go Interaction Technique: Non-Linear Mapping for Direct Manipulation in VR. Proceedings of UIST 1996, pages 79-80. [13] Rekimoto, J. SmartSkin: An Infrastructure for Freehand
Manipulation on Interactive Surfaces. Proc. CHI 2001, 113-120.
[14] Rekimoto, J., and Saitoh, M. Augmented surfaces: a spatially continuous work space for hybrid computing environments. Proceedings of CHI 1999, ACM Press, 378-385.
[15] Rogers, Y., Hazlewood, W., Blevis, E., and Lim, Y-K. Finger Talk: Collaborative Decision-Making Using Talk and Fingertip
Interaction Around a Tabletop Display. Proc. CHI 2004
Extended Abstracts, 1271-1274.
[16] Russell, D.M., Drew, C., and Sue, A. Social Aspects of Using Large Public Interactive Displays for Collaboration,[8]
UbiComp 2002. LNCS 2498. 229-236.
[17] Scott, S.D., Grant, K.D., and Mandryk, R.L. System Guidelines
for Co-located Collaborative Work on a Tabletop Display. Proc.
ECSCW 2003, 159-178.
[18] Scott, S.D., Carpendale, M.S.T, and Inkpen, K.M. (2004).
Territoriality in Collaborative Tabletop Workspaces. Proc.
CSCW 2004. To appear.
[19] Shen, C., Everitt, K., and Ryall, K. UbiTable: Impromptu
Face-to-Face Collaboration on Horizontal Interactive Surfaces. Proc.
UbiComp 2003, 218-288.
[20] Shen. C., Vernier, F., Forlines, C., and Ringel, M. DiamondSpin: An Extensible Toolkit for Around-the-Table
Interaction. Proc. CHI 2004, 167-174.
[21] Shoemaker, G. and Inkpen, K. Single Display Privacyware: Augmenting Public Displays with Private Information.
Proceedings of CHI 2001, 522-529.
[22] SMART Technologies. “Digital Vision Touch Technology.” White Paper, February 2003.
http://www.smarttech.com/dvit/DViT_white_paper.pdf. [23] Sommer, R. Personal Space: The Behaviour Basis of Design.
Prentice-Hall, Englewood Cliffs, N.J. 1969.
[24] Steiner, I. (1972). Group Process and Productivity, New York, NY: Academic Press.
[25] Stewart, J., Bederson, B., and Druin, A. Single Display
Groupware: A Model for Co-present Collaboration. Proc. CHI
1999, 286-293.
[26] Streitz, N.A., Tandler, P., Müller-Tomfelde, C., and Konomi, S. Roomware. Towards the Next Generation of Human-Computer Interaction based on an Integrated Design of Real and Virtual
Worlds. In: J. A. Carroll (Ed.): Human-Computer Interaction in
the New Millennium, Addison Wesley (2001), 553-578.
[27] Tandler, P., Prante., T., Muller-Tomfelde, C., Streitz, N., Steinmetz, R. ConnecTables: Dynamic Coupling of Displays for
the Flexible Creation of Shared Workspaces. Proc. of ACM
UIST2001, 11-20.
[28] Tang, J. (1991) Findings from Observational Studies of
Collaborative Work. International Journal of Man-Machine