Portland State University Portland State University
PDXScholar
PDXScholar
TREC Final Reports Transportation Research and Education Center (TREC)
7-2018
Evaluating and Enhancing Public Transit Systems for
Evaluating and Enhancing Public Transit Systems for
Operational Efficiency and Access Equity
Operational Efficiency and Access Equity
Ran Wei
University of California, Riverside Aaron Golub
Portland State University, [email protected] Liming Wang
Portland State University Thomas Cova
University of Utah
Follow this and additional works at: https://pdxscholar.library.pdx.edu/trec_reports
Part of the Transportation Commons, and the Urban Studies Commons
Let us know how access to this document benefits you.
Recommended Citation Recommended Citation
Wei, Ran, Aaron Golub, Liming Wang, and Thomas Cova. Evaluating and enhancing public transit systems for operational efficiency, service quality and access equity. NITC-RR-1024. Portland, OR: Transportation Research and Education Center (TREC), 2018. https://doi.org/10.15760/trec.203
This Report is brought to you for free and open access. It has been accepted for inclusion in TREC Final Reports by an authorized administrator of PDXScholar. For more information, please contact [email protected].
Evaluating and Enhancing Public Transit Systems
for Operational Efficiency and Access Equity
FINAL REPORT
NITC-RR-1024 July 2018
NITC is a U.S. Department of Transportation national university transportation center.
EVALUATING AND ENHANCING PUBLIC TRANSIT
SYSTEMS FOR OPERATIONAL EFFICIENCY AND
ACCESS EQUITY
Final Report
NITC-RR-1024
by Ran Wei (PI)
University of California, Riverside Aaron Golub
Liming Wang Portland State University
Thomas Cova University of Utah
for
National Institute for Transportation and Communities (NITC) P.O. Box 751
Portland, OR 97207
iii Technical Report Documentation Page
1. Report No. NITC-RR-1024
2. Government Accession No. 3. Recipient’s Catalog No.
4. Title and Subtitle
Evaluating and enhancing public transit systems for operational efficiency and access equity
5. Report Date July 2018
6. Performing Organization Code 7. Author(s)
Ran Wei (PI), Liming Wang, Aaron Golub, Thomas Cova
8. Performing Organization Report No.
9. Performing Organization Name and Address Department of Geography
University of Utah 332 S 1400 E, RM. 217 Salt Lake City, UT 84112
10. Work Unit No. (TRAIS) 11. Contract or Grant No.
NITC-RR-1024
12. Sponsoring Agency Name and Address
National Institute for Transportation and Communities (NITC) P.O. Box 751
Portland, OR 97207
13. Type of Report and Period Covered Final report
14. Sponsoring Agency Code
15. Supplementary Notes
16. Abstract
Assessing the performance of public transit services has long been an important yet challenging issue for transportation agencies and researchers. Transit service performance measurement reflects a very first step towards an efficient and proactive management, where public transit agencies are increasingly pressured to provide high-quality services in spite of constrained resources. However, the performance evaluation of transit services is complicated by an array of quantitative measures available to assess the goals and the diversity in the goals themselves, which usually include improving operational efficiency and providing equitable access. While much previous work has examined public transit services for achieving optimal operational efficiency and/or access equity separately, the interplay of the two has rarely been investigated to date.
This project developed a comprehensive framework and an open-source toolbox for evaluating and enhancing the overall performance of public transit systems by using a combination of mathematical programming methods, GIS-based analysis and multi-objective spatial optimization techniques. This framework enabled operational efficiency and access equity of transit systems to be assessed in an integrated manner. The python open-source toolbox operationalized the framework and make it accessible to transit planners, decision-makers and the public. The framework and the toolbox are applied to assessing the performance of fixed-route bus services operated by the Utah Transit Authorities (UTA) in the Wasatch Front, Utah, and transit services operated by TriMet in the Portland metropolitan area. Results demonstrate that the developed framework and toolbox can effectively account for operational efficiency and access equity in an integrated manner, providing a more comprehensive assessment for transit service performance.
17. Key Words
Operational efficiency; access equity; transit service; performance analysis
18. Distribution Statement
No restrictions. Copies available from NITC: www.nitc-utc.net
19. Security Classification (of this report) Unclassified
20. Security Classification (of this page) Unclassified
21. No. of Pages 39
iv
ACKNOWLEDGEMENTS
This project was funded by the National Institute for Transportation and Communities (NITC) under grant number (1024). The project also benefitted from matches from the Oregon
Department of Transportation, TriMet, University of Utah, and Portland State University. Furthermore, we acknowledge and thank the anonymous peer reviewers who provided helpful insights and corrections to the report, which is published in the Journal of Transport Geography
(Wei et al., 2017).
DISCLAIMER
The contents of this report reflect the views of the authors, who are solely responsible for the facts and the accuracy of the material and information presented herein. This document is disseminated under the sponsorship of the U.S. Department of Transportation University Transportation Centers Program in the interest of information exchange. The U.S. Government assumes no liability for the contents or use thereof. The contents do not necessarily reflect the official views of the U.S. Government. This report does not constitute a standard, specification, or regulation.
RECOMMENDED CITATION
Wei, Ran, Aaron Golub, Liming Wang, and Thomas Cova. Evaluating and enhancing public transit systems for operational efficiency, service quality and access equity. NITC-RR-1024. Portland, OR: Transportation Research and Education Center (TREC), 2018.
v TABLE OF CONTENTS EXECUTIVE SUMMARY ... 1 1.0 INTRODUCTION... 2 2.0 BACKGROUND ... 3 3.0 METHODOLOGY ... 4 3.1 OPERATIONAL EFFICIENCY ... 5 3.2 ACCESS EQUITY... 6 3.3 OVERALL PERFORMANCE ... 9 4.0 CASE STUDIES ... 10
4.1 SALT LAKE CITY METROPOLITAN AREA... 10
4.1.1 Data ... 10
4.1.2 Operational efficiency result ... 11
4.1.3 Access equity result ... 13
4.1.4 Overall performance result ... 15
4.2 PORTLAND METROPOLITAN AREA ... 17
4.2.1 Data ... 17
4.2.2 Operational efficiency result ... 17
4.2.3 Access equity result ... 18
4.2.4 Overall performance result ... 20
5.0 DISCUSSION AND CONCLUSIONS ... 22
6.0 REFERENCES ... 24
APPENDICES
APPENDIX A: MANUEL OF THE OPEN-SOURCE TOOLBOX FOR TRANSIT SERVICE PERFORMANCE EVALUATION
vi
LIST OF TABLES
Table 4.1: Top and bottom 10 performers in operational efficiency for UTA ... 11
Table 4.2: Top 30 performers in operational efficiency for TriMet ... 17
Table 4.3: Top 30 performers in the served number of population of color for TriMet ... 19
Table 4.4: Top 30 performers in the served number of population in poverty for TriMet ... 19
LIST OF FIGURES
Figure 3.1: Construction of least common demand coverage units (LCDCUs)……….8Figure 4.1: Study area and bus routes operated by UTA ... 10
Figure 4.2: Operational efficiency scores for bus routes operated by UTA ... 12
Figure 4.3: Trade-off curve of disadvantaged population served and remaining bus routes ... 13
Figure 4.4: Top and bottom 10 performers in access equity for UTA ... 14
Figure 4.5: Trade-off curve for operational efficiency and access equity for UTA ... 15
Figure 4.6: Top and bottom 10 performers in overall performance for UTA ... 16
Figure 4.7: Operational efficiency scores for transit routes operated by TriMet ... 18
Figure 4.8: Overall performance for transit routes operated by TriMet (population of color) ... 21 Figure 4.9: Overall performance for transit routes operated by TriMet (population in poverty) . 21
1
EXECUTIVE SUMMARY
Regular assessment and improvement of public transit service performance are essential for transit agencies given limited funding and growing public needs. Performance evaluation can help transit agencies identify underperforming services, plan for potential investments, justify previous investments, and communicate accomplishments and challenges. However, the evaluation of transit service performance is complex and challenging due to the diverse and competing goals set forth by any agency, such as improving operational efficiency, providing equitable and just transit services, etc. For example, to improve operational efficiency, transit agencies aim to achieve the highest ridership possible with the least operational costs, whereas the equity objective mandates them to extend services to neighborhoods with high concentrations of minorities and low-income residents but also to evaluate the equity impacts of proposed route changes.
While much previous work has examined public transit services for achieving optimal operational efficiency and access equity separately, the interplay of the two has rarely been investigated in research or practice. There is a need for techniques that can evaluate operational efficiency and equitable access holistically, providing a comprehensive assessment for transit service performance. This project developed a comprehensive framework and an open-source toolbox for evaluating and enhancing the overall performance of public transit systems by using a combination of mathematical programming methods, GIS-based analysis and multi-objective spatial optimization techniques. This framework enabled operational efficiency and access equity of transit systems to be assessed in an integrated manner. The python open-source toolbox
operationalized the framework and made it accessible to transit planners, decision-makers and the public. The framework and the toolbox are applied to assessing the performance of fixed-route bus services operated by the Utah Transit Authorities (UTA) in the Wasatch Front, Utah, and transit services operated by TriMet in the Portland metropolitan area. The application results demonstrated that the developed framework and toolbox enable operational efficiency and access equity of transit services to be assessed in an integrated manner, as well as the effective
identification of top performers that can best achieve these multi-dimensional objectives, and bottom performers that are candidates for service modification and consolidation.
2
1.0
INTRODUCTION
Regular assessment and improvement of public transit service performance are essential for transit agencies given limited funding and growing public needs. Performance evaluation can help transit agencies identify underperforming services, plan for potential investments, justify previous investments, and communicate accomplishments and challenges (Bertini and El-Geneidy, 2003; Hassan et al., 2013). However, the evaluation of transit service performance is complex and challenging due to the diverse and competing goals set forth by any agency, such as improving operational efficiency, providing equitable and just transit services, etc. (Chu et al., 1992; Lao and Liu, 2009; Delbosc and Currie, 2011; Delmelle and Casas, 2011). For example, to improve operational efficiency, transit agencies aim to achieve the highest ridership possible with the least operational costs, whereas the equity objective mandates them to extend services to neighborhoods with high concentrations of minorities and low-income residents but also to evaluate the equity impacts of proposed route changes (FTA, 2012).
While much previous work has examined public transit services for achieving optimal operational efficiency and access equity separately, the interplay of the two has rarely been investigated in research or practice. This is a significant gap in the literature and in building an integrated conceptual framework for transit service performance evaluation. First, operational efficiency and access equity are both critical to the well-being of any transit system. Second, operational efficiency and access equity are often at odds with each other as underperforming in costs/ridership may occur when transit is achieving the important social goal of providing
mobility to dependent populations and vice versa, indicating the need for some intricate trade-off to balance the efficiency of transit operations with equitable coverage of service provision. Third, efforts to explore trade-offs require specifically tailored modeling approaches. As a result, there is a need for techniques that can evaluate operational efficiency and equitable access holistically, providing a comprehensive assessment for transit service performance.
This project developed a comprehensive framework and an open-source toolbox for evaluating and enhancing the overall performance of public transit systems by using a combination of mathematical programming methods, GIS-based analysis and multi-objective spatial
optimization techniques. This framework enabled operational efficiency and access equity of transit systems to be assessed in an integrated manner. The python open-source toolbox operationalized the framework and made it accessible to transit planners, decision-makers and the public. The framework and the toolbox are applied to assessing the performance of fixed- route bus services operated by the Utah Transit Authorities (UTA) in the Wasatch Front, Utah, and transit services operated by TriMet in the Portland metropolitan area. The application results demonstrated that the developed framework and toolbox enable operational efficiency and access equity of transit services to be assessed in an integrated manner, as well as the effective
identification of top performers that can best achieve these multi-dimensional objectives, and bottom performers that are candidates for service modification and consolidation.
3
In the next section, we provide a review of existing performance evaluation methods for public transit services. This is followed by details of our proposed framework for the holistic evaluation of operational efficiency and access equity. Finally, the integrated framework is applied to the Utah Transit Authority (UTA) transit network in the state of Utah and the TriMet transit network in the state of Oregon, highlighting the effectiveness of our proposed method in two case studies. This report closes with a discussion and conclusions.
2.0
BACKGROUND
Assessing performance of public transit systems has long been an important yet challenging issue for transportation researchers and authorities. It has spurred efforts by researchers and practitioners to develop quantitative measures to assess the degree to which the intended goals of transit agencies are being achieved. Such measures have largely focused on evaluating the performance of public transit systems from operational perspectives. Tomazinis (1977) and Fielding et al. (1978) proposed an extensive list of performance indicators (PIs) to measure transit performance, whereas Fielding et al. (1985) reduced this list to seven key variables, such as revenue vehicles hours (hours traveled when the vehicle is in revenue service) per dollar of operating expense, passengers per revenue vehicle hours, operating revenue per operating expense, etc. The major issue with these studies, however, is that none of the individual performance indicators can provide a holistic measure for transit performance (Benjamin & Obeng, 1990). Given this, data envelopment analysis (DEA), a nonparametric method to evaluate relative efficiencies of decision-making units compared to the most efficient peers, is
increasingly used to evaluate the performance of a transit agency relative to its peer agencies, providing a single overall measure for operational efficiency of public transit systems (Chu et al., 1992; Karlaftis, 2004; Arman et al., 2013, etc.). Other studies also used the DEA method to evaluate the performance of each individual transit route within a transit agency (Lao and Liu, 2009; Hawas et al., 2012). In addition to the DEA, multi-criteria evaluation methods, such as Analytical Hierarchy Process (AHP) and Technique of Order Preference by Similarity to Ideal Solution (TOPSIS), have been adopted to generate overall operational performance measures for public transit network (Hassan et al., 2013). Yet access equity has seldom been considered in these aforementioned approaches.
Providing equitable and just access to public transportation is an important planning goal of transit agencies given their social service nature (Martens et al., 2012; Taylor and Morris, 2015). There have been many attempts in the literature to assess equity in service provision in isolation. Existing studies linked public transit and social exclusion by identifying individuals who are most likely in need of public transit services. Garrett and Taylor (1999) analyzed the
demographics of transit riders and concluded that minorities and low-income residents are more transit dependent, while Taylor and Morris (2015) questioned the continued focus on providing services for higher-income “choice” riders given the demographic realities of transit users. Johnson et al. (2010) contested the logic of car ownership as a measure of social disadvantage due to its complex role to low-income households. Foth et al. (2013) considered labor force participation, immigration status, and household rent expenditure in measuring social
4
disadvantage and transit need. To understand how to measure and address equity in transit service provision, there is a thread of the literature that developed various accessibility measures to assess spatial equity of the transit system. For example, given the definitions of
transit-dependent population, Murray and Davis (2001) compared the distribution of transit-transit-dependent populations with that of public transportation provision to identify transportation disadvantaged areas in Queensland, Australia. Delbosc and Currie (2011) used Lorenz Curves to spatially compare public transportation provision with population and employment distributions to
illustrate transit inequity across Melbourne. A similar case study was performed by Delmelle and Casas (2012) in a developing country, Cali, Colombia. Other examples can be found in Wu and Hine (2003), Currie (2004), Mamun and Lownes (2011), and Foth et al. (2013), and a recent and detailed review on transit accessibility can be found in Fayyaz et al. (2017). However, none of these papers consider the costs or economic inefficiencies required to achieve social equity, representing a major gap in research and planning practice.
As presented above, even though performance evaluation of public transit services has been extensively studied, the operational efficiency and access equity of public transit services have not been examined in an integrated manner. The lack of such a cohesive approach makes it difficult, if not impossible, to derive a comprehensive assessment for transit service performance, potentially leading to suboptimal decision-making in service planning and operation. This project aims to fill this research gap by developing a new method to account for operational efficiency and access equity in an integrated framework for transit service performance evaluation.
3.0
METHODOLOGY
Considering that both operational efficiency and access equity are critical to the well-being of public transit services, it is necessary to take into account both of them to provide a
comprehensive transit service performance assessment. To achieve this, the DEA, GIS, and spatial optimization models are integrated together for producing a more holistic measure. Specifically, the number of passengers is combined with the capital, labor and fuel investments associated with each transit service/route in a DEA model for determining the operational efficiency (Chu et al., 1992; Lao and Liu, 2009). The access equity of transit services is assessed based on whether each transit service provides unique and necessary service coverage for
disadvantaged populations. This is accomplished by using a spatial optimization model, the maximal covering location problem (MCLP) (Church and ReVelle, 1974), combined with a scale-independent areal interpolation method (Cromley et al., 2011). Once the operational efficiency scores are derived from the DEA model, the MCLP will be extended into a multi-objective optimization model that maximizes potential service coverage of disadvantaged populations as well as operational efficiency in the public transit system. This multi-objective optimization model will allow the exploration of trade-offs between these two potentially competing goals and enable the performance of transit services to be assessed in a holistic manner.
5
3.1
OPERATIONAL EFFICIENCY
DEA is a nonparametric method to evaluate relative efficiencies of peer units or decision-making units (DMU) in their utilization of resources compared to measured output (Charnes et al., 1978; Banker et al., 1984). Specifically, the relative efficiency of a DMU is measured by the ratio of the output to the weighted input. Note that placing different emphasis on the input variables could lead to totally different efficiency results. To avoid such potential bias, output-oriented DEA assigns weights to the inputs of a DMU that give the unit the best possible efficiency in comparison with other units. In this way, it establishes an optimal level of output for the DMUs, given various possible combinations of inputs. This derived, optimal level is used as a
benchmark to assess all of the DMUs (Grubesic and Wei, 2012).
For the particular problem of transit systems, transit routes serve as the DMU. The average number of passengers per day functions as the output of interest as maximizing the average ridership reflects the goal of a transit agency, and the ridership is also a good surrogate for revenues (Lao and Liu, 2009). Because labor, capital and energy are the most commonly used inputs in the DEA literature for evaluating operational efficiencies of transit agencies and services (Chu et al., 1992; Lao and Liu, 2009; Hawas et al., 2012; Arman et al., 2013), the input variables include a measure of labor (total operation time per day), a measure of capital (number of operating buses per day), and a measure of fuel consumed (total operating mileage per day). Given the set of transit routes (N), let k represent the index of the route whose relative efficiency is to be evaluated. As mentioned previously, the relative efficiency of the kth route is measured by the ratio of the output to the weighted sum of inputs. The values of the weights and relative efficiency for the kth route ( ), are determined by an optimization model, denoted as ,as follows:
DEA Model
where, for transit route j,
and v1, v2, and v3 are decision variables indicating the weights associated with the inputs. The
objective (3-1), is to maximize the relative efficiency of the transit route, . Constraints (3-2) ensure that each of the transit routes, using the same weights, has a relative efficiency measure that is less than or equal to one. Constraint (3-3) requires that the weights are positive. In this
6
way, the optimal performance of the kth transit route can be compared with its peers. This
optimization model can be converted to a linear programming (LP) model as shown in Charnel et al. (1978) and can be efficiently solved using an LP solver. The optimal objective value, , in model Rk, gives the relative efficiency score for the kth transit route. In order to derive the
relative efficiency score for each of the N transit routes, model Rk, must be structured and solved times, once for every route .
The operational efficiency score for each transit route, , ranges from 0 to 1. Transit routes with scores of 1.0 are performing the best compared to their peers based on inputs and outputs. Such transit routes are operationally efficient in the sense of maximizing ridership, given their labor, capital, and fuel expenses. While this group will most likely consist of transit routes with
relatively high ridership, it may also include transit routes with low ridership because the number of operating buses is few, the total operation time is short, or the total operating mileage is low. In other words, both high- and low-ridership transit routes can be operationally efficient because the DEA merely evaluates how well a transit route utilizes its resources, whether abundant or sparse, to produce the associated ridership. Transit routes with an operational efficiency score close to 0 are less operationally efficient. In these instances, transit routes may exhibit high ridership, but the results are suggesting an inefficient use of inputs (e.g., many operating buses, long operation time, or high mileage). This implies the existence of excess resources. A similar situation can occur for transit routes with low ridership, too.
3.2
ACCESS EQUITY
The access equity of transit routes is evaluated based on whether a transit route provides unique and necessary service coverage for disadvantaged populations. To accomplish this, we rely upon a spatial optimization model, the maximal covering location problem (MCLP) (Church and ReVelle, 1974), as well as a scale-independent areal interpolation method (Cromley et al., 2011). The MCLP and its various extensions have been widely used to evaluate or optimize the access and accessibility of public transit by seeking the spatial configurations of a transit system that maximize the potential demand coverage (Murray et al., 1998; Murray, 2003; Wu and Murray, 2005; Delmelle et al., 2012). Consider the following notation:
The demand units, , are usually areal units like census blocks, block groups, or buffer zones around transit routes or stops. If a demand unit i can access a stop of transit route j within a certain distance or time window, it is assumed that transit route j can appropriately serve the
7
demand unit, . There are seven groups of disadvantaged populations that we are especially interested in with respect to measuring their access to transit services given that existing studies consider them as transit-dependent populations (Murray and Davis, 2001; Lao and Liu, 2009): 1) population ages 65 years and older, 2) children ages between 6 and 12, 3) households without a car, 4) unemployed population, 5) disabled population, 6) population below poverty level, and 7) non-white population. gi can be defined as the total population of these seven disadvantaged groups in demand unit i.
Previous studies have shown that the spatial representation and scale could significantly impact transit service assessment and it is recommended to use the most disaggregate areal units to depict the demand (Horner and Murray, 2004; Biba et al., 2010). Considering the availability of demographic and socioeconomic information, census block groups would be the most
disaggregate areal units that we can use to estimate the disadvantaged population. As people are typically assumed to be served by bus transit if they are within 0.25 miles of a stop, or served by rail transit if they are within 0.5 miles of a stop (Sanchez, 1999; Horner and Murray, 2004; Lao and Liu, 2009; El-Geneidy et al., 2014), the service area of each transit route could be
determined by buffering its corresponding stops with a given walking distance limit and performing a spatial union of all buffered areas.
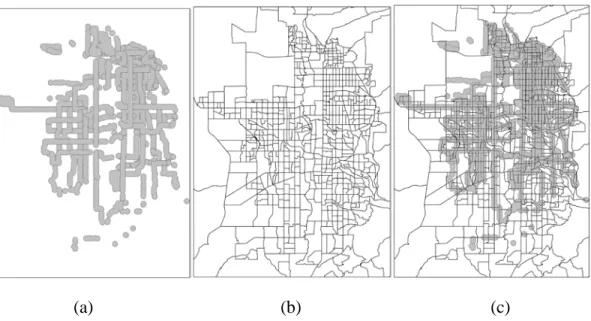
The most intuitive approach would be to use block groups as demand units and measure whether the centroids of block groups are within the service areas of transit routes to determine . However, the use of block groups as demand units in the MCLP could result in significant modeling errors due to spatial representation as detailed in Cromley et al. (2011), Wei and Murray (2014), Wei (2016) and Tong and Wei (2016). A scale-independent areal interpolation method proposed by Cromley et al. (2011) is therefore utilized to identify the finest level of geographic resolution needed for demand units in order to avoid such representation errors. This method relies on the overlay of original demand unit layer, which is the block group layer (Figure 3.1(b)), with the service coverage layer of transit routes (Figure 3.1(a)) to identify the least common demand coverage units (LCDCUs) as the error-free demand representation (Figure 3.1(c)). Then areal interpolation is used to estimate the disadvantaged population in each
8
(a) (b) (c)
Figure 3.1: Construction of least common demand coverage units (LCDCUs) (a) Transit service area (b) Block group (c) LCDCUs created by overlay
With the LCDCU defined as demand units, the MCLP can be formulated as follows:
Maximal covering location problem (MCLP)
The objective (3-4), is to maximize the total disadvantaged population members served by transit routes (zd). Constraints (3-5) track whether demand in unit i is suitably served by one or more transit routes that remain in the system. Constraint (3-6) limits the number of transit routes that are to remain in the system. This is used to enable the performance evaluation of transit routes rather than set a true limit on the size of transit system. Constraints (3-7) specify integer requirements on decision variables.
The MCLP offers a strategic approach for evaluating whether all of the current transit routes actually provide unique and necessary service geographic coverage of disadvantaged
9
based on their service coverage of disadvantaged populations. For example, when only 10 existing transit routes are assumed to remain in the system (𝑝𝑝=10), we can observe the maximal coverage that can be achieved using only 10 transit routes and identify these 10 best-performing transit routes in terms of access equity.
3.3
OVERALL PERFORMANCE
In order to evaluate operational efficiency and equitable access holistically, the MCLP is extended into a bi-objective optimization model that maximizes potential service coverage of disadvantaged populations as well as operational efficiency in the public transit system by incorporating another objective as follows:
This additional objective function, (3-8), seeks to maximize the total operational efficiency of the transit routes that remain in the system (z𝑜𝑜). This new bi-objective optimization model can be used to assess transit routes by their ability to achieve both operational efficiency and potential service coverage of disadvantaged populations. As this model has two objectives, the weighting method where the two objectives are combined using a weight parameter can be used to identify trade-off solutions (see Cohen, 1978), providing insights on the trade-off between these two competing goals. This is accomplished by:
Objectives (3-4) and (3-8) can be replaced with objective (3-9), and the model can be solved as an MCLP. It has been proven that the weighting method can guarantee the identified solutions are Pareto-optimal if the weights are positive for all objectives and the transformed single-objective model is optimally solved (Garey and Johnson, 1979). A diversity of trade-off
solutions along Pareto-optimal front can usually be identified by varying 𝑤𝑤𝑜𝑜 from 0 to 1, but this requires that the magnitude of these two objective values be similar. As a result, the
disadvantaged population in unit i, gi, is standardized as follows to ensure similar magnitude as efficiency score :
In this manner, also ranges from 0 to 1 as and a diverse set of trade-off solutions can be identified by varying weight 𝑤𝑤𝑜𝑜 uniformly from 0 to 1.
10
4.0
CASE STUDIES
4.1
SALT LAKE CITY METROPOLITAN AREA
The proposed method is used to examine the fixed-route bus services operated by UTA. UTA is the primary transit provider throughout the Wasatch Front of Utah, which includes the
metropolitan areas of Salt Lake City, Park City, Provo, Ogden, and Tooele. The Wasatch Front is approximately 120 miles long and has an average width of five miles due to the natural barriers of Wasatch Mountains and lakes. With an annual budget of $275 million, the UTA’s service area contains almost 2.2 million people, accounting for 79% of the state’s total population.
4.1.1
Data
All the fixed-route bus data, including average daily ridership, operation time per day, operating mileage per day, and number of operating buses per day, were obtained from the UTA and based on August 2016 operations. The data show that there are 94 fixed bus routes running on
weekdays, which are the focus of this study and are shown in Figure 4.1. The disadvantaged population data were summarized from the 2009-2014 American Community Survey estimates at the block group level.
11
The algorithms to perform the DEA, generate the LCDCUs, structure and solve the MCLP and its multi-objective extension, have been implemented in an open-source Python library which has been made publicly available at GitHub (https://github.com/rwei5/Transit-Performance). The DEA results have been validated using the Frontier analyst, a commercial DEA software package (Banxia, 2017). The LCDCUs have been validated using ArcGIS, a commercial GIS software package (Esri, 2017). The solutions of the MCLP and its multi-objective extension have been validated using Gurobi, a commercial optimization package (Gurobi, 2017).
4.1.2
Operational efficiency result
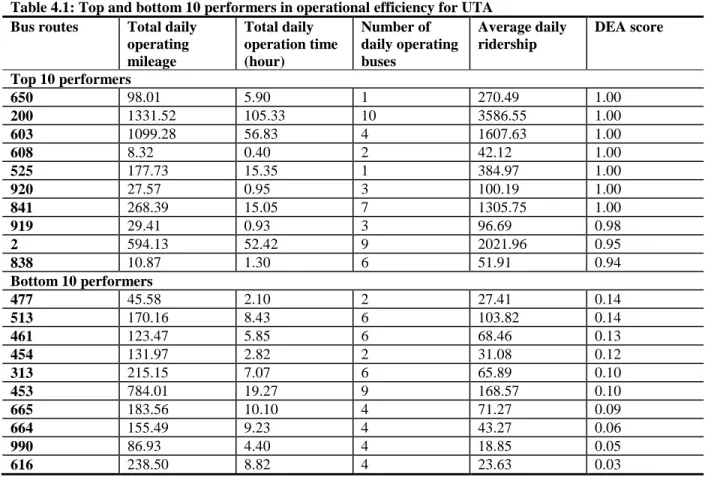
As described earlier, the DEA model used for the operational efficiency analysis of bus routes contains three variables to benchmark average daily ridership – total daily operation time (labor), number of daily operating buses (capital), and total daily operating mileage (fuel). Table 4.1 displays the top and bottom 10 performers in terms of operational efficiency, their associated input variables and output DEA scores. Figure 4.2 provides a broader snapshot of DEA scores for all bus routes operated by the UTA.
Table 4.1: Top and bottom 10 performers in operational efficiency for UTA Bus routes Total daily
operating mileage Total daily operation time (hour) Number of daily operating buses Average daily ridership DEA score Top 10 performers 650 98.01 5.90 1 270.49 1.00 200 1331.52 105.33 10 3586.55 1.00 603 1099.28 56.83 4 1607.63 1.00 608 8.32 0.40 2 42.12 1.00 525 177.73 15.35 1 384.97 1.00 920 27.57 0.95 3 100.19 1.00 841 268.39 15.05 7 1305.75 1.00 919 29.41 0.93 3 96.69 0.98 2 594.13 52.42 9 2021.96 0.95 838 10.87 1.30 6 51.91 0.94 Bottom 10 performers 477 45.58 2.10 2 27.41 0.14 513 170.16 8.43 6 103.82 0.14 461 123.47 5.85 6 68.46 0.13 454 131.97 2.82 2 31.08 0.12 313 215.15 7.07 6 65.89 0.10 453 784.01 19.27 9 168.57 0.10 665 183.56 10.10 4 71.27 0.09 664 155.49 9.23 4 43.27 0.06 990 86.93 4.40 4 18.85 0.05 616 238.50 8.82 4 23.63 0.03
There are several interesting facets to these results. First, seven out of the top 10 performers have DEA scores of 1.0, indicating that those bus routes are performing the best compared to other routes in the sense of maximizing ridership given their labor, capital and fuel expenses. Second, several routes with relatively low ridership were determined to be efficient, such as Route 608 and Route 838. This is not surprising given their extremely low operating mileage and operation time. For example, Route 608 has only two trips daily, with one in the morning and one in the
12
afternoon, to connect multiple schools with nearby residential neighborhoods; Route 838 only operates every 30 minutes during peak hours to connect major employment centers (Provo Towne Center Mall and East Bay Technology Park) with commuter rail stations, addressing the first mile/last mile problem. As noted in the previous section, these two exemplify the bus routes that have limited resources but perform better than their peers. While these outliers are notable for their operational efficiency, it is equally important to note routes like 841 are doing
exceedingly well, with high ridership and operating mileage time far below the UTA average. Of course, there are also routes like 200 with high operation time and mileage, generating extremely high ridership.
Figure 4.2: Operational efficiency scores for bus routes operated by UTA
Among the bottom 10 performers shown in Table 4.1, several routes are associated with very low ridership, such as Routes 616 and 990. Route 616 is a shuttle bus connecting North Ogden communities with a commuter rail station and running every 60 minutes during peak hours. With 8.82 daily operation hours and 238.50 daily operating mileage, only a daily average of 23.63 passengers are taking this shuttle. Route 990 connects several ski resorts with Midvale and Cottonwood Height. Yet this route is rarely used during summer. There are also some routes serving more than 100 passengers daily, but still considered to be inefficient routes due to the ineffective use of resources. For instance, Route 453 is an inter-county route with a route distance of 65.32 miles, running every 30 minutes during peak hours. However, it shares the same route and similar schedule as Route 451 except for a detour at the SLC airport, which takes
13
25 minutes more to arrive at its destination terminal. Given the long route distance, a better scheduling coordination between Routes 451 and 453 is probably needed to improve the ridership and reduce the operating costs.
4.1.3
Access equity result
Given the identified LCDCUs and MCLP, it is possible to assess geographic service provision for disadvantaged populations by existing bus routes. Figure 4.3 shows the trade-off curve associated with the percentage demand served by each possible value of 𝑝𝑝 (number of bus routes that remain in the system). Again, varying 𝑝𝑝 is used to enable the performance evaluation of transit routes rather than set a true limit on the size of transit system. Clearly, as 𝑝𝑝 increases from 1 to 94, more LCDCUs and more disadvantaged populations have access to bus transit. For example, assuming only a single bus route will remain in the system, the MCLP suggests that Route 455 be selected. Route 455 uniquely serves 52,958 members of the disadvantaged population, which is 6.7% of the 790,661 members of the disadvantaged population presently having access to bus transit. As more routes are allowed to remain in the system, the trade-off curve provides evidence that access redundancies in the bus transit system exist. At 𝑝𝑝=87 in Figure 4.3, 100% of the disadvantaged population has access to bus transit. This is indicative of service redundancies in the current bus system, where seven routes are found to provide
redundant service coverage for the disadvantaged population. It is also interesting to note that it is possible to achieve a very high level of service coverage to the majority of the disadvantaged population presently served with substantially fewer bus routes. For example, we can see that 99.9% of the disadvantaged population currently served by the bus transit would still have access to bus service via 75 existing bus routes. Viewed from a different perspective, only 0.01% of the current disadvantaged population is uniquely served by the 19 additional bus routes. Rather than implying that these 19 routes should be eliminated, the MCLP results suggest that these 19 routes are not providing unique transit access for the disadvantaged population given the existence of other bus routes.
14
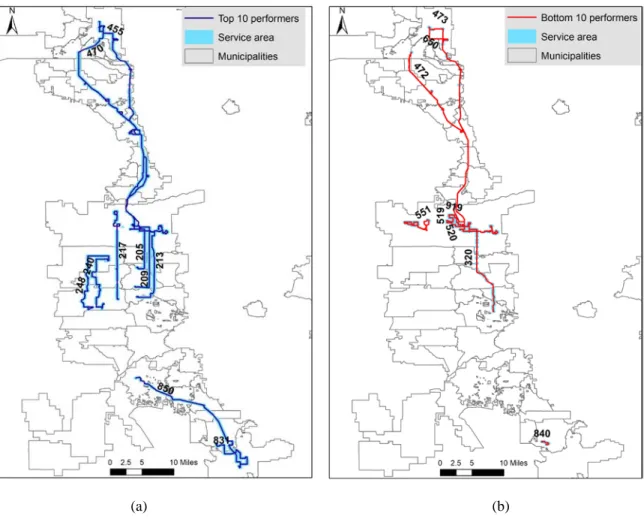
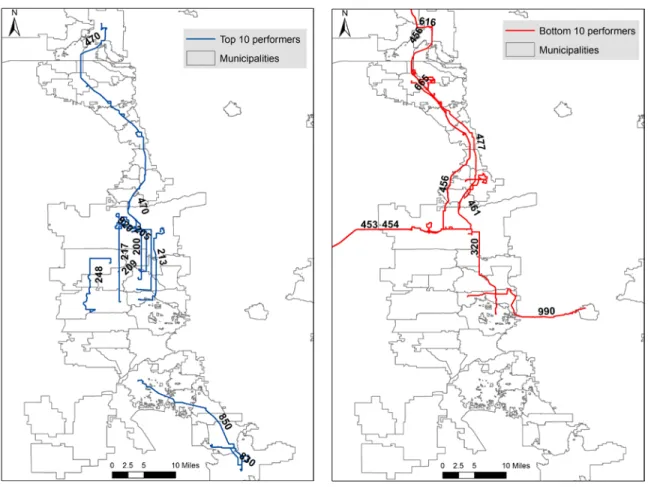
Figure 4.4 presents the top and bottom 10 performers in providing unique transit access for the disadvantaged population. The top 10 performers are identified by assuming that only 10 of existing bus routes will remain in the system (𝑝𝑝=10). With these 10 bus routes, 44% of the disadvantaged population presently served will still have access to bus transit. As these top performers try to serve as much of the disadvantaged population as possible, they have relatively long trip distance (ranging from 9.9 to 57.8 miles) and short stop spacing. Given the narrow north-south orientation of the Valley, all of the top 10 performers are north-south direction bus routes. It is also interesting to note that all the top performers are operating with a frequency of 15 or 30 minutes and have long span of service hours. The bottom 10 performers are identified by assuming that 10 existing bus routes will not remain in the system (𝑝𝑝=84). It turns out these 10 routes only provide unique service coverage for 19 (0.002%) members of the disadvantaged population. Among the 10 bottom performers, four of them are express or fast buses with long trip distance but quite limited number of stops, and six of them are routine buses with short trip distance (ranging from 1.9 to 11.2 miles), both indicating small service coverage. However, it is important to note that the small service coverage provided by those 10 bottom performers is still necessary to achieve a 100% service coverage in the entire region and could be imperative for some remote communities.
(a) (b)
Figure 4.4: Top and bottom 10 performers in access equity for UTA (a) Top 10 performers and their service area (b) Bottom 10 performers and their service area
15
4.1.4
Overall performance result
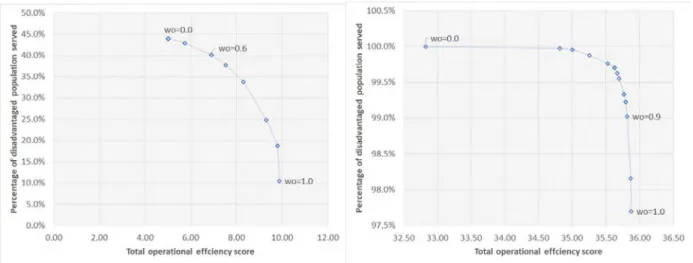
The bi-objective optimization model is employed to integrate both operational efficiency and access equity into the assessment of overall performance of bus routes. Similar to the MCLP, we can identify the top and bottom performers by varying 𝑝𝑝 from 1 to 94. However, there is a trade-off between operational efficiency and access equity at each 𝑝𝑝 when applying this bi-objective optimization model. This trade-off is that an increase in the operational efficiency is only possible by a reduction in the disadvantaged population served. Figure 4.5(a) illustrates the trade-offs derived by varying 𝑤𝑤𝑜𝑜 from 0 to 1 with a step of 0.05 when 10 existing bus routes will remain in the system (𝑝𝑝=10). As some identified trade-offs overlap with each other, eight unique trade-offs are shown in Figure 4.5(a). Clearly, when the emphasis is placed solely on maximizing the service coverage of the disadvantaged population (𝑤𝑤𝑜𝑜 =0), the top 10 performers identified are the same as those identified using the MCLP. While these 10 routes serve 44% of the
disadvantaged population, the total operational efficiency score is 5.01, which is equivalent to an average operational efficiency of 0.50 per route (5.01/10). Alternatively, when the emphasis is shifted solely to maximizing the total operational efficiency (𝑤𝑤𝑜𝑜=1), the top 10 performers identified are the same as those shown in Table 4.1 with an average operational efficiency of 0.99, but these 10 routes can only serve 10.5% of the disadvantaged population.
(a) (b)
Figure 4.5: Tradeoff curve for operational efficiency and access equity for UTA (a) 10 remaining routes (p = 10) (b) 10 cut routes (p = 84)
As suggested in Figure 4.5(a), there are also several other trade-off solutions between these two extreme scenarios. A more balanced trade-off is where both operational efficiency and access equity are given emphasis. For example, when 𝑤𝑤𝑜𝑜=0.6, the average operational efficiency of the identified 10 routes is 0.69 (27.5% increase compared to 𝑤𝑤𝑜𝑜=0) and 40.1% (3.9% decrease compared to 𝑤𝑤𝑜𝑜=1) of the disadvantaged population can be served. These 10 routes in Figure 4.6(a) could be considered as the top 10 performers when both operational efficiency and access equity are taken into account. Compared to Figure 4.4(a), three low-efficiency routes (Routes
16
240, 455, and 831) are replaced with highly efficient routes (Routes 200, 830, and 920), while maintaining a high level of service coverage. Compared with Table 4.1, only Route 200 stays in the top 10 performers, and the other nine routes are all replaced with routes that provide
significant access to the disadvantaged population. This is exactly how this bi-objective model balances those two competing goals.
Figure 4.6: Top and bottom 10 performers in overall performance for UTA (a) Top 10 performers (𝑝𝑝=10, 𝑤𝑤𝑜𝑜=0.6) (b) Bottom 10 performers (𝑝𝑝=84, 𝑤𝑤𝑜𝑜=0.9)
Figure 4.5(b) shows the trade-offs when 10 existing bus routes are assumed to be no longer in the system (𝑝𝑝=84) to explore the bottom 10 performers. Similarly, the two extreme trade-offs
correspond to the bottom 10 performers when only operational efficiency is considered (Table 1), and when only access equity is considered (Figure 4.4(b)), respectively. A more balanced trade-off can be easily identified in Figure 4.5(b). For example, when 𝑤𝑤𝑜𝑜=0.9, the average operational efficiency of the remaining 84 routes is 0.43 (9.1% increase compared to 𝑤𝑤𝑜𝑜=0) and 99.0% (0.99% decrease compared to 𝑤𝑤𝑜𝑜=1) of the disadvantaged population can be served. The rest of the 10 bus routes can be considered as the bottom 10 performers when both operational efficiency and access equity are taken into account. Compared to Figure 4.4(b), only Route 320 stays in the bottom 10 performers, and the other nine routes are all replaced with very low- efficiency routes. Compared with Table 4.1, two routes (Routes 513 and 313) that provide
17
unique access are replaced with routes (Routes 320 and 456) that provide minimal additional service coverage.
4.2
PORTLAND METROPOLITAN AREA
The DEA method is used to examine the operational efficiency of transit services operated by TriMet. The access equity of transit services is evaluated by the number of disadvantaged population members served. TriMet is the primary transit provider throughout the Portland metropolitan area and has a service area of 533 square miles. With an annual budget of $510.5 million, TriMet’s service area contains almost 1.5 million people.
4.2.1
Data
All of the transit route data, including average daily ridership, operation time per day, operating mileage per day, and number of operating vehicles per day, were obtained from TriMet and based on 2012 operations. The disadvantaged population data were summarized from the 2011-2016 American Community Survey estimates at the block group level.
4.2.2
Operational efficiency result
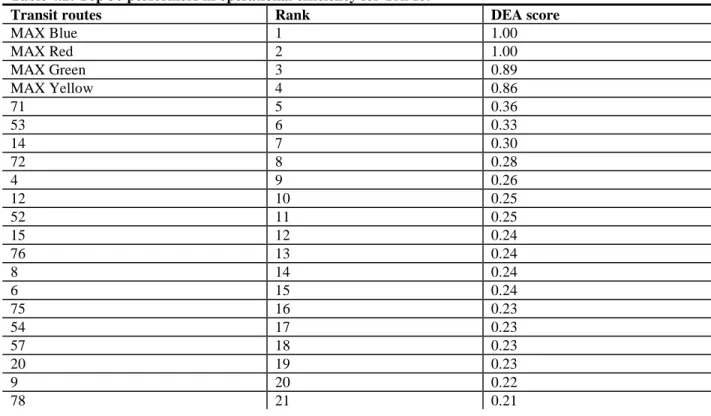
Table 4.2 displays the top 30 performers in terms of operational efficiency. Figure 4.7 provides a broader snapshot of DEA scores for all transit routes operated by TriMet. Unsurprisingly, the MAX rail lines all perform well. While several of the more popular bus lines also perform well, such as the 4, 12, and 14, a possibly surprising line is the 53-Arctic/Allen, which is a peak-hour weekday bus between Beaverton Transit Center and Allen Boulevard.
Table 4.2: Top 30 performers in operational efficiency for TriMet
Transit routes Rank DEA score
MAX Blue 1 1.00 MAX Red 2 1.00 MAX Green 3 0.89 MAX Yellow 4 0.86 71 5 0.36 53 6 0.33 14 7 0.30 72 8 0.28 4 9 0.26 12 10 0.25 52 11 0.25 15 12 0.24 76 13 0.24 8 14 0.24 6 15 0.24 75 16 0.23 54 17 0.23 57 18 0.23 20 19 0.23 9 20 0.22 78 21 0.21
18 56 22 0.21 17 23 0.20 62 24 0.20 63 25 0.19 77 26 0.19 19 27 0.18 61 28 0.18 33 29 0.18 70 30 0.17
Figure 4.7: Operational efficiency scores for transit routes operated by TriMet
4.2.3
Access equity result
The access equity of transit services is evaluated by the number of disadvantaged population members served. Table 4.3 displays the top 30 performers in terms of the number of population of color, and Table 4.4 displays the top 30 performers in terms of the number of population in poverty served. The Line 20 performs best in a pure equity sense, serving over 19,000 people (Table 4.3). Likewise, several “backbone” lines such as the 72 and 4 also perform well. More interesting are several less efficient lines which serve large populations of people of color, such as the 19, 77, and 44. The MAX Yellow Line, 190, performs very poorly. This may be explained by a number of factors, including displacement by gentrification of many communities of color
19
along its alignment, the fact that access is determined by the radius around stops, and perhaps the relatively short distance of the line. The number of served population is also standardized
following equation (3-10) and shown in column “Standardized served population”.
Table 4.3: Top 30 performers in the served number of population of color for TriMet
Transit routes Rank Served population Standardized served population 20 1 35,057 1 9 2 26,240 0.75 72 3 22,626 0.65 MAX Blue 4 22,606 0.64 19 5 20,387 0.58 77 6 18,590 0.53 44 7 17,671 0.5 4 8 17,633 0.5 71 9 15,042 0.43 75 10 14,907 0.43 10 11 14,293 0.41 57 12 13,588 0.39 6 13 11,925 0.34 54 14 11,376 0.32 25 15 11,102 0.32 56 16 10,970 0.31 MAX Red 17 10,830 0.31 8 18 10,621 0.3 62 19 10,402 0.3 14 20 10,276 0.29 76 21 9,213 0.26 35 22 9,119 0.26 MAX Green 23 9,113 0.26 52 24 8,893 0.25 78 25 8,433 0.24 15 26 8,362 0.24 12 27 8,193 0.23 17 28 7,812 0.22 53 29 5,485 0.16 MAX Yellow 30 3,279 0.09
As shown in Table 4.4, MAX generally performs worse in providing access with respect to people in poverty compared to other demographics. This may be due to the effects of rail on adjacent land values and subsequent gentrification around MAX stations. Lines such as the 36, 154, and 37 continue to perform poorly for this demographic, as these lines tend to serve more affluent areas such as Lake Oswego and Willamette Heights, which include more choice riders.
Table 4.4: Top 30 performers in the served number of population in poverty for TriMet
Transit routes Rank Served population Standardized served population
20 1 19,394 1
72 2 16,241 0.84
20 MAX Blue 4 12,156 0.63 19 5 11,928 0.62 77 6 10,927 0.56 75 7 10,887 0.56 44 8 10,750 0.55 4 9 10,105 0.52 10 10 8,722 0.45 25 11 8,215 0.42 57 12 8,193 0.42 71 13 8,169 0.42 6 14 7,912 0.41 8 15 7,599 0.39 47 16 7,538 0.39 62 17 7,343 0.38 52 18 6,493 0.33 54 19 6,345 0.33 MAX Red 20 5,952 0.31 56 21 5,894 0.3 35 22 5,272 0.27 MAX Green 23 5,060 0.26 17 24 4,996 0.26 14 25 4,954 0.26 15 26 4,234 0.22 12 27 4,226 0.22 76 28 4,112 0.21 53 29 2,689 0.14 MAX Yellow 30 1,581 0.08
4.2.4
Overall performance result
The operational efficiency and access equity are integrated by a weighting sum of the operational efficiency score and standardized disadvantaged population served to provide an assessment of overall performance of transit routes operated by TriMet. Figure 4.8 presents the overall performance of the transit routes when operational efficiency and number of served population of color are weighted equally. The MAX lines all perform very well, while lines such as the 71 have better performance, and Line 9 has worse performance when operational efficiency is taken into account.
Figure 4.9 presents the overall performance of the transit routes when operational efficiency and number of served population in poverty are weighted equally. While MAX generally performs worse in providing access with respect to people in poverty, it performs much better when efficiency is factored in. Lines such as the 36, 154, and 37 continue to perform poorly both in terms of population served and efficiency.
21
Figure 4.8: Overall performance for transit routes operated by TriMet (population of color)
22
5.0
DISCUSSION AND CONCLUSIONS
The application results demonstrate that our proposed method enables operational efficiency and access equity of transit services to be assessed in an integrated manner, as well as the effective identification of top performers that can best achieve these multi-dimensional objectives, and bottom performers that are candidates for service modification and consolidation.
There are several issues that are worth further discussion. First, the transit route performance evaluation based solely on operational efficiency or based solely on access equity is highly likely to be incomplete and result in sub-optimal decision-making in service planning of transit routes. For example, Route 650, connecting the Weber State University with the commuter rail station, is considered to be one of the bottom 10 performers in terms of providing unique access to the disadvantaged population due to its short trip distance and limited number of stops. However, it is a top performer with a DEA score of 1.0 in terms of operational efficiency because of its low resource inputs and high ridership. When both operational efficiency and access equity are integrated into the performance evaluation using the bi-objective optimization model, Route 650 is considered as an average performer instead of either a top or bottom performer, better
reflecting the overall performance of this transit service in the entire system.
Second, while the result section reports a single trade-off for top and bottom 10 performers in addition to the two extreme scenarios, there are many other trade-offs available. As an example, if the transit agency would like to place more emphasis on operational efficiency compared to access equity when identifying the top 10 performers, another trade-off with an average operational efficiency of 0.83 and a service coverage of 33.7% might be more desirable. Alternatively, if access equity is given higher priority than operational efficiency, the trade-off with an average operational efficiency of 0.57 and a service coverage of 42.8% could make more sense to the UTA. The proposed bi-objective optimization model offers the capability of
generating a range of trade-offs between operational efficiency and access equity. The final selection of the trade-off could vary given each transit agency’s varying priorities.
Finally, the access equity measure used in this study is limited to the physical access to transit stops of disadvantaged populations. While our results suggest that there is a significant positive relationship between the ridership and the number of disadvantaged population members served by bus route (Pearson’s , -value < 0.001), a more realistic measure should directly take into account the destinations of disadvantaged population members via transit. However, such data are not currently available at most transit agencies. Previous studies have used potential employment opportunities or some essential service locations as proxies for potential destinations of disadvantaged population members (e.g., Minocha et al. (2008) and Ferguson et al. (2012)), but such proxies might be significantly biased (Karner and Golub, 2015). As new technologies (smart sensors, etc.) are increasingly adopted to collect the origin-destination (OD) flow via transit, the accurate destination information might become available, with which the access equity measure could be extended to serving unique and necessary OD flows, but this remains for future research.
In addition, while this study takes into account the interdependency of service coverage by using the MCLP and LCDCU, it assumes the ridership of each bus route is independent of each other
23
and did not consider the transfers among multiple bus routes. Previous studies indicate that the majority of transit trips (over 90%) involve one or two transfers (Owen and Levinson, 2015). Therefore, the results may not be significantly affected by altering this assumption. However, future research can look into such ridership correlation leveraging transfer data (e.g., electronic fare collection) to examine its impact in model estimation.
This project develops a new method for evaluating the overall performance of public transit services via a combination of DEA, GIS, and multi-objective spatial optimization techniques. The method has also been operationalized by an open-source python toolbox so that it can be applied by other transit planners, decision-makers, and the public. The toolbox is applied to assessing the performance of fixed-route bus services operated by the UTA in Wasatch Front, Utah, and the performance of transit services operated by the TriMet in the Portland metropolitan area. The case studies demonstrate that our proposed method can account for operational
efficiency and access equity in an integrated framework, providing a more comprehensive assessment for transit service performance.
24
6.0
REFERENCES
Arman, M., Labi, S., & Sinha, K. C. (2013). Perspectives of the operational performance of public transportation agencies with data envelopment analysis technique. Transportation Research Record: Journal of the Transportation Research Board, 2351(1), 30-37. Banker, R. D., Charnes, A., & Cooper, W. W. (1984). Some models for estimating technical and
scale inefficiencies in data envelopment analysis. Management Science, 30(9), 1078-1092. Banxia. (2017). Frontier Analyst Software from https://banxia.com/
Benjamin, J., & Obeng, K. (1990). The effect of policy and background variables on total factor productivity for public transit. Transportation Research Part B: Methodological, 24(1), 1-14.
Bertini, R., & El-Geneidy, A. (2003). Generating transit performance measures with archived data. Transportation Research Record: Journal of the Transportation Research Board(1841), 109-119.
Biba, S., Curtin, K. M., & Manca, G. (2010). A new method for determining the population with walking access to transit. International Journal of Geographical Information Science, 24(3), 347-364.
Charnes, A., Cooper, W. W., & Rhodes, E. (1978). Measuring the efficiency of decision making units. European Journal of Operational Research, 2(6), 429-444.
Chu, X., Fielding, G. J., & Lamar, B. W. (1992). Measuring transit performance using data envelopment analysis. Transportation Research Part A: Policy and Practice, 26(3), 223-230.
Church, R., & ReVelle, C. (1974). The maximal covering location problem.Papers of the Regional Science Association, 32(1), 101-118.
Cohon, J. L. (1978). Multiobjective programming and planning. New York: Academic Press. Cromley, R. G., Lin, J., & Merwin, D. A. (2012). Evaluating representation and scale error in the
maximal covering location problem using GIS and intelligent areal interpolation.
International Journal of Geographical Information Science, 26(3), 495-517.
Currie, G. (2004). Gap analysis of public transport needs: measuring spatial distribution of public transport needs and identifying gaps in the quality of public transport provision.
Transportation Research Record: Journal of the Transportation Research Board, 1895, 137-146.
Delbosc, A., & Currie, G. (2011). Using Lorenz curves to assess public transport equity. Journal of Transport Geography, 19(6), 1252-1259.
Delmelle, E. C., & Casas, I. (2012). Evaluating the spatial equity of bus rapid transit-based accessibility patterns in a developing country: The case of Cali, Colombia. Transport Policy, 20, 36-46.
Delmelle, E. M., Li, S., & Murray, A. T. (2012). Identifying bus stop redundancy: A gis-based spatial optimization approach. Computers, Environment and Urban Systems, 36(5), 445-455.
25
El-Geneidy, A., Grimsrud, M., Wasfi, R., Tétreault, P., & Surprenant-Legault, J. (2014). New evidence on walking distances to transit stops: identifying redundancies and gaps using variable service areas. Transportation, 41(1), 193-210.
Fayyaz, S. K., Liu, X. C., & Porter, R. J. (2017). Dynamic transit accessibility and transit gap causality analysis. Journal of Transport Geography, 59, 27-39.
Fielding, G. J., Babitsky, T. T., & Brenner, M. E. (1985). Performance evaluation for bus transit.
Transportation Research Part A: General, 19(1), 73-82.
Fielding, G. J., Glauthier, R. E., & Lave, C. A. (1978). Performance indicators for transit management. Transportation, 7(4), 365-379.
Foth, N., K. Manaugh & A. M. El-Geneidy (2013) Towards equitable transit: examining transit accessibility and social need in Toronto, Canada, 1996–2006. Journal of Transport Geography, 29, 1-10.
FTA (Federal Transit Administration) (2012). Circular 4702.1B: Title VI Requirements and Guidelines for Federal Transit Administration Recipients. US Department of
Transportation, Washington, DC.
Ferguson, E. M., Duthie, J., Unnikrishnan, A., & Waller, S. T. (2012). Incorporating equity into the transit frequency-setting problem. Transportation Research Part A: Policy and Practice, 46(1), 190-199.
Garrett, M., & Taylor, B. (1999). Reconsidering social equity in public transit. Berkeley Planning Journal, 13(1).
Gary, M. R., & Johnson, D. S. (1979). Computers and Intractability: A Guide to the Theory of NP-completeness. New York: WH Freeman and Company.
Grubesic, T. H., & Wei, F. (2012). Evaluating the efficiency of the Essential Air Service program in the United States. Transportation Research Part A: Policy and Practice, 46(10), 1562-1573.
Hassan, M. N., Hawas, Y. E., & Ahmed, K. (2013). A multi-dimensional framework for
evaluating the transit service performance. Transportation Research Part A: Policy and Practice, 50, 47-61.
Hawas, Y. E., Khan, M., & Basu, N. (2012). Evaluating and enhancing the operational
performance of public bus systems using GIS-based data envelopment analysis. Journal of Public Transportation, 15(2), 2.
Horner, M. W., & Murray, A. T. (2004). Spatial representation and scale impacts in transit service assessment. Environment and Planning B: Planning and Design, 31(5), 785-797. Johnson, V., G. Currie & J. Stanley (2010) Measures of disadvantage: is car ownership a good
indicator? Social Indicators Research, 97, 439-450.
Kaplan, S., Popoks, D., Prato, C. G., & Ceder, A. (2014). Using connectivity for measuring equity in transit provision. Journal of Transport Geography, 37, 82-92.
Karlaftis, M. G. (2004). A DEA approach for evaluating the efficiency and effectiveness of urban transit systems. European Journal of Operational Research, 152(2), 354-364. Karner, A. & Golub, A. (2015). Comparison of Two Common Approaches to Public Transit
Service Equity Evaluation. Transportation Research Record: Journal of the Transportation Research Board, 2531, 20.
Lao, Y., & Liu, L. (2009). Performance evaluation of bus lines with data envelopment analysis and geographic information systems. Computers, Environment and Urban Systems, 33(4), 247-255.
26
Mamun, A., & Lownes, N. (2011). A Composite Index of Public Transit Accessibility. Journal of Public Transportation, 14(2).
Martens, K., Golub, A., & Robinson, G. (2012). A justice-theoretic approach to the distribution of transportation benefits: Implications for transportation planning practice in the United States. Transportation Research Part A: Policy and Practice, 46(4), 684-695.
Minocha, I., Sriraj, P., Metaxatos, P., & Thakuriah, P. (2008). Analysis of transit quality of service and employment accessibility for the Greater Chicago, Illinois, Region.
Transportation Research Record: Journal of the Transportation Research Board, (2042), 20-29.
Murray, A. T. (2003). A coverage model for improving public transit system accessibility and expanding access. Annals of Operations Research, 123(1-4), 143-156.
Murray, A. T., & Davis, R. (2001). Equity in regional service provision. Journal of Regional Science, 41(4), 557-600.
Murray, A. T., Davis, R., Stimson, R. J., & Ferreira, L. (1998). Public transportation access.
Transportation Research Part D: Transport and Environment, 3(5), 319-328.
Owen, A., & Levinson, D. M. (2015). Modeling the commute mode share of transit using
continuous accessibility to jobs. Transportation Research Part A: Policy and Practice, 74, 110-122.
Sanchez, T. W. (1999). The connection between public transit and employment: the cases of Portland and Atlanta. Journal of the American Planning Association, 65(3), 284-296. Tomazinis, A. R. (1977). Study of efficiency indicators of urban public transportation systems.
Final report: Pennsylvania Univ., Philadelphia (USA). Transportation Studies Center. Tong, D., & Wei, R. (2016). Regional Coverage Maximization: Alternative Geographical Space
Abstraction and Modeling. Geographical Analysis, DOI:10.1111/gean.12121. Wei, R. (2016). Coverage Location Models Alternatives, Approximation, and Uncertainty.
International Regional Science Review, 39(1), 48-76.
Wei, R., & Murray, A. T. (2014). Evaluating polygon overlay to support spatial optimization coverage modeling. Geographical Analysis, 46(3), 209-229.
Taylor, B. D. and E. A. Morris (2015). Public transportation objectives and rider demographics: are transit’s priorities poor public policy? Transportation 42(2), 347-367
Wu, B. M., & Hine, J. P. (2003). A PTAL approach to measuring changes in bus service accessibility. Transport Policy, 10(4), 307-320.
Wu, C., & Murray, A. T. (2005). Optimizing public transit quality and system access: the multiple-route, maximal covering/shortest-path problem. Environment and Planning B: Planning and Design, 32(2), 163-178.
1
APPENDIX A
MANUEL OF THE OPEN-SOURCE TOOLBOX FOR TRANSIT
SERVICE PERFORMANCE EVALUATION
Contact: Dr. Ran Wei
School of Public Policy
University of California, Riverside Tel: (951)827-1258
Email: [email protected] Prepared by
Yongjian Mu Pure Storage Inc.
2
1.
INTRODUCTION
Transit Service Performance Analysis program is used to evaluate and optimize the performance of bus lines. The evaluation is based on equality and DEA. The optimization is based on linear programming by using glpk package.
The source files can be found at:
https://github.com/rwei5/Transit-Performance
Any input sample file can be found in
https://github.com/rwei5/Transit-Performance/tree/master/input
2.
PREREQUISITE
1) A windows PC, with a screen which horizontal resolution should be no less than 1440. 2) launchBusAnalysis.exe
3) glpk package which contains glpsol.exe.
3.
HOW TO USE THE SOFTWARE
3.1.
LAUNCH MAIN WINDOW
The program can be simply launch by double clicking launchBusAnalysis.exe. After that, you can see a window as follows.
Figure 1. Main window
3.2.
CALCULATE EQUALITY
There are two methods to calculate the equality, Overlap and Centroid. Both of the two methods need to fill item 1 to 10. In the overlap method, the service coverage area of bus routes is
calculated by buffering its corresponding stops within a 400-meter walking distance, then the service area is overlaid with the block group file to calculate the disadvantaged population at each overlaid piece. The bus route is considered to serve the overlaid piece if it is within the
3
service area. In the centroid method, the service coverage area of bus routes is calculated by measuring the distance from the block group centroid to the nearest transit stops of the routes. If the distance is less than or equal to 400 meters, then this block group is considered to be served by this bus route.
3.2.1.
CHOOSE BUS STOP INPUT SHAPE FILE
First, click the “1. Browser” button and choose the bus stop input shape file (e.g.,
BusStops_UTA.shp). Then click the “2. Setting” button to choose the field in the shape file which can represent the stop id as shown in the figure below.
Figure 2. Select stop id
Finally, click “Set” -> “Done”.
3.2.2.
CHOOSE BLOCK INPUT SHAPE FILE
First, click the “3. Browser” button and choose the block input shape file (e.g.,
UT_blck_grp_2010.shp). Then click the “4. Setting” button to choose the field in the shape file which can represent the population id as shown in the figure below. The example chooses the “Age” as the population field, but others such as “Race” and “Poverty” are also acceptable.
Figure 3. Select population id
4
3.2.3.
CHOOSE BUS ROUTES INPUT SHAPE FILE
First, click the “5. Browser” button and choose the bus routes input shape file (e.g.,
BusRoutes_UTA.shp). Then click the “6. Setting” button to choose the field in the shape file which can represent the bus line id as shown in the figure below.
Figure 4. Select bus line id
Finally, click “Set” -> “Done”.
3.2.4.
CHOOSE GTFS FILES
Click buttons “7. Browser”, “8. Browser” and “9. Browser” to choose GTFS routes.txt, stop times.txt and trips.txt.
3.2.5.
CHOOSE OUTPUT FOLDER
Click button “10. Browser” to choose the output folder. The result files of calculating equality (cal_equality.json and equality_csv.csv) will be generated in the output folder.
3.2.6.
CALCULATE THE RESULTS
There are two methods to generate the results. If you want to use Overlap method, just click the “Calculate Overlap” button. If you want to use Centroid method, just click the “Calculate Centroid” button. After clicking the button, a window will appear to indicate that it may take a long time to calculate, especially for Overlap method. Therefore, do NOT click any button until the window shows finished.
3.3.
CALCULATE OPERATIONAL EFFICIENCY
3.3.1.
CHOOSE OUTPUT FOLDER
See 3.2.5.
3.3.2.
CHOOSE DEA INPUT EXCEL FILE
First, click the “11. Browser” button and choose the bus routes input shape file, e.g.
DEA_input_dataset.xlsx. Then click the “12. Setting” button to choose the field in the shape file which can represent the bus line id, input fields and output fields as shown in the figures below.
5
Figure 5. Select bus line id
2) Select input fields, the click “Set” below.
Figure 6. Select input fields
3) Select output fields, the click “Set” below.
Figure 7. Select output fields
4) Click “Done” button.
3.3.3.
CALCULATE THE RESULTS
Click “Calculate Operational Efficiency” button to generate the results. The result files of DEA (cal_dea.json and cal_dea.csv) will be generated in output folder.
3.4.
OPTIMIZATION
3.4.1.
CHOOSE INPUT SHAPE FILES
6
3.4.2.
CHOOSE OUTPUT FOLDER
See 3.2.5.