DOI 10.1007/s00193-009-0231-9 O R I G I NA L A RT I C L E
Effects of micro-ramps on a shock wave/turbulent
boundary layer interaction
Paul L. Blinde· Ray A. Humble · Bas W. van Oudheusden · Fulvio Scarano
Received: 18 December 2008 / Revised: 10 June 2009 / Accepted: 10 September 2009 / Published online: 24 September 2009 © The Author(s) 2009. This article is published with open access at Springerlink.com
Abstract Stereoscopic particle image velocimetry is used to investigate the effects of micro-ramp sub-boundary layer vortex generators, on an incident shock wave/boundary layer interaction at Mach 1.84. Single- and double-row arrange-ments of micro-ramps are considered. The micro-ramps have a height of 20% of the unperturbed boundary layer thickness and the measurement planes are located 0.1 and 0.6 boundary layer thicknesses from the wall. The micro-ramps generate packets of individual vortex pairs downstream of their ver-tices, which produce counter-rotating longitudinal stream-wise vortex pairs in a time-averaged view. These structures induce a pronounced spanwise variation of the flow proper-ties, namely the mixing across the boundary layer interface. The probability of reversed-flow occurrence is decreased by 20 and 30% for the single- and double-row configurations, respectively. Both configurations of micro-ramps stabilize the shock motion by reducing the length of its motion by about 20% in the lower measurement plane. The results are summarized by a conceptual model describing the boundary layer’s and interaction’s flow pattern under the effect of the micro-ramps.
Keywords Shock wave boundary layer interaction·Flow control·Microramps·PIV
PACS 47.27·47.40·47.85.ld
Communicated by J.-P. Dussauge.
P. L. Blinde·R. A. Humble·B. W. van Oudheusden (
B
)·F. Scarano Delft University of Technology, 2629 HS Delft, The Netherlands e-mail: b.w.vanoudheusden@tudelft.nlURL: www.tudelft.nl
1 Introduction
Shock wave/turbulent boundary layer interactions (SWT-BLIs) are a class of fluid dynamic phenomena that are prevalent in many applications, e.g., supersonic inlets, missile and aircraft after bodies, etc. (see [1]). Such interactions are an important source of drag and can cause unsteady separation of the boundary layer, leading to increased aerody-namic drag, heat-fluxes and fluctuating pressure loads, which can be severe enough to cause premature structural fatigue of aero-structures [1,2].
The dynamical behavior of the interaction is known to exhibit a wide range of spatio-temporal scales, including a large-scale low-frequency motion of the reflected shock wave system and separated flow region that is typical orders of magnitude lower than the incoming boundary frequency
U∞/δ, where U∞ is the free-stream velocity and δ is the boundary layer thickness (see, e.g., [3,4]). To date, much attention has focused on documenting the characteristics of this low-frequency unsteadiness and identifying its causes (see e.g., [1,2,6]). Recent experiments performed by Souverein et al. [34] allowed to determine the spatial distribu-tion of the velocity time-correladistribu-tion funcdistribu-tion over the entire interaction region. The boundary layer and the reflected shock foot time-scales are reported to be separated by a factor 20. Moreover, the shear layer downstream of the interac-tion region exhibited fluctuainterac-tions with time scales larger than those of the incoming boundary layer.
Several studies have forwarded a model based on experimental observations in which the low-frequency com-ponent of the unsteadiness is driven by large-scale variations in the streamwise velocity of the incoming boundary layer (see, e.g., [5,7]). In particular, studies making use of veloc-ity measurements in wall-parallel planes have shown that the fluctuations in the streamwise velocity component of the
incoming boundary layer appear to dominate the downstream position of the reflected shock foot [7,8]. These studies were made possible by advances in particle image velocimetry (PIV), which enable to visualize the spatial coherence of velocity fluctuations along the streamwise and spanwise dir-ections simultaneously. More recently the use of tomographic PIV enabled to visualize the velocity pattern within an entire volume [8].
The control of SWTBLIs is a topic that has been contin-ually addressed in recent decades, and a variety of strate-gies have been explored in order to diminish the detrimental effects of the shock-induced separation [6]. Attempts to alter the characteristics of the incoming boundary layer, such as the fullness of the velocity profile, have been widely investi-gated in particular. One way to accomplish this is by placing vortex generators (VGs) at an appropriate distance upstream of the SWTBLI. Conventional VGs with a height in the order of the boundary layer thickness have been used for some time to provide control in supersonic applications [9]. Recently, however, attention has been focused on sub-boundary layer VGs (SBVGs), which have a height of about 10–40% of the undisturbed boundary-layer thickness. This type of VG is attractive because they typically cause less drag than con-ventional VGs (see [10]).
The micro-ramp is one particular type of SBVGs, which has been shown to reduce the length of the separated region, causing a more abrupt pressure rise (see, e.g., [11–13]), as well as a stabilization of the interaction region [14]. Although experimental studies (see [15,16]) suggest that vane-type SBVGs may be more effective in suppressing separation, micro-ramps offer the advantage of being more rugged, there-fore less subject to mechanical failure, which is essential for engine intake applications. Within this context, the present paper reports on an exploratory study conducted to investi-gate the effects of SBVGs on an incident SWTBLI using PIV.
2 Experimental arrangements
Experiments were performed in the transonic-supersonic wind-tunnel (TST-27) of the High-Speed Aerodynamics Laboratories at Delft University of Technology. The facility generates flows in the Mach number range 0.5–4.2, in a test section of dimensions 280 mm (width)×270 mm (height). The maximum unit Reynolds number varies from 30× 106m−1in the transonic range to 130×106m−1at Mach 4. Hot-wire anemometry measurements performed in the test section found a turbulence intensity of approximately 1%U∞ (see [8]). In the present experiments, the wind-tunnel was operated at a free-stream Mach number M∞ =1.84 (mea-sured free-stream velocity U∞ =483 m s−1), a total pres-sure P0 =2.5×10⁵N m−2, and a total temperature T0 =
278 K. The boundary layer developing on the side-wall of the
Table 1 Experimental conditions and upstream boundary layer prop-erties Parameter Quantity M∞ 1.84 U∞(m s−1) 483 P0(N m−2) 2.52×10⁵ T0(K) 278 δ99(mm) 19 δ∗(mm) 3.8 θ(mm) 1.4 uτ (m s−1) 17.7 cf 1.6×10⁻³ Re m−1 36.6×10⁶ Reθ 5.12×10⁴ Reθ,w 3.58×10⁴
wind-tunnel was used as the test boundary layer. Its properties are taken from Tuinstra [17], who performed a high resolution planar PIV investigation of a boundary layer on the top wall of the same facility at M∞=1.86, which has similar proper-ties. After having developed on a smooth surface under nearly adiabatic flow conditions for a development length of approximately 2 m, the boundary layer had a thicknessδ99 =
19 mm. The compressible displacement thickness, δ∗ = 3.8 mm, and the compressible momentum thickness,
θ = 1.4 mm. Using the van Driest transformation in com-bination with the Crocco–Busemann relation with a recov-ery factor r =0.89, a skin friction coefficient, cf =1.6× 10⁻³was determined [17], corresponding to a friction veloc-ity, uτ = 18 m s−1. The Reynolds number based on the compressible momentum thickness, Reθ =ρ∞U∞θ/µ∞=
5.1×10⁴, whereµ∞is the viscosity in the free-stream flow. The momentum thickness-based Reynolds number related to wall viscosity, Reθ,w =ρ∞U∞θ/µw =3.6×10⁴. Exper-imental conditions and undisturbed boundary layer parame-ters are summarized in Table1.
A 70-mm chord single-sided shock generator with flow deflection angle 10◦ was placed in the free-stream flow to generate the incident shock wave. The shock generator was sting-mounted and spanned approximately two thirds of the test section. For the distance from the wall chosen, the length of the shock generator was sufficient such that the expansion fan at its shoulder did not influence the interaction within the observed measurement domain. Micro-ramps were used in the experiments to perturb the upstream undisturbed bound-ary layer. These SBVGs consisted of small aluminum trian-gular ramps of dimensions and spanwise arrangement scaled to their height according to recommendations by Anderson et al. [14] with the objective to minimize the boundary layer shape factor downstream. Their maximum height h was cho-sen to be h =4 mm (h/δ=0.2) and such that the effect of
Fig. 1 Geometry of the micro-ramps. a Dimensions of a micro-ramp, b single-row configuration, c double-row configuration FOV (3.6δ) Flow direction s =1.6δ x = -10δ FOV (3.6δ) Flow direction s =1.6δ x = -10δ (a) (b) (c)
multiple micro-ramps could be seen within the field-of-view. The resulting size and shape of the micro-ramps is shown in Fig.1a. Two configurations of micro-ramps were considered in the present study, namely (1) a single-row of five micro-ramps (see Fig.1b) and (2) a double-row configuration (see Fig.1c).
The ramps were placed 20 cm (10δ) upstream of the origin (x=0), which is defined in the present study as the stream-wise location where the incident shock would impinge on the wall in absence of the boundary layer. The coordinate
y is taken to be normal to the wall. The distance between
the ramps and the interaction was chosen based on a range of effectiveness reported by Pitt Ford and Babinsky [13] for sim-ilarly shaped micro-ramps with heights ranging from h/δ= 0.25−0.75, for a free-stream Mach number of 2.5, and Reθ =
2.46×10⁴. The micro-ramps are therefore considered to be located approximately in the middle of this range of effec-tiveness, whether it is scaled by the boundary layer thickness, the displacement thickness, or momentum thickness.
Stereo-PIV was used to obtain velocity fields at two planes; namely, y/δ =0.1 and 0.6. Titanium dioxide (TiO2)
parti-cles of the type Dupont R-931 with nominal diameter of 0.55µm were used as tracer particles. The nominal density of the seeding, as reported by the manufacturer, is 3.6× 10³ kg m−3. Schrijer and Scarano[18] have assessed the temporal response of different types of TiO2particles, and
for the present seeding have inferred a particle response time,τp = 3.5µs, corresponding to a frequency response
fp=286 kHz. Based on an outer time scale ofδ/U∞, then
τf = 42µs. This gives a Stokes number(τp/τf)of 0.08, indicating that the errors associated to the particle tracer response is below 1% (see [35]).
The seeded flow was illuminated by a Spectra-Physics Quanta Ray PIV-400 double-cavity Nd:Yag laser with a wavelength of 532 nm at 10 Hz. Each pulse has a maxi-mum energy of 400 mJ and a duration of 6 ns. Laser light access into the tunnel was provided by a laser probe inserted downstream of the test section. The laser beam was shaped into a sheet using light optics within the probe. The light sheet thickness was approximately 1 mm.
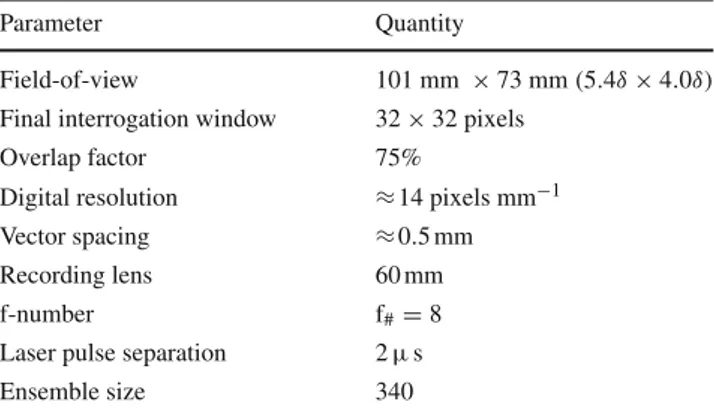
Images were recorded by two PCO Sensicam QE CCD cameras (1376×1040 pixels, 12 bits). Nikon objectives of 60 mm focal length were used with f -number set at 8, in combination with daylight filters in order to minimize back-ground ambient light. The two cameras were placed in ste-reoscopic configuration to enable the measurement of the three velocity components in the light sheet plane. The angle between cameras was approximately 35◦and the recording distance was approximately 70 cm. The field-of-view was 101×73 mm (5.6δ×3.8δ) resulting in a digital resolution of approximately 14 pixels mm−1. The field-of-view was positioned such that the upstream boundary layer, the inter-action, and part of the recovering boundary layer are visible at both heights from the wall y/δ =0.1 and y/δ=0.6.
Both the cameras and the laser were connected to a com-puter with a LaVision programmable timing unit (PTU) to provide for the digital synchronization. DaVis 7.1 software was used to control the PTU. The image acquisition system was set to record at a frequency of 5 Hz with a time sep-aration between two subsequent exposures of 2µs, which resulted in a maximum particle displacement of about 12 pixels (1 mm). The instantaneous velocity measurements are therefore uncorrelated in time. The PIV recording parameters are summarized in Table2.
Table 2 PIV recording parameters
Parameter Quantity
Field-of-view 101 mm ×73 mm(5.4δ×4.0δ) Final interrogation window 32×32 pixels
Overlap factor 75%
Digital resolution ≈14 pixels mm−1 Vector spacing ≈0.5 mm
Recording lens 60 mm
f-number f#=8
Laser pulse separation 2µs
Ensemble size 340
Particle image velocimetry recordings were processed with DaVis 7.4 software. Velocity vector fields were obtained by cross-correlation of the images based on a fast Fourier transform-based algorithm using a multi-grid approach with window deformation. A final window size of 32×32 pix-els is chosen with a 75% overlap, leading to one vector per 8×8 pixels (0.6 mm ×0.6 mm). Spurious vectors were removed using the universal median test [36] and replaced by interpolation. The average signal-to-noise, defined as the ratio between the first and second correlation peak, typically had a value in the range 1.5–2.0 throughout the measurement domain. The final dataset consists of 340 instantaneous vec-tor fields for each configuration. Vecvec-tors were corrected for a laser sheet angle of 1◦with respect to the wall. This angle was visually inferred from photos of the laser sheet.
3 Results and discussion
3.1 Assessment of undisturbed boundary layer
In order to first substantiate the validity of the PIV mea-surement data, Fig.2 shows the root-mean-square (RMS) velocity components within the undisturbed boundary layer together with tomographic PIV results of Humble et al. [8], planar PIV results of Humble et al. [19] and Hou [20] and hot-wire anemometry (HWA) and laser Doppler anemome-try results of Elena and Lacharme [19]. The original figure is taken from Humble et al. [8]. In order to make compari-sons with the incompressible data of Klebanoff [22], all data were normalized by the friction velocity uτ and premulti-plied (ρ/ρw)0.5, whereρdenotes the local mean density and
ρw is the density at the wall. The density ratioρ/ρw was obtained via the adiabatic Crocco–Busemann relation with the assumption of a constant recovery factor r =0.89 and a zero (mean) static pressure gradient in wall-normal direc-tion. It can be seen that there is good agreement between the present results and those from literature. Note that the turbulence intensity in spanwise direction is close to that in
Fig. 2 Streamwise, spanwise and wall-normal RMS velocity compo-nents using Morkovin’s scaling; present results in streamwise and wall-normal direction are compared with experimental data of Humble et al. [8,19], Hou [20], Elena and Lacharme [21] and Klebanoff [22]. Original figure from Humble et al. [8]
the wall-normal direction; an expected result in moderately supersonic boundary layers (see [23]).
3.2 Mean flow organization
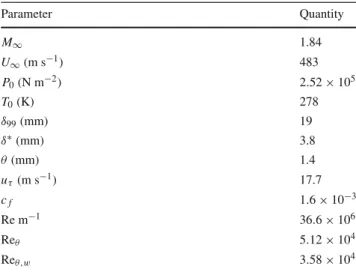
To introduce the basic features of the interaction under inves-tigation, contour plots of the scaled mean streamwise, span-wise and wall-normal velocity components at y/δ=0.1 and
y/δ=0.6 are presented from top to bottom in Figs.3and4, respectively. In both these figures (and those which follow), the left column corresponds to the undisturbed interaction, the middle column to the interaction perturbed by a single row of micro-ramps, and the right column to the interaction perturbed by a staggered array of micro-ramps. To aid inter-pretation, small black triangles have been added to indicate the spanwise position of the micro-ramps, but note that the symbols are not representative of the actual size and stream-wise position of the micro-ramps. In the plots of the mean streamwise velocity, mean velocity streamlines and the sonic line are also shown for illustration. The latter was obtained by using the adiabatic Crocco–Busemann relation, as men-tioned above. From these results, the following statements can be made regarding the two-dimensionality of the unper-turbed flow: firstly, from the streamwise and wall-normal mean velocity components it appears that the unperturbed flow is two-dimensional for distances less than≈0.8δfrom the centre-line of the field-of-view. Secondly, the streamlines can be seen to diverge in spanwise direction downstream of the shock, which is attributed to the limited span of the shock generator. It is further observed, that the flow divergence is more pronounced close to the wall (Fig.3, at y/δ = 0.1) than farther away (Fig.4, at y/δ =0.6), where it is hardly visible over the domain of measurement.
Fig. 3 Mean velocity fields at y/δ = 0.1; u/U∞(upper), w/U∞ (middle) andv/U∞(lower); undisturbed interaction (left), disturbed by a single row of micro-ramps (middle), disturbed by staggered array of micro-ramps (right); in the top figures, streamlines and the sonic line
are shown. The sonic line is indicated by a solid black line. The small black triangles indicate the spanwise position of the micro-ramps (size and streamwise arrangement not to scale)
Figure3a, g show that at y/δ =0.1, the flow is deceler-ated and deflected away from the wall at about 2.5δupstream of the line where the shock would impinge on the wall in absence of a boundary layer. The streamwise velocity reaches minimum values at approximately x/δ= −1, after which it gradually increases again. However, it may be observed that the boundary layer does not recover to its initial state within the field of view. Farther away from the wall, at y/δ=0.6, (see left column of Fig.4) the start of the deceleration region is located about 0.5δmore downstream than at y/δ =0.1, because of the inclination of the reflected shock, and both deceleration and subsequent acceleration occur more rap-idly.
Introduction of the micro-ramps upstream of the interac-tion distorts the predominant two-dimensionality of the mean flow organization. A velocity deficit is present downstream of the vertices of each ramp, consistent with results found at free-stream Mach numbers ranging from 1.5 to 5 by Barter and Dolling [12] and Holden and Babinsky [16]. Conversely, Pitt Ford and Babinsky [13] reported that close to the wall at
y/δ=0.1, the mean velocity is highest downstream of a ver-tex; a discrepancy that is tentatively linked to differences in vortex migration due to different characteristics of the
bound-ary layer (see [9]). Comparing Fig.4b and c, it can be seen that the effect of the staggered array of micro-ramps on the flow at y/δ =0.1 is larger than that of the single-row con-figuration. Additionally, in case of the staggered array, it is observed from Figs.3c and4c that the most downstream row of micro-ramps in the staggered set is dominant at y/δ =0.6, while at y/δ = 0.1 the effect of the most upstream row is greatest.
The spanwise variations in mean streamwise velocity persist throughout the interaction region: downstream of ver-tex locations where the mean velocity in the incoming bound-ary layer is lowest, the minimum mean velocity that is attained in the interaction is lowest, the mean recovery of the flow downstream the interaction slower and vice versa. The mean spanwise velocity fields, in particular Figs.3f and4e, show that the flow in the interaction region is deflected away from the spanwise locations of the micro-ramp vertices. Farther downstream where the subsonic region becomes smaller, the spanwise movement of the flow exhibits a greater spanwise variation in comparison to the unperturbed interaction and tends to move towards the spanwise locations of vertices.
Also regarding the mean wall-normal velocity, the micro-ramps qualitatively have the same effect on the incoming
Fig. 4 Mean velocity fields at y/δ = 0.6; u/U∞(upper), w/U∞ (middle) andv/U∞(lower); undisturbed interaction (left), disturbed by a single row of micro-ramps (middle), disturbed by staggered array
of micro-ramps (right); in the top figures, streamlines and the sonic line are shown. The sonic line is indicated by a solid black line
boundary layer and on the interaction region as can be seen from the lower rows of Figs.3 and 4. Downstream of the interaction the effect of micro-ramps on the wall-normal mean velocity can no longer clearly be seen as the flow appears to move towards the wall relatively uniformly.
It should be noted that all velocity fields in the incoming boundary layer are consistent with the existence of longitu-dinal streamwise vortices in the mean flow as is suggested by both the experimental studies of Holden and Babinsky [16] and Pitt Ford and Babinsky [13], as well as the computational studies of Mounts and Barber [24], Anderson et al. [14], and Lee et al. [25].
3.3 Instantaneous flow organization
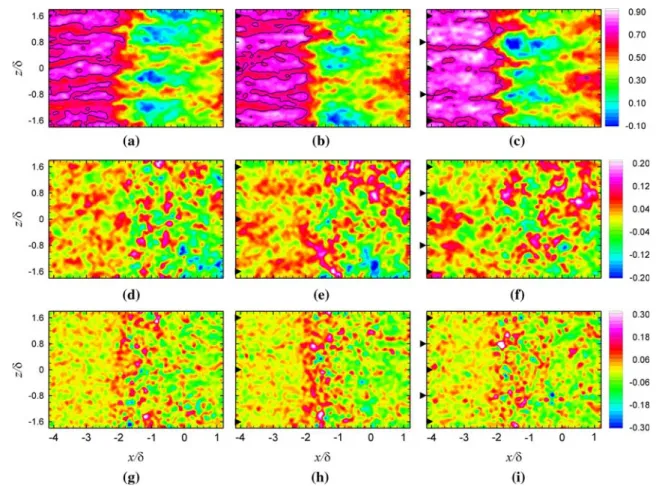
Contour plots of the scaled instantaneous velocities at
y/δ = 0.1 and y/δ = 0.6 are presented in Figs.5 and6, for an arbitrary data sample. These figures are arranged in the same way as the mean velocity fields in Figs.3and4, respectively. The velocity fields in each column correspond to a single snapshot that is representative for those found in the data set. Unlike the mean flow organization, the
instanta-neous results reveal that the streamwise velocity is not uni-form, but it is distributed as streamwise streaks of low- and high-speed velocity. These streaks appear to be randomly dis-tributed in space as they have different positions each snap-shot and disappear on the mean. A similar organization of supersonic boundary layers has been reported in numerous other studies, such as Ganapathisubramani et al. [26] and Elsinga [27] using planar and tomographic PIV, respectively. The present flow organization is also consistent with results found in incompressible boundary layers using hot-film/wire anemometry (see [28,29]) and planar PIV [30,31]. PIV data of the boundary layer without interaction showed that these streaks are at least as long as their fields-of-view.
Although on the mean no reversed flow is observed, patches of instantaneous reversed flow can be seen down-stream of low-speed streaks at y/δ=0.1 (see, e.g., Fig.5a). The largest patches have a length in the order of a bound-ary layer thickness, and are typically twice as long as they are wide. The minimum observed streamwise velocity in the patches is−0.2U∞.
From the instantaneous spanwise velocity field at y/δ = 0.1 (Fig. 5d) it can be seen that the spanwise velocity is
Fig. 5 Instantaneous velocity fields at y/δ=0.1;u/U∞(upper),w/U∞(middle) andv/U∞(lower); undisturbed interaction (left), disturbed by a single row of micro-ramps (middle), disturbed by staggered array of micro-ramps (right); The sonic line is indicated by a solid black line less coherent along both the streamwise and spanwise
direc-tions, consistent with the observations made by Ganapathi-subramani et al. [26] and Humble et al. [8] At y/δ = 0.6, the length-scale of the spanwise velocity variations does not appear to be different from that at y/δ =0.1 (compare for instance Figs.5d and6d). The magnitude of spanwise veloc-ity at y/δ = 0.1 also becomes about twice as large in the interaction region, and does not appear to decrease again within the field-of-view, whereas at y/δ =0.6 no increase in magnitude can be observed (see Fig.6d).
Figure 5g shows that the characteristic lengths of the wall-normal velocity at y/δ =0.1 appear to be smaller than those of the other velocity components. This result is sup-ported by spanwise spatial correlations evaluated at x/δ = −3.0 and x/δ = 1.0. Defining a typical length scale λas the width of the correlation curve at Rii(z)=0.5, λuand
λw are about 0.20δ, while λv is about 0.13δ, upstream of the interaction at x/δ = −3.0, having increased by about 15% at x/δ=1.0. Moreover, the deflection of the flow away from the wall due to the bulk dilatation of the subsonic flow occurs in distinct, compact regions, which seem to be alter-nated by regions in which the fluid is directed parallel with, or towards the wall. Comparing Figs.5g and6g it can be seen
that the characteristic length scale of the wall-normal velocity in streamwise and spanwise direction increases away from the wall, which is also consistent with results reported in lit-erature (see e.g. [2]). The spanwise correlations substantiates that at y/δ =0.6 length scales are of the order of 40–50% larger than at y/δ = 0.1 (at x/δ = −3.0, λu andλw are about 0.30δ, andλvis about 0.18δ).
Looking at the results of both perturbed interactions, we see that like in the unperturbed results, the streamwise veloc-ity at y/δ =0.1 is organized in streamwise streaks of low-and high-speed velocity. The time-averaged results suggest that in the perturbed flow these streaks are not randomly dis-tributed, but that their positions are to some extent determined by the micro-ramps. For both configurations, the patches of reversed flow look much like the patches observed in the undisturbed interactions in terms of their typical size and streamwise velocity. Based on visual inspection, the instan-taneous spanwise and wall-normal velocity fields of the per-turbed interactions at y/δ =0.1 do not show any particular difference in organization with respect to the undisturbed interaction.
At y/δ = 0.6, the instantaneous flow organization of both perturbed interactions look quite different from the
Fig. 6 Instantaneous velocity fields at y/δ=0.6; u/U∞(upper),w/U∞(middle) andv/U∞(lower); undisturbed interaction (left), disturbed by a single row of micro-ramps (middle), disturbed by staggered array of micro-ramps (right); The sonic line is indicated by a solid black line
unperturbed case. The locations of high- and low-speed regions are largely predetermined by the micro-ramps. Additionally, based on visual inspection, low-speed regions downstream of vertex locations appear to contain multiple structures that pass by a stationary observer at regular inter-vals of about a boundary layer thickness. Both spanwise and wall-normal velocity distributions show compact regions with coherent motions in the incoming boundary layer posi-tioned downstream of vertex locations. Farther downstream, within the redeveloping boundary layer, the coherent motions are more randomly distributed. This is also apparent from out-of-plane vorticity plots (not shown here for brevity). 3.4 Turbulence statistics
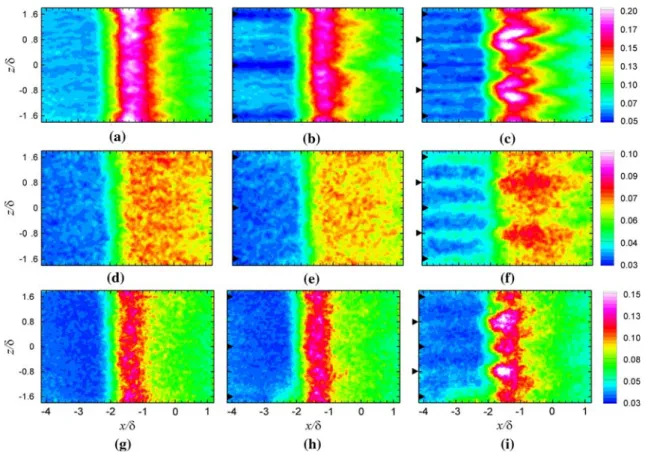
Spatial distributions of the RMS velocity fluctuations in streamwiseu, spanwisev, and wall-normalw direc-tions at y/δ = 0.1 and y/δ = 0.6 are shown in Figs.7 and8, respectively. The turbulence components and interac-tions are arranged as for the mean and instantaneous velocity components. The contour scales are chosen such to allow a clear comparison between the three interactions.
All turbulence components can be seen to increase as the interaction is approached and the flow begins to decelerate.
In the unperturbed interaction at y/δ = 0.1,u andw both reach maximum values of about 0.20U∞and 0.12U∞, respectively. Farther away from the wall, the maximum inten-sities ofuandware about halved. Note that the increase ofvin the interaction region is much smaller than the other components, indicating that significant turbulence anisot-ropy within this interaction is present.
At y/δ =0.1, the turbulence in wall-normal and stream-wise directions subsequently decreases downstream of the point where the flow becomes parallel to the wall, whereas the turbulence levels in spanwise direction remain relatively high for a longer streamwise distance and do not appear to decrease for about another two boundary layer thicknesses. Note that at y/δ=0.6, two peaks in turbulence can be iden-tified in plots of both the streamwise and wall normal turbu-lence: one at x/δ = −1.6 and another at x/δ = −1.0. The most upstream peak is associated with the reflected shock and the second peak with the incident shock. In case ofw only one region of increasing turbulence can be observed.
Looking at the perturbed interactions we see that at y/δ= 0.1, the effect of a single row configuration only appears to have a noticeable effect onu. The turbulence intensity of this component is lower downstream of the micro-ramps in the incoming boundary layer, throughout the interaction and
Fig. 7 Root mean square of velocity fluctuations at y/δ=0.1; u/U∞(upper),w/U∞(middle) andv/U∞(lower); undisturbed interaction (left), disturbed by a single row of micro-ramps (middle), disturbed by staggered array of micro-ramps (right)
during the recovery of the flow. The influence of the stag-gered array at y/δ = 0.1 is significantly greater than that of the single row:vandware both higher downstream of the micro-ramps whileushows a decrease with respect to the undisturbed scenario.
At y/δ=0.6, the turbulence organizations in the incom-ing boundary layer for both perturbed boundary layers are very different with respect to the unperturbed case. Down-stream of the micro-ramp vertices, turbulence levels are about twice as high than in the unperturbed boundary layer. At span-wise position away from the vertices turbulence levels have decreased compared to the unperturbed flow downstream of the single row, whereas in case of the staggered array no regions can be found where turbulence is lower than in the undisturbed case. Note that in the interaction region for both configurations at y/δ = 0.6 the highest levels ofu and wcan be found on the sides of the regions where on the
mean the lowest velocities were observed. 3.5 Statistical analysis
3.5.1 Reversed-flow probability
The effectiveness of the micro-ramps in reducing flow sep-aration was investigated by determining the relative
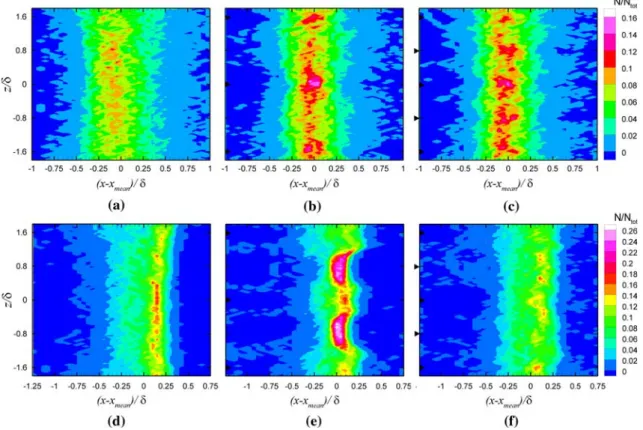
occur-rence of flow reversal (u/U∞<0) for each location within the wall-nearest measurement plane at y/δ = 0.1 (at the upper plane at y/δ =0.6, reversed flow was never observed). Figure9a–c show the results for the unperturbed interaction, the interaction perturbed by a single row of micro-ramps, and staggered array, respectively.
Figure 9a shows that the region in which flow reversal occurs in the undisturbed interaction is about 2δ long in streamwise direction, consistent with observations of Humble et al. [19], who carried out planar PIV on a very sim-ilar interaction in the streamwise-wall-normal plane. In the present study, flow-reversal occurs approximately in 15% of the observed time instants. The presence of the micro-ramps significantly affects the spatial distribution of the reversed-flow probability. Specifically, downstream of a micro-ramp this probability typically increases, whereas at other span-wise locations the probability can significantly decrease. This is consistent with the observations made by Pitt Ford and Babinsky [13]. As a consequence, the range of maximum reversed flow probability for different spanwise positions varies between 5–20% in case of the single row configuration and between 0–40% in case of the staggered configuration, as can be seen in Fig.9b and c, respectively.
In addition, the results show two features that have been seen throughout the discussion of the results, (i) the effect of
Fig. 8 Root mean square of velocity fluctuations at y/δ=0.6; u/U∞(upper),w/U∞(middle) andv/U∞(lower); undisturbed interaction (left), disturbed by a single row of micro-ramps (middle), disturbed by staggered array of micro-ramps (right)
Fig. 9 Percentage of the ensemble that reversed flow was observed at y/δ =0.1; (a) undisturbed interaction; (b) disturbed by a single row of micro-ramps; and (c) disturbed by staggered array of micro-ramps
the staggered array on the flow at y/δ =0.1 is greater than that of the single row, and (ii) in the staggered configuration, the influence of the upstream row of micro-ramps is more pronounced than the influence of the downstream row.
3.5.2 Location of deceleration region
To investigate the influence of the micro-ramps on the unsteady motion of the reflected shock wave, the relationship between velocity fluctuations within the incoming boundary
layer and the reflected shock wave’s position is investigated. The approach adopted follows that of Ganapathisubramani et al. [7], who considered the position of a velocity isosur-face as a surrogate for the streamwise position of the shock wave. In case of the perturbed interactions however, the mean velocity in the incoming boundary varies with spanwise posi-tion, which would lead to an incorrect comparison between different spanwise sections. Therefore, instead of a fixed velocity threshold, the surrogate shock-wave position (which from hereon will be referred to as the shock position), was
Fig. 10 Discrete PDFs of the reflected shock wave surrogate position at y/δ=0.1 (upper) and y/δ=0.6 (lower); undisturbed interaction (left), disturbed by a single row of micro-ramps (middle), disturbed by staggered array of micro-ramps (right)
taken as the streamwise position where the velocity is 0.15
U∞lower than the upstream mean velocity, at x/δ= −3.0. Although this choice has some arbitrariness, it was verified that the qualitative trends of the results did not change for rel-atively small variations in the chosen threshold. The reader may note that this approach agrees with that of Ganapathi-subramani et al. [7] in the case of an undisturbed interac-tion, where the mean velocity in the incoming boundary is uniform. Furthermore, note that at y/δ = 0.1, the chosen threshold lies within the subsonic region of the interaction. The choice of this criterion is also supported by the outcome that the present results are in agreement with those found in literature, as will be shortly discussed. The (surrogate) posi-tion of the reflected shock at given time instant and spanwise position, XS(z,t), was normalized by subtracting its mean positionXS(z)T for a given spanwise location and scaling it with the boundary layer thicknessδ. For each case consid-ered, the streamwise position of the shock position was deter-mined for all spanwise locations, for each individual velocity field. Thereafter, probability density functions (PDFs) were generated that indicate the relative probability (N/Ntot)of
the shock position falling within a certain bin, with the bin width taken as 0.05δ. These PDFs are represented in Fig.10. The undisturbed, single row, and staggered configurations at
y/δ =0.1 and y/δ =0.6 are depicted from left to right in the upper and lower rows, respectively.
The results suggest that the reflected shock undergoes a streamwise motion that is of the order ofδ, and that the extent of this motion increases towards the wall, which is consistent with the observations of Dupont et al. [4] in their incident SWTBLI study at Mach 2.23, for instance. At y/δ= 0.6, the histograms are notably skewed and the mean and median positions do not coincide. This is consistent with Humble et al. [8] who found this same trend at y/δ =0.43 and y/δ = 0.82 for example. The micro-ramps appear to reduce the length of the intermittent region. At y/δ=0.1, the largest reductions typically occur downstream of the apexes. This observation is supported by the fact that the standard deviation of the shock position,σ(XS)calculated for each spanwise position, attains local maxima at the correspond-ing spanwise positions. Interestcorrespond-ingly, lookcorrespond-ing at the results at y/δ =0.6, it can be seen that for the single row configu-ration the largest reductions in the length of the intermittent region are found at spanwise locations in between the micro-ramp vertices, which signifies a trend reversal with respect to the results at y/δ = 0.1. The influence of the staggered array shows more spanwise uniformity at y/δ =0.6. These observations are again supported by the spanwise location
Fig. 11 Conceptual sketch of the perturbed interaction. (a) presence of hairpin vortices (transparent green) downstream of micro-ramp vertices, and high-speed regions at
intermediate positions. Velocity vectors are shown in a convective reference from of 0.73U∞, (b) conceptual sketch of the perturbed interactions, depicting parts are the boundary layer velocity profiles and conforming subsonic region. Note that both drawings are not shown to scale
of local maxima in the standard deviation of the shock posi-tions. Remembering that a trend reversal with distance from the wall was also found in spanwise variation in the turbu-lence intensity in streamwise directionu of the incom-ing boundary layer, this may substantiate the notion that the shock motion is related to the streamwise velocity fluctua-tions, as reported elsewhere (see e.g., [7,8]).
Finally, in order to assess the spanwise-averaged effect of the micro-ramps on the length of the intermittent region, the discrete PDFs were averaged over the spanwise range −0.8 < z/δ < 0.8. At y/δ = 0.1, the spanwise-averaged
reduction in the length of the intermittent region is similar for both micro-ramp configurations, as they both decrease the standard deviation of the shock positions by about 20% with respect to the undisturbed interaction. At y/δ = 0.6, the result for the two configurations is essentially differ-ent, as can also bee seen from Fig.10. Whereas the single row configuration on average reduces the standard devia-tion of the shock posidevia-tions with 30% with respect to that of the undisturbed interaction, the staggered configuration on averaged does not affect the standard deviation of the shock positions.
3.6 Conceptual model
To consolidate the major observations made, a conceptual model of the effects of micro-ramps on the SWTBLI is now presented. In the model, the micro-ramps generate on the mean flow level longitudinal streamwise vortices that induce low-speed regions downstream of vertex locations and high-speed regions at intermediate spanwise locations. Instantaneously, however, no streamwise vortices are apparent. Instead, individual structures are convected within the boundary layer, which consist of pairs of counter-rotating vortices. The observed presence of a counter-rotating vor-tex pair is reminiscent of the conditional eddies obtained by Tomkins and Adrian [30], who identified them as cross-sections through conditional hairpin vortices. The generation of hairpin vortices by objects in our boundary layer would be consistent with results reported for incompressible bound-ary layers. For instance, Tufo et al. [32] have found trains of hairpin vortices in the wake of a hemispherical roughness element in a low-speed turbulent incompressible boundary layer using direct numerical simulations (DNS), similar as in the experimental investigations of Acerlar and Smith [33], and we anticipate that a comparable phenomenology also exists downstream of our micro-ramp SBVGs. The concep-tual model is schematically summarized in Fig.11a. As a result of this modification within the incoming boundary layer, downstream of a low-speed streak in the interaction region, the flow becomes sonic farther upstream. Conversely, the opposite trend occurs downstream of a high-speed region. Thus, the mean flow organization of the subsonic region con-forms to the mean velocity distribution within the incoming boundary layer. Figure11b shows a conceptual sketch of the perturbed interaction in the mean flow sense. Note that both drawings are not shown to scale.
4 Conclusions
Stereo-PIV measurements in wall-parallel planes have been performed to investigate the effect of two configurations of micro-ramps; a single row and a staggered array, on an oblique shock reflection at a free-stream Mach number of 1.84.
It is shown that the micro-ramps generate individual vortex pair packets downstream of their vertices, that on the mean act like longitudinal streamwise vortex pairs. These structures perturb the incoming boundary layer such that on the mean low-speed regions occur downstream of the verti-ces and high-speed regions at intermediate locations. Down-stream of the low-speed regions in the incoming boundary layer, the probability of reversed flow occurrence in the inter-action region is higher, and the subsonic region is longer in streamwise direction. Overall, the probability of the
occur-rence of reversed flow in the interaction region at 0.1δaway from the surface decreased by 20 and 30% downstream of the single row and the staggered configuration, respectively. Both configurations of micro-ramps stabilize the shock motion by reducing the length of its motion by about 20% at a distance of 0.1δfrom the wall. Micro-ramps perhaps offer promising prospects for the control of such SWTBLIs. Acknowledgments This work is supported by the Dutch Technology Foundation STW under the VIDI—Innovation Impulse program, grant DLR.6198.
Open Access This article is distributed under the terms of the Creative Commons Attribution Noncommercial License which permits any noncommercial use, distribution, and reproduction in any medium, provided the original author(s) and source are credited.
References
1. Dolling, D.S.: Unsteadiness of shock-induced turbulent separated flows-some key questions. In: 31th AIAA Fluid Dynamics Confer-ence & Exhibit, AIAA 2001-2708, Anaheim, CA, June (2001) 2. Smits, A.J., Dussauge, J.P.: Turbulent Shear Layers in Supersonic
Flow, 2nd edn. Springer, Berlin (2006)
3. Dussauge, J.P., Dupont, P., Debiève, J.F.: Unsteadiness in shock boundary layer interactions with separation. Aerosp. Sci. Tech-nol. 10, 85–91 (2006)
4. Dupont, P., Haddad, C., Debiève, J.F.: Space and time orga-nization in a shock-induced separated boundary layer. J. Fluid Mech. 559, 255–277 (2006)
5. Beresh, S.J., Clemens, N.T., Dolling, D.S.: Relationship between upstream turbulent boundary-layer velocity fluctuations and sepa-ration shock unsteadiness. AIAA J. 40, 2412–2422 (2002) 6. Délery, J.M.: Shock/wave/turbulent boundary layer interaction and
its control. Progr. Aerosp. Sci. 22, 209–280 (1985)
7. Ganapathisubramani, B., Clemens, N.T., Dolling, D.S.: Effects of upstream coherent structures on low-frequency motion of shock-induced turbulent separation. In: 45th AIAA Aerospace Science Meeting and Exhibit, AIAA 2007-1141, Reno, NV, Jan 8–11 (2007) 8. Humble, R.A., Elsinga, G.E., Scarano, F., van Oudheusden, B.W.: Three-dimensional instantaneous structure of a shock wave/turbu-lent boundary layer interaction. J. Fluid Mech. 622, 33–62 (2009) 9. Pearcey, H.H.: Shock-induced separation and its prevention by boundary layer control. In: Lachmann, G.V. (ed.) Boundary Layer and Flow Control: Its principles and Applications (2 Volumes), chap. 2, pp. 1170–1344. Pergamon Press, Oxford (1961) 10. Lin, J.C.: Review of research on low-profile vortex generators to
control boundary-layer separation. Progr. Aerosp. Sci. 38(4–5), 389–420 (2002)
11. McCormick, D.C.: Shock/boundary-layer interaction control with vortex generators and passive cavity. AAIA J. 31(1), 91–96 (1993) 12. Barter, J.W., Dolling, D.S.: Reduction of fluctuating pressure loads in shock/boundary-layer interactions using vortex. AAIA J. 33(10), 1842–1849 (1995)
13. Pitt Ford, C.W., Babinsky, H.: Micro-ramp control for oblique shock wave/boundary layer interactions. In: 37th AIAA Fluid Dynamics Conference and Exhibit, AIAA 2007-4115, Miami, FL, June (2007)
14. Anderson, B.H., Tineapple, J., Surber, L.: Optimal control of shock wave turbulent boundary layer interactions using micro-array actu-ation. In: 3rd AIAA Flow Control Conference, AIAA 2006-3197, San Francisco, CA, June (2006)
15. Ashill, P.R., Fulker, J.L., Hacket, K.C.: Research at DERA on sub boundary layer vortex generators (SBVGs). In: 39th AIAA Aero-space Sciences Meeting and Exhibit, AIAA 2001-0887, Reno, NV, Jan (2001)
16. Holden, H., Babinsky, H.: Effect of microvortex generators on separated normal shock/boundary layer interactions. J. Air-craft 44(1), 170–174 (2007)
17. Tuinstra, M.: A PIV investigation on shock wave boundary layer interaction: an oblique shock impinging on a flat plate turbulent boundary layer, M.Sc. Thesis, Faculty of Aerospace Engineering, Delft University of Technology, Aug (2005)
18. Schrijer, F.F.J., Scarano, F.: Particle slip compensation in steady compressible flows. In: 7th International Symposium on Particle Image Velocimetry, Rome, Italy, Sep (2007)
19. Humble, R.A., Scarano, F., van Oudheusden, B.W.: Particle image velocimetry measurements of a shock wave/turbulent boundary layer interaction. Exp. Fluids 43, 173–183 (2007)
20. Hou, Y.X.: Particle image velocimetry study of shock-induced tur-bulent boundary layer separation. PhD Thesis, Department of Aero-space Engineering and Engineering Mechanics, The University of Texas at Austin (2003)
21. Elena, M., Lacharme, J.P.: Experimental study of a supersonic tur-bulent boundary layer using a laser Doppler anemometer. J. Theor. Appl. Mech. 7, 175–190 (1988)
22. Klebanoff, P.: Characteristics of turbulence in a boundary layer with zero pressure gradient, NACA Rept. 1247 (1955)
23. Spina, E.F.: Organized structures in a supersonic turbulent bound-ary layer. PhD thesis, Department of Mechanical and Aerospace Engineering, Princeton University, NJ, USA (1988)
24. Mounts, J.S., Barber, T.J.: Numerical Analysis of Shock-Induced Separation Allevation Using Vortex Generators. AIAA 1992-0751, Jan (1992)
25. Lee, S., Loth, E., Kim, S.: LES of Supersonic Turbulent Boundary Layers withµVGs. In: 25th AIAA Applied Aerodynamics Con-ference. Miami, AIAA 2007-3916, FL, June (2007)
26. Ganapathisubramani, B., Clemens, N.T., Dolling, D.S.: Large-scale motions in a supersonic boundary layer. J. Fluid Mech. 556, 271–282 (2006)
27. Elsinga, G.E.: Tomographic particle image velocimetry and its application to turbulent boundary layers. PhD thesis, Fac-ulty of Aerospace Engineering, Delft Technical University, The Netherlands (2008)
28. Kim, K.C., Adrian, R.J.: Very large-scale motion in the outer layer. Phys. Fluids 11, 417–422 (1999)
29. Hutchins, N., Marusic, I.: Evidence of very long meandering fea-tures in the logarithmic region of turbulent boundary layers. J. Fluid Mech. 579, 1–28 (2007)
30. Tomkins, C.D., Adrian, R.J.: Spanwise structure and scale growth in turbulent boundary layers. J. Fluid Mech. 490, 37–74 (2003) 31. Ganapathisubramani, B., Longmire, E.K., Marusic, I.:
Charac-teristics of vortex packets in turbulent boundary layers. J. Fluid Mech. 478, 35–46 (2003)
32. Tufo, H.M., Fischer, P.F., Papka, M.E., Szymansky, M.: Hairpin vortex formation, a case study for unsteady visualization. In: 41st CUG Conference, Minneapolis, MN (1999)
33. Acerlar, M.S., Smith, C.R.: A study of hairpin vortices in a laminar boundary layer. Part 1. Hairpin vortices generated by a hemisphere protuberance. J. Fluid Mech. 175, 1–41 (1987)
34. Souverein, L.J., van Oudheusden, B.W., Scarano, F., Dupont, P.: Application of a dual-plane particle image velocimetry (dual-PIV) technique for the unsteadiness characterization of a shock wave turbulent boundary layer interaction. Meas. Sci. Tech-nol. 20, 074003 (2009)
35. Samimy, M., Lele, S.K.: Motion of particles with inertia in a com-pressible free shear layer. Phys. Fluids A 3, 1915–1923 (1991) 36. Westerweel, J., Scarano, F.: Universal outlier detection for PIV