How Does Provider Supply and Regulation Influence Health Care Markets? Evidence from Nurse Practitioners and Physician Assistants∗
Kevin Stange
Gerald R. Ford School of Public Policy University of Michigan, kstange@umich.edu
November 24, 2012
Abstract
Nurse practitioners (NPs) and physician assistants (PAs) now outnumber family practice doctors in the United States and are the principal providers of primary care to many communities. Recent growth of these professions has occurred amidst considerable cross-state variation in their
regulation, with some states permitting autonomous practice and others mandating extensive physician oversight. I find that expanded NP and PA supply has had minimal impact on the office-based healthcare market overall, but utilization is modestly more responsive to supply increases in states permitting greater autonomy. Results suggest an importance of laws impacting the division of labor, not just its quantity.
I. Introduction
The Patient Protection and Affordable Care Act (ACA) of 2010 contains a number of provisions predicated on the belief that adequate availability of primary care providers is crucial if expanded insurance coverage is to translate into greater healthcare access. The ACA calls for a significant expansion of the National Health Service Corps (NHSC), more primary care residency positions, and increases in Medicare and Medicaid reimbursement for primary care services, among
others.1 These provisions of the ACA represent just the latest manifestation of public concern for the number, quality, and geographic distribution of healthcare providers in the United States. This concern stretches back more than a century, when Flexner’s (1910) conclusion that the United States had an oversupply of poorly-trained physicians resulted in a substantial contraction in the number of medical schools and new physicians at the start of the 20th century (Blumenthal, 2004). Subsequent policy attempts to influence the healthcare workforce has taken many forms, from funding for graduate medical education via Medicare to the establishment in 1972 of the NHSC and its recent expansions through the ACA and the American Recovery and
Reinvestment Act of 2009.
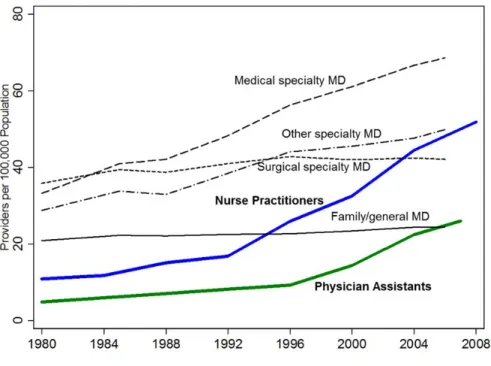
A recent development in this old policy issue is the emergence of nurse practitioners (NPs) and physician assistants (PAs) as part of the solution.2 Though around since the 1960s, only after experiencing rapid growth in the 1990s have these professions become sizable enough to provide a large scale complement or alternative to physician care (Figure 1). With more than 85,000 PAs and 150,000 NPs eligible to practice, their ranks now exceeds the number of general and family practice MDs and is approaching the number of primary care physicians, estimated to be about 260,000.3 In many communities, physician assistants and nurse practitioners are already the principal providers of primary care.
Supply growth has occurred against the backdrop of considerable cross-state variation in what NPs and PAs are permitted to do, with some states permitting autonomous practice while others mandating extensive physician oversight and collaboration. In fact, one of the four key messages in a recent Institute of Medicine study was that “nurses should practice to the full extent of their education and training,” noting that a “variety of historical, regulatory, and policy barriers have limited nurses’ ability to generate widespread transformation” to the healthcare system (Institute of Medicine, 2011). Significant occupational restrictions thus may limit the extent to which expansions in the number of providers has translated into meaningful changes in healthcare outcomes. Though several states have broadened scope-of-practice laws and expanded prescriptive authority – innovations that should enable NPs and PAs to operate more
independently from physicians – substantial restrictions on the substitutability of NP and PA for physician care still remains in many states.
These workforce and regulatory changes have significantly altered how primary care is delivered in this country, but the consequences for health care markets have not yet been studied. Previous research on the effects of physician supply is mostly cross-sectional (limiting causal inference), has found mixed results, and may not inform the likely effects of NPs and PAs. To fill this gap, I exploit variation in NP and PA concentration and regulatory environment across areas and over time, made possible by a newly-constructed panel dataset on the number of licensed NPs and PAs at the county level. I employ two complementary identification strategies to address the possible endogeneity of NP and PA supply. A county fixed effects approach exploits within-county variation in provider supply over time while an instrumental variables approach exploits cross-sectional geographic variation in provider supply that is due to the historical location of educational infrastructure for training registered nurses and PAs.
My findings suggest that, on average, greater supply of NPs and PAs has had minimal impact on utilization, access, use of preventative health care services, or prices. However, primary care utilization is modestly more responsive to provider supply in states that grant NPs the greatest autonomy. I find no evidence that increases in provider supply decreases prices, even for visits most likely to be affected by NPs and PAs: primary care visits in states with a favorable regulatory environment for NP and PAs. My estimates are sufficiently precise to rule out fairly small changes in price and utilization. Results using the county fixed effects and 2SLS
approaches are very similar. I also examine the direct effect of occupational regulation by
exploiting changes in state-level prescribing laws over time. I find that expansions in prescriptive authority for NPs are associated with moderately greater utilization, though the opposite is true for PAs. Neither change appears to reduce visit prices, so health expenditure patterns mirror utilization: greater NP prescriptive authority increases expenditure while the comparable change for PAs decreases it.
This study is the first to quantify the effects of increased supply of non-physician clinicians on access, costs, and patterns of utilization for a broad population-based sample. Previous research has focused on very specific settings or populations or has not accounted for fixed differences between areas that may be correlated with regulations, provider supply and outcomes. Understanding the effects of one of the largest changes in the delivery of healthcare in the past few decades is a first-order question for health policy. This paper also represents one of the first analyses of the consequences of occupational regulation on output markets. How changes in occupational boundaries affect demand for and supply of services as well as prices and quality is not well understood. Findings about the impact of scope-of-practice regulations have implications for many other sectors, both within and outside of health care, that have seen a
blurring of occupational boundaries and an increase in licensing. Dental hygienists, paralegals, and tax professionals now perform many duties historically performed by dentists, lawyers, and accountants. The occupational regulatory environment moderates these shifts in the division of labor, but has not been studied extensively.
The remainder of this paper proceeds as follows. The next section provides a brief
background on NPs and PAs, summarizes related literature, and describes anticipated effects. Section III introduces the data, including the new dataset on county-level NP and PA supply and state-level regulations that was assembled for this project. Section IV describes my empirical strategy. Results are presented in Sections V through VII and Section VIII concludes.
II. Background
A. Nurse practitioners and physician assistants: background and recent changes
Nurse practitioners (NPs) and physician assistants (PAs) are health care professionals that perform tasks similar to many physicians. Both professions emerged in the 1960s as a way for individuals with existing healthcare expertise to provide higher-level care more autonomously to underserved areas. NPs are registered nurses (RNs) that have received advanced training which permits them to diagnose patients, order and interpret tests, write prescriptions, and provide treatment for both acute and chronic illnesses. NPs have typically completed a two-year nurse practitioner masters program, passed a national exam, and are licensed by state boards of nursing. NPs practice in settings similar to physicians: doctors’ offices, hospitals, outpatient clinics, community clinics, or their own practice (in some states). Physician assistants can perform any duties delegated to them by physicians, though in practice the range of activities performed by PAs is very similar to NPs. PAs have typically graduated from a two-year PA
program (usually housed in a medical school), passed a national exam, and are licensed by state boards of medicine.
Like physicians, NPs and PAs are not evenly distributed across the county, though historically NPs and PAs are more likely to provide care for the underserved and locate in rural areas than physicians (Larson et. al, 2003, Grumbach et. al, 2003, and Everett et. al , 2009). Figure 2 plots the number of NPs and PAs per primary care physician in each county in 1996 and 2008 for states with provider supply data available (described in a later section). Across all states, the number of NPs per primary care physician increased from 0.25 to 0.49 and the number of PAs per primary care MD increased from 0.13 to 0.29, though there is considerable cross- and within-state variability these trends.
The level of physician supervision or collaboration required of NPs and PAs and their permitted tasks (referred to as “scope-of-practice” laws) is determined by state law and thus varies tremendously by state. The West and New England regions are thought to be the most favorable to non-physician clinicians, but there is variation within regions and across the two professions (US Health Resources and Service Administration, 2004). Individual state licensing laws regulating health professions have also been changing in many states to permit NPs and PAs to practice more independent (Fairman 2008). The ability to write prescriptions is one important component of independence that has changed dramatically over the past two decades, as depicted in Figure 3 from 1996 to 2008. Currently NPs and PAs can prescribe at least some controlled drugs in almost all states, up from 5 and 11, respectively, as recently as 1989.
Care provided by nurse practitioners and physician assistants is reimbursed by insurers in two ways (US Department of Health and Human Services, 2011). Reimbursement can be made directly through these providers’ own National Provider Identifier (NPI), often at a fraction of
the physician reimbursement rate. For instance, Medicare reimburses direct-billed services provided by NPs and PAs at 85% of the physician rate, as do many private insurers and many state Medicaid programs. Alternatively, if NP or PA care is provided as part of an episode of care provided by a physician, the services can be reimbursed at 100% through the physician’s NPI, which is referred to as reimbursement for NP or PA care provided “incident-to” physician care.
B. Expected effects of non-physician supply and regulation
An expansion of non-physician clinicians could impact the health care market both through prices and utilization. On the price side, more NPs and PAs may lower prices indirectly by injecting more competition into the market for primary care services (regardless of provider type). Economic theory predicts that an increase in the supply of a key input to production (labor) should lower output prices if markets are competitive. As imperfect substitutes for physicians, NPs and PAs could also lower output prices directly by enhancing labor productivity through a more extensive division of labor.4 The efficient division of labor is determined, in part, by coordination costs between workers (Becker and Murphy, 1992), which may be low if NPs and PAs work collaboratively with physicians.
Utilization may also respond to greater provider presence through several channels, though the combined effect is theoretically ambiguous. Greater supply may increase utilization for people who previously went without care because they were not able to find a primary care provider. However, additional non-physician providers may partially "crowd-out" physicians if physician supply responds to the increased competition. The net effect on provider availability is likely to be positive, though the magnitude will depend on the extent to which the NPs and PAs increase the number of primary care providers rather than merely substitute for physicians. There
is also the possibility that NPs or PAs may make more referrals to specialists or that physicians may substitute to performing more specialized or complex procedures, both of which would increase the utilization of (more costly) specialist care and increase expenditures. However, greater use of primary care and NPs’ greater focus on prevention may also reduce the need for some health services, thus reducing utilization.
Since these providers have different training than the physicians they substitute for, the growth of NPs and PAs may also impact quality of care (either real or perceived). Evidence suggests that patients treated by NPs have similar outcomes as those treated by physicians, but some critics still voice concern about non-physicians’ ability to detect rare or severe illnesses.5 Even if physicians and non-physicians provide care of equal clinical quality, perceived quality differences between provider types could also lead to changes in utilization as the mix of providers is altered. Furthermore, NPs are trained in a nursing model which places more emphasis on prevention and health behavior, and typically spend more time with patients. Consequently, expanded NP supply may also increase rates of immunization, screening, and routine checkups. Physician assistants, by contrast, are trained in the medical model and work closely with physicians, so differences between MDs and PAs on the prevention dimension of utilization may be smaller.
Theoretical work on occupational regulation generally concludes that stricter regulation increases prices, but has ambiguous effects on utilization due to offsetting effects via supply (regulation restricts supply, reducing quantity) and demand (regulation assures quality and motivates human capital investment, increasing quantity) (Leland, 1979, Shaked and Sutton, 1981, and Shapiro, 1986). While this theoretical work focused on the strictness of occupational entry requirements, it is reasonable to apply the result to task regulation as well. Locales that
permit NPs and PAs to perform more tasks independent from physicians should experience lower prices, but ambiguous effects on utilization.
Thus a loosening of scope-of-practice laws for NPs and PAs is expected to reinforce expansions in provider supply. I expect larger effects of non-physician supply on utilization and prices in states that permit NPs and PAs to practice more autonomously, as this allows
production to be closer to the possibilities frontier. A similar logic implies that the effect of supply will be largest for the tasks (or types of visits) for which NPs, PAs, and physicians are most substitutable.
C. Previous research on the effects of provider supply
Previous research has documented the aggregate growth of nurse practitioners and physician assistants and discussed the importance for primary care delivery, but has not quantified the consequences.6 Previous analysis of the effects of provider supply has focused exclusively on physicians, finding fairly mixed evidence of the relationship between provider supply and utilization, prices, and expenditure.
Several studies have found that more primary care physicians is associated with fewer hospitalizations for ambulatory-sensitive conditions and lower mortality (Chang, Stukel, Flood, and Goodman, 2011, Laditka, Laditka, and Probst, 2004). An absence of ambulatory-sensitive condition hospitalizations is generally interpreted as a marker of sufficient access to primary care. Guttman et al (2010) find that children living in areas with more physicians had more primary care visits and less emergency department use. Continelli, McGinnis, and Holmes (2010) found that having more primary care physicians nearby is associated with greater use of preventive health measures. However, Grumbach, Vranizan, and Bindman (1997) find no such relationship between provider concentration and self-reported measures of access. All these
studies examine the relationship between provider supply and outcomes in a single cross-section with individual- and locational controls and thus might be subject to omitted variable bias if provider supply is correlated with unobserved demand factors.
On the expenditure side, Chang et. al. (2011) finds no consistent association between provider supply and Medicare spending, though Baicker and Chandra (2004a, 2004b) do find that provider mix matters: areas with more specialist rather than generalist MDs have higher health care expenditures. Chernew, Sabik, Chandra, and Newhouse (2009) find that a greater concentration of primary care physicians is not associated with lower spending growth, despite being correlated with lower spending levels at a point in time. An earlier line of research found a positive association between physician supply and prices, interpreting it either as evidence of physician-induced demand or diminished consumer information when physician supply increases (Pauly and Satterhwaite, 1981). Despite their prevalence, no prior work provides direct estimates of the market-wide effects of NPs or PAs on healthcare markets.
D. Previous research on occupational regulation
There is also relatively little research on the labor and output market effects of occupational restrictions.7 Extant research has focused on the consequence of stricter entry regulations for a single licensed profession, rarely looking at the effects of regulations delineating the division of labor between various licensed professions. I am not aware of any previous work that examines how occupational regulation moderates the growth of input supply to influence output markets.
Higher entry barriers have typically been associated with higher prices and lower quantity, though quality effects are mixed. For instance, Kleiner and Kudrle (2000) find that stricter licensing raises the price of dental services and earnings of dentists, but is not associated with better oral health. Schaumans and Verboven (2008) find that entry restrictions and regulated
mark-ups for pharmacies result in a welfare loss for consumers by inflating prices and
significantly reducing the number of pharmacies and physicians. Hotz and Xiao (2011) find that stricter child care regulations reduces supply of child care (particularly in low-income markets), but also increases the quality of services provided (particularly in higher income markets). Thus child care regulation creates a tradeoff between higher quality care for high income families but restricted supply in low income markets.
Research on laws regulating which functions a licensed profession can do is sparse and only a handful of studies exploit variation in laws over time to address the potential omitted variable bias in cross-sectional approaches.8 Dueker, Jacox, Kalist, and Spurr (2005) find that greater prescriptive authority for advance practice nurses (APNs) is associated with lower earnings for APNs and physicians, but higher wages of physician assistants. This suggests that physicians respond to greater APN autonomy by hiring fewer APNs and more PAs. The present study is most closely related to Kleiner and Park (2010) and Kleiner, Marier, Won Park, and Wing (2011), which examine the labor market impact of scope-of-practice regulations for dental hygienists and nurse practitioners, respectively. In the former, the authors find that laws that permit hygienists to operate independent from dentists increase hygienists’ wages and result in lower wages and employment growth for dentists. The latter study examines the effect of changes in nurse practitioner regulations from 2002 to 2007 on wages and the prices for well-child visits. The authors find that wages of NPs increase and that the price of well-well-child visits decreases when NPs are permitted to do more tasks.
These studies suggest that the growth of NP and PA independence (indicated by, for instance, these professions’ ability to write prescriptions) should have both labor and output market
the role of occupational regulations in moderating the effects of input supply been examined.9 Relative to Kleiner, Marier, Won Park, and Wing (2011), the present study examines utilization and access, focuses on the interactive effects of provider supply and regulation, and looks at a much broader set of health care outcomes.
III. Data
A. New data on health care providers and regulations
A huge barrier to research on NPs and PAs has been a lack of data on the number of these providers at the sub-national level over time. To fill this gap, in collaboration with Deborah Sampson from Boston College School of Nursing, I assembled a new dataset containing the number of licensed nurse practitioners and physician assistants at the county level annually for the years 1990-2008 using individual licensing records obtained from relevant state agencies. The years for which data is available varies across states, so our county panel is unbalanced: NP and PA supply data is available for 23 states covering 52% of the U.S. population in 1996, but increases to 35 states covering 80% in 2008.10 Data on the number of primary care physicians was obtained from the Area Resource File. Throughout I refer to all general practice, family practice, generalist pediatric, general internal medicine, and general obstetrician/gynecologist physicians as “primary care” and include only these providers in our measures of physician supply.
Occupational regulations in each state are characterized in two ways. First, I quantify the overall practice environment for NPs and PAs in the state at a single point in time (2000) using an index constructed by the Health Services Resource Administration (HRSA, 2004). This index ranks states separately for NPs and PAs along three dimensions: (1) legal standing and
authority (type of drugs, requirements for MD oversight); (3) reimbursement policies (e.g.
Medicaid reimbursement rates and requirements for private insurers). These three dimensions are then combined into a single index with a possible range from zero to one.11 This time-invariant index is used to assess whether outcomes are more responsive to NP and PA supply in areas with more favorable environments for these providers. To be able to assess the direct effect of
regulation on outcomes (rather than the indirect effect via supply responsiveness), as a second measure we also constructed indicators for whether nurse practitioners and physician assistants are permitted to write prescriptions for any controlled substances in a given state and year.
B. Outcomes
I study the health care experience of participants in thirteen waves of the Household Component of the Medical Expenditure Panel Survey (MEPS) from 1996 to 2008. The MEPS is a 2 year panel of households drawn from the National Health Interview Survey, which I treat as a repeated cross-section in each year. Characteristics of respondents' county and state were merged onto the MEPS files using individuals’ state and county FIPS codes.12 Since historical data on NP and PA supply could only be constructed for some states and for some years, the final dataset has 293,100 person-year observations (compared to 404,400 for all state-years), though the analysis sample is slightly smaller due to missing values for some key covariates.13
Summary statistics are presented in Appendix B. On average, individuals in the sample live in counties with 90 primary care physicians, 30 NPs, and 17 PAs per 100,000 population. Seventy-nine (seventy-three) percent live in states that permit NPs (PAs) to write prescriptions for controlled substances. On average they make 2.8 office-based health care visits per year, with 62% having at least one. Approximately half of these visits are for primary care whose total expenditure (from all payers) is $153 per year (in 2010 dollars, including those with zero
expenditure).14 Similar to the national trend, the NP and PA to population ratios for my sample more than doubled from 1996 to 2008. Despite these extreme changes in the health care
workforce, there has been surprisingly little change in most measures of office-based health care utilization during this time period.
To assess the price impact of workforce and regulatory changes, I pool the MEPS office-based medical provider visits files from 1996 to 2008. The visits files contain a separate
observation for each visit, call, or interaction with office-based health care providers by MEPS participants during the survey period. I restrict the sample to visits to physicians, nurse or nurse practitioners, or physician assistants and also exclude visits categorized as for mental health, maternity, eye exam, laser eye surgery, or other reasons. After these restrictions, my analysis sample includes 803,200 visits by individuals living in counties for which physician, nurse practitioner, and physician assistant supply data is available in the survey year.
One limitation of the MEPS visits data is that visits to NPs and PAs are often classified as physician visits due to question framing and misreporting and physician specialty is only
available since 2002.15 Therefore I do not look extensively at visit provider type as reported in MEPS, and instead focus on market-level effects across all provider types. In order to identify visits that are potentially most affected by NP and PA supply growth and regulation, for each visit I construct a measure of the predicted likelihood that the visit would be to a primary care provider, given observed individual and visit-level characteristics. The most common high likelihood visits includes flu shots, no condition checkups, and visits for a sore throat.16
Twenty percent of visits are unrelated to a specific medical condition and relatively few include any specific treatment or service. The vast majority of visits are categorized as general check-ups, well-child exams, or for the diagnosis/treatment of a specific condition. I estimate
that the average visit has a 51% likelihood of being to a primary care provider which implies that in expectation, slightly more than half of office-based visits are for primary care. The average visit costs $119 across all years, with visit charges approximately $100 more.
IV. Empirical Approach A. Fixed effects specification
To estimate the causal effect of NP and PA supply and its interaction with the regulatory environment on health care access, utilization, and expenditure, I estimate the following regression model using OLS:
1 2
ijt jt jt x ijt z jt j t ijt
y =βNP +β PA +β X +β Z +δ +δ +ε (1)
where 𝑦𝑖𝑗𝑡is an outcome (number of visits, total expenditure, have usual source of care, etc) for individual i in county j at time t.17 As measures of provider concentration (𝑁𝑃𝑗𝑡and 𝑃𝐴𝑗𝑡) I use the log of the number of NPs and PAs per 100,000 population in area j at time t. Fixed and time varying factors at the individual level, such as income category, age, race, insurance type, and self-reported health status are controlled for with 𝑋𝑖𝑗𝑡. To control for fixed unobserved
determinants of outcomes across areas and over time that may be correlated with NP/PA concentration or practice indices, I also include county and year fixed effects 𝛿𝑗 and 𝛿𝑡. The vector 𝑍𝑗𝑡 controls for time-varying factors at the county level that may be correlated with both provider supply and outcomes. In this vector, most specifications control for the number of primary care physicians per capita, to account for the possible crowd-out of physicians by greater NP and PA presence. In practice, I find little evidence of crowd-out or crowd-in, so the results are insensitive to whether physician supply is included. My preferred specification also controls for state-specific linear time trends and a host of time-invariant county characteristics (measured at baseline) interacted with linear time trends. Some specifications also control for the predicted
number of non-primary-care doctor visits made by an individual in the survey year. 𝜀𝑖𝑗𝑡 is an error term that is assumed to be uncorrelated with all the right hand side variables.
The key parameters of interest are 𝛽1 and 𝛽2, the change in outcome y associated with a one unit increase in NP or PA concentration, holding the included control variables constant. In order to quantify the effect of state regulation on the responsiveness of outcomes to supply, I let these parameters vary with the state practice index in state s in 2000. The coefficients on the index interaction terms represent differences in outcome response to increased provider supply between states that are fully supportive of NP and PA independent practice and those whose regulatory environment is completely restrictive. For example, if additional NP supply only results in greater utilization if NPs are permitted wide autonomy to practice, then this term will be positive and significant.
To estimate effects on the prices of basic health care services, I estimate a similar regression model using OLS:
1 2
mijt jt jt Q mijt x ijt z jt j t mijt
y =βNP +β PA +β Q +β X +β Z +δ +δ +ε (2)
where 𝑦𝑚𝑖𝑗𝑡is the log price of visit m made by individual i in county j at time t. In addition to the control variables used in (1), some specifications also include visit-specific characteristics,
𝑄𝑚𝑖𝑗𝑡, such as indicators for specific treatments or services provided during the visit, fixed effects for conditions (if any) associated with the visit, or the predicted likelihood that a visit is primary care. 𝜀𝑚𝑖𝑗𝑡 is an error term that is assumed to be uncorrelated with all the right hand side variables. In order to permit the price response to additional supply to vary between types of visits and with the state practice environment, I also interact provider supply with predicted likelihood of primary care, the state practice index, and with both simultaneously. If NPs and PAs have a greater (negative) price effect on visits that are the most substitutable for primary
care physicians or in states permitting greater autonomy of NPs and PAs, then the coefficients on these interactions should be negative.
To examine the direct effect of occupational regulations on outcomes, rather than the indirect effect that operates through provider supply, I also estimate OLS regressions of the form:
1 2
ijt st st x ijt z jt j t ijt
y =βNPLaw +β PALaw +β X +β Z +δ +δ +ε (3)
where most variables are defined as before, but now 𝑁𝑃𝐿𝑎𝑤𝑠𝑡(𝑃𝐴𝐿𝑎𝑤𝑠𝑡) is an indicator variable that equals one if state s permits NPs (PAs) to prescribe any controlled substances in year t. Identification of the parameters of interest now comes from changes in laws within states over time. Since changes in laws may also correlate with provider supply growth, some specifications also include the log of the number of NPs and PAs per 100,000 population in area j at time t.
B. Identification challenges with fixed effects specification
The first concern with the OLS approach described above is that changes in NP or PA concentration or laws may be correlated with other determinants of health care outcomes, causing biased estimates ofβ. Table 1 identifies the observable factors that predict variation in provider supply across areas and over time. Estimates are from population-weighted regressions of county-level provider supply on fixed county characteristics and these characteristics
interacted with time (linearly). Cross-sectional variation in provider supply is much more highly correlated with observable county characteristics than provider growth. In fact, several of the strongest predictors of the level of provider density (number of MDs, HMO penetration, and industry mix) are not predictive of NP or PA supply growth. Nonetheless, provider growth did occur differentially between areas with different demographics and economic circumstances. For this reason, the preferred specification includes separate linear trends for each state and
linear trends that vary with these time-invariant county characteristics. These linear trends eliminate bias resulting from areas with, for example, high poverty rates (or HMO penetration) having lower utilization growth and lower NP growth, for example. It should be noted that time-invariant area characteristics – such as the high concentration of NPs and PAs in rural areas which may have low prices – are not a source of bias when county fixed effects are included in the model, though this basic source of bias is present is most of the previous work discussed earlier. More problematic for my approach is if changes in provider supply or laws are correlated with unobservable, time-varying factors. For example, increasing demand may increase prices and also attract more practitioners. This would cause a positive bias in the estimated effect of provider supply on price, which may even suggest that expanded supply increases price. Alternatively, increasing demand may lead to higher utilization and also attract more
practitioners, creating a positive bias in the estimated effect of provider supply on access. The fixed effects model addresses this source of bias in so far as the presence of observed medical conditions (which is controlled for) is associated with increased demand, but I am not able to rule out the contribution of changes in unobserved demand factors.
A second concern is measurement error in the measures of provider supply. Some research suggests that county may not be the best geographic level to measure the number of health care providers (Rosenthal, Zaslavsky, and Newhouse, 2005). Classical measurement error will attenuate estimates towards zero. The main results are robust to using workforce supply and fixed effects at the Health Service Area level (an aggregation of counties in the same state) rather than county. Unfortunately the MEPS does not contain geographic information below the county level, so I am unable to explore more localized measures of provider availability.
A third concern relates to the possible endogeneity of NP and PA practice autonomy in specifications that interact provider supply with practice indices. These models assume that NP and PA practice indices are uncorrelated with other determinants of the responsiveness of demand to provider supply. This assumption would be violated if states with the most pent up demand (which are likely to be highly responsive to provider supply) are more likely to grant autonomy to NPs and PAs. I am unable to test for pent-up demand, but this source of bias would cause me to overstate the effect of NP and PA autonomy on responsiveness to supply.
C. Instrumental variables specification
I also exploit cross-sectional variation in 𝑁𝑃𝑗𝑡and 𝑃𝐴𝑗𝑡 induced by proximity to historical relevant training infrastructure in a two stage least squares (2SLS) framework. Specifically, I instrument for 𝑁𝑃𝑗𝑡 and 𝑃𝐴𝑗𝑡 using the number of bachelor’s RN programs in the county in 1963 and the number of PA programs in the county in 1975 per 100,000 current population as
excluded instruments. Two conditions must hold for 2SLS to provide consistent estimates of 𝛽1 and 𝛽2. First, the excluded instruments must affect provider supply (the “relevance” condition), which is testable and discussed later. Second, provider supply must be the only channel through which the instruments affect (or are correlated with) the outcomes (the “exclusion” assumption). While not testable, I argue that this assumption is plausible in this setting. A bachelor’s RN degree is a prerequisite for NP training, though most RN training programs only granted diplomas in the early 1960s and subsequent demand for nurses was primarily met through Associates degree programs. While the demand for healthcare may be correlated with the presence of any RN training program, there is little reason to believe that it should be correlated with the specific type of RN training program given that graduates of all programs take the same licensure test and jobs upon graduation. However, among areas with sufficient demand to
warrant RN training programs, only those with bachelors’ programs were equipping their nurses with the prerequisite credential to become nurse practitioners decades later. The PA instrument is analogous to comparing counties that were the earliest to train PAs with other counties, since the first wave of PA programs were nationally certified in the early 1970’s. The first program was started at Duke University in North Carolina in the 1960s as a means to integrate returning navy corpsman with medical experience into the civilian healthcare system. The 2SLS analysis also controls for state and year fixed effects, individual characteristics, and a host of time-invariant county characteristics. In some specifications I also control for the contemporaneous supply of primary care physicians and the presence of Associates and diploma RN programs in the county in 1963. Suggestive evidence on the exclusion assumption can also be found in the
cross-instrument effects (e.g. association between bachelors RN program density and PA supply). Strong cross-instrument effects could suggest that healthcare demand was correlated with both RN and PA school location and provider supply, violating the exclusion assumption.
The 2SLS specification exploits a completely different source of variation in provider supply than the fixed effects specification and also possibly eliminates attenuation bias caused by provider supply measurement error.
V. Fixed Effects Results A. Utilization
Table 2 examines the extensive margin of utilization. Though provider supply is weakly positively correlated with the likelihood of having any office-based visits, this correlation is diminished (and loses statistical significance) once individual characteristics, fixed county characteristics, and linear time trends are controlled for.18 The point estimates from the preferred specification (2) suggests that a 10% increase in the NP to population ratio is associated with a
0.03 percentage point decrease in the fraction of individuals having at least one office-based provider visit. The precision of the estimates permits me to rule out positive effects greater than 0.19 percentage points associated with a 10% increase in NP density (i.e. moving from the sample average of 62.3% to 62.49%). The point estimate for PA density is also very small and insignificant. Column (3) permits the utilization response to differ by the state practice
environment. Though the positive point estimates on these interactions do suggest that utilization is more (positively) responsive to provider supply in more NP and PA-friendly states, neither interaction is significant at the 5% level and I cannot reject that the response is equal to zero even in the most favorable practice environments. Since we may expect that additional providers have a greater impact for certain patient segments, the next eight columns estimate the preferred model separately by type of insurance coverage. No clear patterns emerge. For most of these subpopulations, the conditional correlation between provider supply and having any office visits is small and statistically insignificant. Coefficients on the interactions with practice environment are also insignificant.
Table 3 examines the intensive margin. On average across all areas, the point estimates are economically small and statistically insignificant once individual characteristics, county fixed effects, and linear time trends are controlled for. For total visits, the point estimates imply an elasticity of office-based visits with respect to provider supply of 0.001 for NPs and 0.03 for PAs. Column (2) permits provider supply to have a different relationship with utilization in more or less favorable state practice environments. The estimates imply an elasticity of 0.08 for both NP and PA supply in states with the most favorable environments. Columns (3) – (6) examine the determinants of primary care visits. This variable is constructed by summing the predicted likelihood that each visit is a primary care visit across all visits made by each individual. The
estimated total number of non-primary care visits, analyzed in columns (7) and (8), is
constructed similarly. Across all areas, the average response of both types of visit to provider supply is minimal. However, the number of primary care visits is much more responsive to NP supply in states that permit NPs greater autonomy than those with restrictive environments (columns (4) and (6)). In results not reported here, I find no evidence that provider supply is more important for the two groups most likely to face access problems (Medicaid recipients and the uninsured), though practice environment estimates are imprecise.19 Table 4 presents
estimates that separate the practice index into its three components: reimbursement policies, legal restrictions on practice, and prescriptive authority. Results suggest that prescriptive authority and possibly legal standing (though this is imprecise), but not reimbursement parity, are the components of the NP index that explain its importance to the interactive effect with NP supply.
Estimates suggest that provider concentration – whether NPs or PAs – has minimal impact on utilization (both extensive and intensive margin) once time-invariant area
characteristics and linear time trends are controlled for. The estimates are sufficiently precise that I can rule out increases in the likelihood of having at least one visit of 0.19 (0.28) percentage points associated with a 10% increase in NP (PA) supply and an elasticity of 0.03 (0.08) on the intensive utilization margin. However, utilization does appear to be more responsive to NP supply changes in states that permit these non-physician clinicians greater autonomy, particularly in the realm of prescriptive authority.
B. Prices
Theory predicts that an expansion of the supply and autonomy of NPs and PAs should reduce prices in the market for services for which they provide the greatest substitute for physician care.
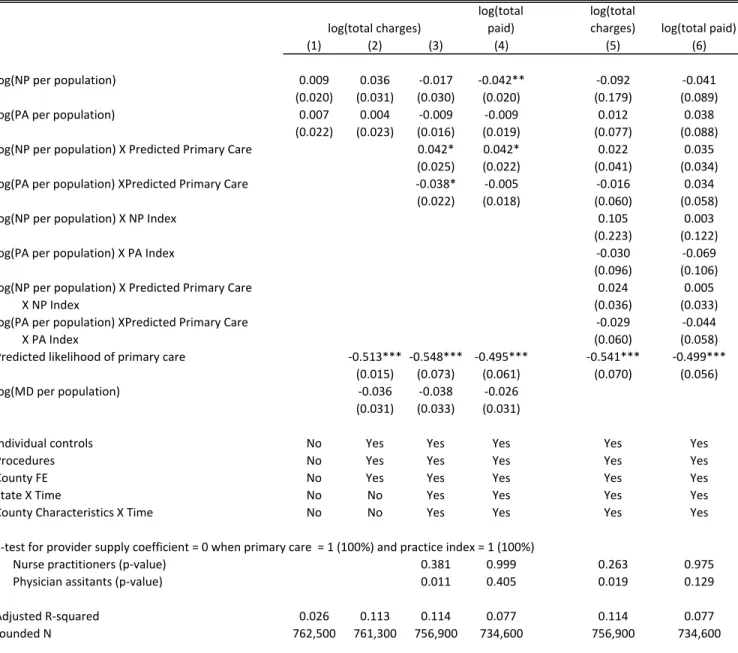
Table 5 reports estimates of equation (2) where log of visit price is the dependent variable. The table presents two alternative measures of price: total charges for the visit and total amount paid by all sources (different types of insurance, out-of-pocket, etc.). Since amount paid is largely dictated by reimbursement rates set by Medicare and other insurers, it may not take competitive pressures into account, limiting observed price responsiveness. On the other hand, charges are an imperfect measure of resource-allocating price since they are not fully paid. Encouragingly, results are qualitatively similar using either measure of price.
Visit prices and provider supply are very weakly positively correlated in the raw data (column 1). However, if NPs and PAs have expanded in areas with rising demand for care due to increased health needs, then this could create a positive omitted variable bias between visit prices and NP or PA concentration. Column (2) controls for individual characteristics, indicators for 20 different treatments or procedures performed during the visit, and the estimated likelihood that the visit is to a primary care provider, based on person demographics, the type of visit, and associated conditions. The estimates suggest that primary care visits are predicted to cost 40% less than visits that can only be performed by specialists. This control has little effect on the estimated price elasticities, which remain small and insignificant.20
Since many visits are to specialist physicians, we may not expect there to be large price impacts of greater availability of nurse practitioners and physician assistants, who work largely in primary care. We would expect to see the largest price effects on visits for which NP and PA care is the most substitutable for physician care. Specification (3) explores this possibility by interacting NP and PA supply with the estimated likelihood that a given visit is primary care. Negative point estimates on these interactions would suggest that the prices respond more (negatively) to expanded provider supply for visits that are more likely to be to a primary care
(rather than specialist) provider. This pattern is not seen in the data. Greater NP supply is associated with a positive price change for visits that are likely to be primary care, compared to an insignificant zero or negative change for non-primary care visits. Point estimates for PA supply are indeed negative and approaching statistical significance in some specifications, though still very small. The pattern is unchanged regardless of whether total charges or total amount paid (column 4) is used as the measure of price. Figure 4 applies this approach even more flexibly. I estimate equation (2) separately for twenty quantiles of predicted probability of primary care. There is no obvious relationship between the estimated price elasticity and
predicted likelihood of being a primary care visit. At all ranges of visit types, from general check-ups (high likelihood of being primary care) to cancer diagnosis (low likelihood), the estimated price elasticity bounces around zero. This is true both for NP and PA supply and regardless of how price is measured. The final two columns of Table 5 permit the price elasticity to vary with predicted likelihood of being primary care, state practice environment index, and their interaction. If there is to be any significant price effect, we may expect to find it among visits for which provider type is highly substitutable and state laws are the least restrictive. Even for this specific group of visits, the estimated price elasticity is wrong-signed or very small: +0.06 for NP supply and - 0.06 for PA supply, though the latter is statistically significant. Overall, it appears that provider supply has minimal impact on visit price, even for services expected to be easily shifted from physician to non-physician care.
C. Expenditure on office-based visits
Table 6 examines the impact of NP and PA supply on health care expenditure for total office-based provider visits.21 Expenditure tends to be positively (though insignificantly) correlated with provider supply, even after the preferred set of controls (individual characteristics,
physician supply, linear time trends, county fixed effects) are included. Across all individuals and areas, the point estimates imply an (insignificant) 0.032% increase in expenditure associated with a 1% increase in PA supply and an (insignificant) 0.003% increase associated with a
similarly-sized expansion of NP supply. Point estimates of expenditure elasticities are largest for NP supply and Medicaid recipients and PA supply and the uninsured. Though most of the practice index interactions are positive, none of the elasticities implied by the point estimates for the most NP- and PA-favorable states are significant at conventional levels.
D. Qualitative measures of access and preventive care
Even if broad measures of utilization and expenditure are unresponsive to expanded NP and PA supply and scope-of-practice, it is possible that these changes alter individuals’ interaction with the health system or the nature of the care they receive. Table 7 presents OLS estimates of equation (1) with an indicator for having a usual source of care as the dependent variable. Having a “usual source of care” is the one measure of access that was consistently assessed in the MEPS through the entire analysis period. Twenty-two percent of my sample does not have a usual source of care. When only year fixed effects are controlled for, a greater number of
providers of either type is associated with an increased likelihood of have having a usual source of care. However, this pattern seems to be driven by county and individual characteristics that differ across areas, since this relationship is greatly diminished with controls. Specification (2) controls for changes in population characteristics that may be correlated both with provider concentration and access, fixed county characteristics, and linear time trends by state and county characteristic. The point estimates are also small in magnitude: I can rule out an increase in the likelihood of having a usual source of care of 0.3 percentage points associated with a 10%
provider supply across areas with different practice environments and for patients with different types of insurance. The interactions with practice indices are insignificant overall, as are the direct and interactive effects of provider supply for all insurance groups. The point estimates are also fairly small – a ten percent increase in the NP or PA to population ratio is associated with a statistically insignificant -0.06 to +0.46 percentage point increase in the rate of having a usual source of care, depending on insurance coverage.
Table 8 examines the relationship between provider supply and several important preventive care outcomes. Greater availability of non-physician clinicians, particularly nurse practitioners, may expand the use of preventive care services both due to greater provider availability to perform low-value (e.g. poorly reimbursed) services and also because nurse practitioners’ training emphasize prevention. Estimates suggest that a greater supply of non-physician
clinicians is not associated with a greater likelihood of getting a flu shot, checking blood pressure or cholesterol, having a breast exam, or having a pap smear in the past 12 months. Interactions between provider supply and practice environment are also insignificant.
VI. Instrumental variables results
The preceding analysis exploited changes in nurse practitioner and physician assistant supply within areas over time beyond what would be predicted by physician supply and time trends. To address the possibility of omitted variable bias due to time-varying area characteristics that are correlated with both supply and outcomes and measurement error attenuation bias, I also exploit cross-sectional variation in provider supply induced by proximity to the historical relevant training infrastructure in an instrumental variables framework. As instruments, I use the number of bachelor’s RN programs in the county in 1963 and the number of PA programs in the county in 1975 per 100,000 current population. Table B6 in the appendix presents the first stage
relationships between provider supply and these instruments. All specifications include state and year fixed effects, individual characteristics, and a host of time-invariant county characteristics. I find that the two instruments have a strong relationship with provider supply as expected: greater bachelors RN program density in the 1960s is associated with greater NP supply (but not PA supply) today, while the opposite is true for the density of PA schools in 1975. The presence of other types of nursing schools is negatively associated with NP supply (since AA-trained nurses cannot directly enter NP programs) and has no association with PA supply. It is reassuring that cross-instrument effects are minimal (e.g. bachelors RN program density does not correlate with PA supply), which would be the case if latent healthcare demand was correlated with both RN and PA school location and provider supply. Specification (1) does not control for
contemporaneous physician supply or the presence of other types of nursing schools. The F-statistics on the excluded instruments are near or above 10 in the first stage. Controlling for physician supply (specification 2) weakens the relationship somewhat and reduces the F-statistics such that 2SLS estimates may be biased due to weak instruments, though physician supply may control for unobserved determinants of demand that happen to correlate with training infrastructure (making the exclusion assumption more plausible). Given the previous fixed effect analysis which showed a very modest relationship between physician supply and outcomes, I view specification (1) as preferable, though the results are similar using other specifications.22
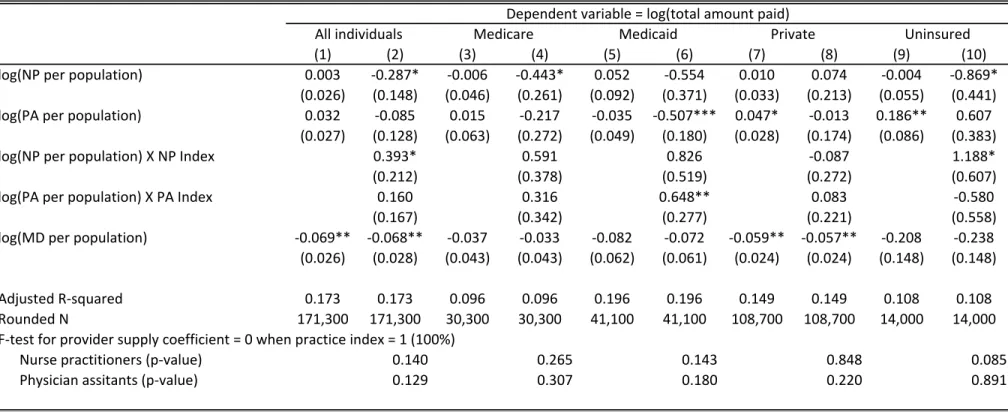
Tables 9 and 10 report 2SLS estimates of the effect of NP and PA supply on person-level and visit-level outcomes, respectively. As a basis of comparison, Panel A in each table reports estimates from the preferred county fixed effects specifications. For almost all person-level outcomes (Table 9), the 2SLS point estimates for NP supply are larger (and more positive) than for the fixed effects estimates, though they are never significantly different from zero or from the
fixed effects estimates. As is typical, the 2SLS estimates are less precise than the base OLS estimates. For PA supply, the point 2SLS point estimates are typically negative and never significantly different from zero or from the fixed effects estimates. Table 10 presents 2SLS estimates of the effect of NP and PA supply on visit prices. The 2SLS results are very consistent with the fixed effects estimates: provider supply has minimal effect on visit prices overall, though the 2SLS estimates are much less precise. Columns (2) – (6) and (8) – (12) present estimates separately for visits that have a different likelihood of being made to a primary care provider, based on individual and visit-level characteristics. Even for visits that NPs and PAs would be expected to be the most substitutable for physician care, there is no evidence of price impacts of greater NP or PA supply.
VII. Direct impact of regulation
This paper is primarily concerned with how the regulatory environment moderates the effect of increases in NP and PA supply on various outcomes. Though provider supply has a relatively weak association with utilization and access, I do find that provider supply is more positively correlated with utilization in states that permit NPs to be more substitutable for physicians. That is, there is some evidence that this form of occupational regulation weakly impacts the healthcare market by moderating the effects of provider supply. It is also possible that the regulatory
environment has a direct impact on these same outcomes. The previous analysis controlled for the direct effect of states’ regulatory environment (at a point in time) through the inclusion of county fixed effects. In order to quantify the direct impact of the regulatory environment while still controlling for cross-sectional differences between areas that may be correlated with regulation and health care outcomes, I exploit changes in one component of regulation – prescriptive authority – within states over time.
Table 11 presents estimates of models that regress health care utilization, access, prices, and expenditure on time-varying indicators for whether NPs and PAs are permitted to write
prescriptions for controlled substances, controlling for state fixed effects and individual
characteristics. Since information about prescriptive authority is available for all states and years, these models use nearly the entire sample of individuals in the MEPS. The even rows
additionally control separately for the log of number of NPs, PAs, and primary care physicians, which reduces bias caused by the correlation between provider supply and laws, but at the cost of reduced sample size. When examining price of individual visits, these models also include
controls for all procedures and treatments provided during the visit and indicators for one of 600 conditions associated with the visit (including none).
I find that granting NPs the ability to prescribe has a modest impact on the intensive utilization margin: NP prescriptive authority is associated with 3% more visits conditional on having at least one. For PAs, the opposite is true: granting PAs the ability to prescribe is actually associated with 5% fewer visits conditional on having at least one. Expansive NP prescriptive authority is positively associated with increases in the likelihood of having at least one visit, but this is statistically insignificant.NP prescriptive authority is modestly associated with greater visit charges, though this does not translate into greater prices paid. PA prescriptive authority is not associated with changes in visit prices by either measure. Thus, permitting NPs and PAs to do more also does not appear to create price pressure on office-based visits. Given the minimal price impact of the regulation, the patterns for expenditure follow those for utilization pretty closely. There is a positive, though modest, association between NP prescriptive authority and
expenditure (both on the extensive and intensive margin). Mirroring the negative relationship seen for utilization, PA prescriptive authority is negatively related to expenditure on the
extensive margin. Together these results suggest that changes in NP and PA prescriptive
authority – one key component of the overall regulatory environment – have only modest impact on the market for health care services.
VIII. Discussion and Conclusion
This paper is the first to assess the output market effects of the enormous increase in supply of nurse practitioners and physician assistants, the interaction of this growth with occupational restrictions, and an expansion of these providers’ scope-of-practice. My findings suggest that, across all areas, greater supply of NPs and PAs has had minimal impact on utilization, access, preventative health services, and prices. However, primary care utilization is moderately responsive to NP provider supply in areas that grant non-physician clinicians the greatest autonomy to practice independently. I find no evidence that increases in provider supply
decreases prices, even for visits most likely to be affected by NPs and PAs: primary care visits in states with a favorable regulatory environment for NP and PAs. I also find that expansions in prescriptive authority for NPs are associated with modest but greater utilization, though the opposite is true for PAs. Neither change appears to reduce visit prices, so health expenditure patterns mirror utilization: greater NP prescriptive authority increases expenditure while the comparable change for PAs decreases it.
The results of this paper suggest that even considerable changes in the nature of who is providing health care can result in only modest changes in important outcomes such as access, overall utilization, prices, and expenditure. There is also suggestive evidence that occupational regulation may play some role in input substitutability and thus moderate the relationship between input availability and the aggregate supply of primary health care. An important implication is that licensing laws – which determine the division of labor and thus how labor
inputs translate to services – may be as important as policies that expand supply directly. My results call for a reconsideration of the nature of federal healthcare workforce efforts, which have mostly focused on supply expansion rather than altering how existing labor is used.
Why a greater number of providers has not significantly altered the healthcare market remains an unanswered question. One possibility is that existing providers – physicians, NPs, and PAs – reduce their work hours in response to provider expansion, limiting the effective supply increase to less than the number of providers would suggest. There is evidence that physicians reduce the number of hours spent on patient care in response to public health insurance expansions (Garthwaite, 2012), so it is reasonable to expect a similar response to a greater number of providers. Another possibility is that the number of providers may be less important than the organizational structure in which their services are delivered. Community health clinics (CHCs) have been shown to have substantial effects on healthcare access and health outcomes (Bailey and Goodman-Bacon, 2012), but isolated provider supply expansions absent the outreach and other services provided by CHCs may be less effective. Finally, it is possible that patients’ interactions with the healthcare system have been altered in ways that that are not easily captured by overall measures of utilization and prices. For instance, greater NP and PA supply may facilitate the provision of team-based care and task specialization that improves the quality of and patients’ satisfaction with care without altering the overarching patterns of utilization. Changes in task specialization is one explanation proposed for the modest economic impacts observed for immigration (Peri and Sparber, 2009). All of these are fruitful areas for further exploration, with important implications for the design and implementation of healthcare workforce policy.
References
Adams, A. Frank, Robert B. Ekelund Jr., John D. Jackson, 2003.”Occupational Licensing of a Credence Good: The Regulation of Midwifery” Southern Economic Journal, Vol. 69, No. 3: pp. 659-675.
American Association of Medical Colleges, 2010. Health Care Reform and the Health
Workforce: Workforce Provisions Included in the Patient Protection and Affordable Care Act.
https://www.aamc.org/download/142078/data/health_workforce_provisions_and_health_care_ref orm.pdf. Accessed May 26, 2010.
Baicker, Katherine and Amitabh Chandra, 2004a. "The Productivity of Physician Specialization: Evidence from the Medicare Program." American Economic Review, Papers and Proceedings 93(2): 357-361.
Baicker, Katherine and Amitabh Chandra, 2004b. "Medicare Spending, the Physician Workforce, and Beneficiaries Quality of Care." Health Affairs, April 2004: 184-197.
Bailey, Martha and Andrew Goodman-Bacon, 2012. The War on Poverty’s Experiment in Public Medicine: Community Health Centers and the Mortality of Older Americans. Unpublished manuscript, University of Michigan.
Becker, Gary, S. and Kevin M. Murphy, 1992. “The Division of Labor, Coordination Costs, and Knowledge.” Quarterly Journal of Economics, 107 (4): 1137-1160.
Blumenthal, David, 2004. “New Steam from an Old Cauldron – The Physician Supply Debate.” The New England Journal of Medicine, 350 (17): 1780-1787.
Chang, Chiang-Hua, Therese A. Stukel, Ann Barry Flood, and David C. Goodman, 2011. “Primary Care Physician Workforce and Medicare Beneficiaries’ Health Outcomes,” Journal of the American Medical Association, Vol. 305 (20): 2096-2105.
Chernew, Michael E., Lindsay Sabik, Amitabh Chandra, and Joseph P. Newhouse, 2009. “Would Having More Primary Care Doctors Cut Health Spending Growth?” Health Affairs, Vol 28 (5): 1327-1335.
Continelli, Tracey, Sandra McGinnis, and Timothy Holmes, 2010. “The effect of local primary care physician supply on the utilization of preventive health services in the United States.” Health and Place 16 (2010): 942-951.
Cooper, Richard, Tim Henderson, Craig Dietrich, 1998. "Roles of Nonphysician Clinicians as Autonomous Providers of Care." Journal of the American Medical Association, Vol 280(9): 795-802.
Cooper, Richard, Prakash Laud, and Craig Dietrich, 1998. "Current and Projected Workforce of Nonphysician Clinicians." Journal of the American Medical Association, Vol 280 (9): 788-794.
Druss, Benjamin, Steven Marcus, Mark Olfson, Terri Tanielian, and Harold Alan Pincus, 2003. "Trends in Care by Nonphysician Clinicians in the United States," The New England Journal of Medicine, Vol 348 (2): 130-137.
Dueker, Michael, Ada Jacox, David Kalist, and Stephen Spurr, 2005. "The Practice Boundaries of Advanced Practice Nurses: An Economic and Legal Analysis." Journal of Regulatory Economics, 27(3): 309-329.
Everett, Christine, Jessica Schumacher, Alexandra Wright, and Maureen Smith, 2009. Physician Assistants and Nurse Practitioners as Usual Source of Care. Journal of Rural Health, 25 (4): 407-414.
Fairman, J. 2008. Making Room in the Clinic; Nurse Practitioners and the Evolution of Modern Health Care. New Brunswick, NJ: Rutgers University Press.
Flexner, Abraham (1910), Medical Education in the United States and Canada: A Report to the Carnegie Foundation for the Advancement of Teaching, Bulletin No. 4., New York City: The Carnegie Foundation for the Advancement of Teaching, pp. 346, retrieved June 27, 2011. Garthwaite, Craig, 2012. “The Doctor Might See You Now: The Supply Side Effects of Public Health Insurance Expansions.” forthcoming in American Economic Journal: Economic Policy. Grumbach, Kevin, L. Gary Hart, Elizabeth Mertz, Janet Coffman, and Lorella Palazzo, 2003. "Who is Caring for the Underserved? A Comparison of Primary Care Physicians and
Nonphysician Clinicians in California and Washington." Annals of Family Medicine, Volume 1(2): 97-104.
Grumbach, Kevin, Karen Vranizan, and Andrew Bindman, 1997. “Physician Supply and Access to Care in Urban Communities.” Health Affairs, 16 (1): 71-86.
Guttman, Astrid, Scott Shipman, Kelvin Lam, David Goodman, and Therese Stukel, 2010. “Primary Care Physician Supply and Children’s Health Care Use, Access, and Outcomes: Findings from Canada.” Pediatrics 125 (6): 1119-1126.
Hooker, Roderick and Linda Berlin, 2002. "Trends in the Supply of Physician Assistants and Nurse Practitioners in the United States." Health Affairs, Vol 21(5): 174-181.
Hooker, Roderick and Linda McCaig, 2001. "Use of Physician Assistants and Nurse Practitioners in Primary Care, 1995-1999." Health Affairs, Vol 20 (4): 231-238.
Horrocks, Sue, Elizabeth Anderson, and Chris Salisbury, 2002. "Systematic review of whether nurse practitioners working in primary care can provide equivalent care to doctors." British Medical Journal, Volume 324(6): 819-823.
Hotz, V. Joseph and Xiao, Mo, 2011. The Impact of Regulations on the Supply and Quality of Care in Child Care Markets, American Economic Review, forthcoming.
Institute of Medicine. 2011. The Future of Nursing: Leading Change, Advancing Health. Washington, DC: The National Academies Press.
Jones, Andrew M., 2000. “Health econometrics.” In: Culyer, A., Newhouse, J. (Eds.), Handbook of Health Economics. Elsevier, Amsterdam.
Kaiser Commission on Medicaid and the Uninsured, 2011. Improving Access to Adult Primary Care in Medicaid: Exploring the Potential Role of Nurse Practitioners and Physician Assistants. Issue Paper. March 2011.
Kalist, David and Stephen Spurr, 2004. "The Effect of State Laws on the Supply of Advanced Practice Nurses," International Journal of Health Care Finance and Economics, 4: 271--281. Kleiner, Morris M, 2000. “Occupational Licensing,” Journal of Economic Perspectives, 14(4):189-202.
Kleiner, Morris M, 2006. Licensing Occupations: Enhancing Quality or Restricting Competition? Kalamazoo, MI: W.E. Upjohn Institute for Employment Research.
Kleiner, Morris and Kudrle, Robert, 2000. Does Regulation Affect Economic Outcomes? The Case of Dentistry , Journal of Law and Economics, Vol. 63, No. 2, October 2000, pp. 547-582. Kleiner, Morris M, Allison Marier, Kyoung Won Park, and Coady Wing, 2011. “Relaxing Occupational Licensing Requirements: Analyzing Wages and Prices for a Medical Service.” Unpublished working paper.
Kleiner, Morris M. and Kyoung Won Park, 2010. “Battles Among Licensed Occupations: Analyzing Government Regulations on Labor Market Outcomes for Dentists and Hygienists” NBER Working Paper No. 16560.
Laditka, James, Sarah Laditka, and Janice Probst, 2005. “More May be Better: Evidence of a Negative Relationship between Physician Supply and Hospitalization for Ambulatory Care Sensitive Conditions” Health Services Research 40(4): 1148-1166.
Larson EH, Palazzo L, Berkowitz B, Pirani MJ, Hart LG., 2003. "The contribution of nurse practitioners and physician assistants to generalist care in Washington State." Health Serv Res. 2003;38(4):1033--1050.
Laurant, M, Reeves D, Hermens R, Braspenning J, Grol R, Sibbald B., 2004. Substitution of doctors by nurses in primary care. Cochrane Database of Systemic Reviews 2004, Issue 4. Art. No.: CD001271.
Leland, Hayne E., 1979. “Quacks, Lemons, and Licensing: A Theory of Minimum Quality Standards.” The Journal of Political Economy, Vol. 87, No. 6 (Dec., 1979), pp. 1328-1346 Lenz et al, 2004. "Primary Care Outcomes in Patients Treated by Nurse Practitioners or Physicians: Two-Year Follow-up" Medical Care Research and Review, Vol 61 (3).
Morgan, Perri A., Justine Strand, Truls Ostbye, and Mark A. Albenese, 2007. “Missing in Action: Care by Physician Assistants and Nurse Practitioners in National Health Surveys.” Health Services Research, 42 (5): 2022-2037.
Mundinger et al , 2000. "Primary Care Outcomes in Patients Treated by Nurse Practitioners or Physicians: A Randomized Trial", JAMA Vol 283 (1) January 5, 2000.
Pauly, Mark and Mark Satterthwaite, 1981. The Pricing of Primary Care Physicians Services: A Test of the Role of Consumer Information.” The Bell Journal of Economics, 12 (2): 488-506. Peri, Giovanni and Chad Sparber, 2009. “Task Specialization, Immigration, and Wages” American Economic Journal: Applied Economics, 1 (3): 135-169.
Rosenthal, Meredith, Alan Zaslavsky, and Joseph Newhouse, 2005. “The Geographic Distribution of Physicians Revisited.” Health Services Research 40(6, Part I): 1931-1952. Sass, Tim R. and Mark W. Nichols, 1996. “Scope-of-Practice Regulation: Physician Control and the Wages of Non-Physician Health Care Professionals,” Journal of Regulatory Economics, 9:61-81.
Schaumans, C. and Verboven, F. (2008), Entry and regulation: evidence from health care professions. The RAND Journal of Economics, 39: 949–972
Scheffler, R.M, 2008. Is There a Doctor in the House? Market Signals and the Physician Supply Cycle. Stanford University Press: Palo Alto.
Scheffler, R.M., N.J. Waitzman, and J.M. Hillman, 1996. "The Productivity of Physician Assistants and Nurse Practitioners and Health Workforce Polcy in the Era of Managed Health Care," Journal of Allied Health 25(3): 207-217.
Sekscenski, Edward S., Stephanie Sansom, Carol Bazell, Marla E. Salmon, and Fitzhugh Mullan, 1994. "State Practice Environments and the Supply of Physician Assistants, Nurse Practitioners, and Certified Nurse-Midwives", The New England Journal of Medicine Vol 331(19):1266-1271. Shaked, Avner and John Sutton, 1981. “The Self-Regulating Profession.” Review of Economic Studies, 48, 217-234.
Shapiro, Carl, 1986. ‘Investment, moral hazard and occupational licensing’. Review of Economic Studies, 53: 843–62.
US Department of Health and Human Services, Health Resources and Service Administration, 2004. A Comparison of Changes in the Professional Practice of Nurse Practitioners, Physician Assistants, and Certified Nurse Midwives: 1992 and 2000. (February).
US Department of Health and Human Services, Medicare Learning Network, 2011. Medicare Information for Advanced Practice Registered Nurses, Anesthesiologist Assistants, and Physician Assistants. September, 2011.
US Government Accountability Office, 2008. "Primary Care Professionals: Recent Supply Trends, Projections, and Valuation of Services."
White, William, 1978. “The Impact of Occupational Licensure of Clinical Laboratory Personnel.” The Journal of Human Resources. 13 (1): 91-102.
Footnotes
∗ The dataset used in this paper was constructed in collaboration with Dr. Deborah Sampson of the Boston College School of Nursing. Helpful feedback was also provided by seminar
participants at the RWJ Health Policy Scholars 2009 and 2010 Annual Meetings, the University of Michigan (Ford School of Public Policy, School of Public Health, Economics Department), the Upjohn Institute, the 2011 Association for Public Policy Analysis and Management Annual Meeting, the University of Chicago, and the 2012 American Society of Health Economists meeting. I am gra