RESEARCH
Clinicopathologic implication of PD-L1
and phosphorylated STAT3 expression in diffuse
large B cell lymphoma
Hyun Jung Kwon
1, Jeong Mi Yang
1, Jeong‑Ok Lee
2, Jong Seok Lee
2and Jin Ho Paik
1*Abstract
Background: Antitumor immune response of programmed cell death ligand (PD‑L1) has shown clinical value not only in Hodgkin lymphoma and EBV‑associated lymphomas but also in EBV‑negative diffuse large B cell lymphoma (DLBCL) of non‑germinal center B cell‑like (non‑GCB) subtype. Signal transducer and activator of transcription 3 (STAT3) is known to induce PD‑L1 in immune cells and its activated form, phosphorylated STAT3 (pSTAT3), is also frequently expressed in non‑GCB DLBCL. Herein, we investigated associations between PD‑L1 expression/gene altera‑ tion, pSTAT3 expression and clinicopathologic variables in EBV‑negative DLBCL.
Methods: In 107 cases of DLBCLs with non‑GCB subtype (67%; 72/107), GCB subtype (25%; 27/107) and unclassifia‑ ble cases (8%; 8/107), we performed PD‑L1 and pSTAT3 immunohistochemistry and fluorescence in situ hybridization for PD‑L1 gene translocation and copy number gain/amplification.
Results: PD‑L1 was expressed in tumor cells (PD‑L1t) in 21% (23/107; 30% cutoff ), immune cells (PD‑L1i) in 36% (38/107; 20% cutoff ), and pSTAT3 in tumor nuclei in 41% (44/107; 40% cutoff ). PD‑L1 gene alteration was observed in 10% (10/102) including translocation in 6% (6/102) and copy number gain/amplification in 4% (4/102). Non‑GCB subtype was associated with PD‑L1t and pSTAT3 (p = 0.006 and p = 0.042), and tended to have PD‑L1 gene altera‑ tion (p = 0.058). Tumoral PD‑L1 expression without gene alteration (PD‑L1t+ GA−) correlated with pSTAT3‑positive tumor cell proportions (%) (p = 0.033). In survival analysis, pSTAT3 expression independently predicted shorter PFS in total cohort (p = 0.017) and R‑CHOP‑treated group (p = 0.007), and in pSTAT3‑negative R‑CHOP‑treated subset, PD‑L1 expression in immune cells (PD‑L1i) correlated with shorter PFS (p = 0.042).
Conclusions: Gene alteration and protein expression of PD‑L1 and pSTAT3 expression were closely related in DLBCL and constituted features of non‑GCB subtype. In addition to known clinical significance of pSTAT3, immune cell expression of PD‑L1 (PD‑L1i) had also clinical value in pSTAT3‑dependent manner. These findings may provide an insight into immunotherapeutic strategy and risk stratification in DLBCL patients.
Keywords: Diffuse large B cell lymphoma, PD‑L1, pSTAT3, Microenvironment, Prognosis
© The Author(s) 2018. This article is distributed under the terms of the Creative Commons Attribution 4.0 International License (http://creat iveco mmons .org/licen ses/by/4.0/), which permits unrestricted use, distribution, and reproduction in any medium, provided you give appropriate credit to the original author(s) and the source, provide a link to the Creative Commons license, and indicate if changes were made. The Creative Commons Public Domain Dedication waiver (http://creat iveco mmons .org/ publi cdoma in/zero/1.0/) applies to the data made available in this article, unless otherwise stated.
Open Access
*Correspondence: [email protected]
1 Department of Pathology, Seoul National University Bundang Hospital, Seoul National University College of Medicine, 300 Gumi‑dong, Bundang‑gu, Seongnam 463‑707, South Korea
Background
Immune escape and immune suppression has emerged as important mechanisms for the development of solid and hematologic malignancies. Research on immuno-therapy has thus opened a new era in the treatment of many malignancies. Recently, impressive advancements in the treatment of hematologic malignancies with the immune checkpoint inhibitors targeting programmed cell death-1 (PD-1) receptor and its ligand (PD-L1) lead to the approval of nivolumab and pembrolizumab by the Food and Drug Administration for the treatment of clas-sical Hodgkin lymphoma in relapsed or refractory cases.
Diffuse large B-cell lymphoma (DLBCL) is the most common type of non-Hodgkin lymphoma in adults. The 5-year overall survival reaches only 60–70% when treated with standard chemotherapy of rituximab plus cyclo-phosphamide, doxorubicin, vincristine and prednisone (R-CHOP) [1]. DLBCL is known to be heterogeneous in genetic and prognostic aspects. The subclassification of DLBCL based on cell-of-origin using the Hans algorithm proved useful in predicting prognosis as germinal center B-cell like (GCB) subtypes have better outcomes than non-GCB subtypes [2, 3].
PD-L1 research on DLBCL has found that not only tumor B-cells but also non-malignant immune cells in the microenvironment express PD-L1 [4–7]. In addi-tion, many studies have reported that non-GCB DLBCL shows higher PD-L1 expression than GCB DLBCL [5, 8, 9], and that similar to Hodgkin lymphoma, Epstein–Barr virus (EBV) infection probably plays an important role in inducing PD-L1 expression in DLBCL [4, 10, 11].
The mechanisms of PD-L1 expression in DLBCL has not been elucidated clearly. In many subtypes of lym-phoma, including classical Hodgkin lymlym-phoma, pri-mary mediastinal B-cell lymphoma and pripri-mary central nervous system lymphoma, genetic alterations such as copy-number alterations, amplification, and transloca-tion were observed on the 24.1 locus of the short arm of chromosome 9. On this locus lie the genes encoding PD-L1, PD-L2 and JAK2, resulting in overexpression of PD-L1 when such genetic alterations occur [7, 11, 12]. In DLBCL, however, only a subgroup of less than 20% has these genetic changes, most of which are primary medi-astinal large B cell lymphoma [8, 13]. Thus, other mecha-nisms are currently being investigated.
Infection by EBV upregulates PD-L1 expression in tumor cells either directly by binding to latent mem-brane protein (LMP-1) that triggers a signaling cascade involving JUN-B or indirectly by activating inflam-matory cytokines [14]. Inflammatory cytokines, rep-resented by IFN-γ and IL-10, in turn induce PD-L1
expression via the Janus kinase (JAK)/signal transducer and activator of transcription (STAT) signaling path-way in Hodgkin and non-Hodgkin lymphoma. Other mechanisms also involve the JAK/STAT signaling path-way such as inhibition of Suppressor of cytokine signal-ing-1 (SOCS-1) or microRNA miR-135a [7].
Phosphorylated STAT3 (pSTAT3), a transcription factor, is a key player of the JAK/STAT pathway that regulates cell proliferation and survival [15]. Cytoplas-mic protein STAT3 moves into the nucleus and binds to the promoter of PD-L1 gene when phosphorylated by JAK to enhance transcription [16, 17]. This process can be stimulated by LMP-1 of EBV, resulting in con-comitant overexpression of pSTAT3 with increased PD-L1 expression in nasopharyngeal carcinoma [14]. Reed-Sternberg cells stain positive for both PD-L1 and pSTAT3, suggesting an association between these two markers in lymphoma [18]. A few reports discovered association of PD-L1 and pSTAT3 expression in natu-ral killer/T cell lymphoma [17, 19], ALK-negative ana-plastic large cell lymphoma [20] and cell lines of adult T cell leukemia/lymphoma [21]. In DLBCL, pSTAT3 is overexpressed, similar to PD-L1, in non-GCB sub-type and shows higher expression than GCB subsub-types [22–28]. The association between PD-L1 and pSTAT3 in DLBCL, however, has not yet been explored.
In this study, we evaluated the protein expression of PD-L1 in terms of its potential intrinsic and extrinsic mechanism, i.e., PD-L1 gene alteration and STAT3 acti-vation, in EBV-negative DLBCLs. We also investigated the clinical significance of PD-L1/pSTAT3-related bio-markers in association with clinicopathologic param-eters and prognosis in DLBCL patients.
Methods
Patients and samples
was approved by the Institutional Review Board of Seoul National University Bundang Hospital.
Construction of tissue microarray (TMA)
Hematoxylin and eosin (H & E)-stained slides were reviewed in each case to confirm the original diag-nosis and select the most representative sections. A tissue microarray (TMA) was constructed using 2 mm-diameter cores derived from the representative areas of the formalin-fixed paraffin-embedded tissue blocks from each case and from normal tonsils for controls by SuperBioChips Laboratories (Seoul, Korea), as previ-ously described [30].
Immunohistochemical staining
TMAs were sectioned at a thickness of 4-μm and stained with Benchmark XT and Benchmark ULTRA (Roche Diagnostics) along with normal tonsil speci-mens as controls for the following antibodies (clones): anti-Bcl-2 (std32, 1:50, Dako), anti-Bcl-6 (std32, ready-to-use, Ventana), anti-CD10 (std32, ready-ready-to-use, Ventana), anti-Mum-1 (mild32, 1:150, Dako), anti-PD-L1 (E1L3N, 1:100, Cell Signaling) and anti-pSTAT3 (#9131, 1:20, Cell Signaling). Using immunochemistry results, the Hans algorithm was applied to each case as described previously [31].
Evaluation of PD‑L1 and pSTAT3 immunohistochemistry The immunohistochemistry slides were scored by two pathologists (H.J.K and J.H.P). PD-L1 was scored both in tumor B-cells and in non-malignant immune cells. PD-L1 was considered positively expressed in tumor or non-malignant immune cells if membranous stain-ing alone or membranous and cytoplasmic stainstain-ing together was present. The percentage of stained tumor B-cells and non-malignant immune cells were esti-mated in each TMA core regardless of intensity. Tumor cells were distinguished from non-malignant immune cells by histologic clues such as nuclear enlargement and atypism, followed by comprehensive interpreta-tion with other immunohistochemical markers includ-ing CD20, BCL2, BCL6, CD10 and MUM1. Since an optimal cut-off could not be determined by receiver operating characteristic (ROC) curve analysis, cases were classified by a 30% cutoff for tumor B-cells and 20% cutoff for non-malignant immune cells according to previous studies [6]. pSTAT3 expression was scored in tumor B-cells alone with cutoff value of 40%, which was set based on ROC curve analysis. In addition, the proportion (%) of pSTAT3-positive cells was digitally counted by using digital slide scanner and image ana-lyzer (3DHISTECH, Budapest, Hungary) for correla-tion analysis.
Fluorescence in situ hybridization for PD‑L1 gene
For fluorescence in situ hybridization (FISH) staining, PD-L1 break-apart probe (9p24.1) (catalog # PDL1BA-20-ORGR) and PD-L1 (orange)/chromosome 9 (green) probe set (9p24.1/9p21.33) (catalog # PDL1-CHR09-20-ORGR) were purchased from empire genomics (Buf-falo, NY). The FISH staining process was performed as previously described [32]. Briefly, after deparaffiniza-tion and dehydradeparaffiniza-tion, slides were immersed in 2 M HCl, boiled using a microwave oven in citrate buffer (pH 6.0), incubated in 1 M NaSCN for 40 min at 80 °C, immersed in a protease buffer and fixed in 10% neutral buffered formalin. After applying the DNA probe set to the slides, they were incubated in a humidified cham-ber at 83 °C for 3 min to denature the target DNA and probe, and subsequently incubated overnight at 37 °C to achieve hybridization. Following post-hybridization washing, 4,6-diamidino-2-phenylindole (DAPI) and an anti-fade compound (p-phenylenediamine) were applied to the slides as a counter-stain. An Olympus BX51TRF microscope (Olympus Corp., Tokyo, Japan) equipped with the appropriate filter sets was used to analyze the stained cells. For the interpretation of translocation and/or copy number gain/amplification, more than 200 tumor cells in non-overlapping intact nuclei were counted [17, 32]. Separation of orange and green signals in more than 15% of tumor cells were interpreted as translocation [31]. Copy number gain and amplification were defined as PD-L1 gene/chromo-some 9 ratio > 2 and > 4, respectively.
Statistical analysis
Results
Clinicopathologic characteristics
The characteristics of 107 patients with DLBCL are sum-marized on Table 1. Briefly, our cohort consisted pre-dominantly of non-GCB subtype (67%; 72/107) compared to GCB subtype (25%; 27/107) or unclassifiable cases (8%; 8/107) by Hans algorithm. The total cohort mainly included cases with good Eastern Cooperative Oncol-ogy Group performance status (ECOG PS) (< 2; 91%; 97/107), absence of B symptoms (79%; 85/107), low inter-national prognostic index (IPI; 66%; 71/107), less than 2 extranodal site involvements (76%; 81/107), absence of bone marrow involvement (79%; 84/107) and non-bulky masses (92%; 98/107). Most of the patients received R-CHOP chemotherapy (87%; 93/107). Compared to the patients with GCB subtype, the patients with non-GCB subtype frequently had elevated serum lactate dehydro-genase levels (p = 0.040). Non-GCB subtype also tended to be associated with a high IPI score (3–5; p = 0.056) and presence of B symptoms (p = 0.088), which did not reach statistical significance.
Association between clinicopathologic variables and protein expression and gene alteration of PD‑L1 and pSTAT3 expression
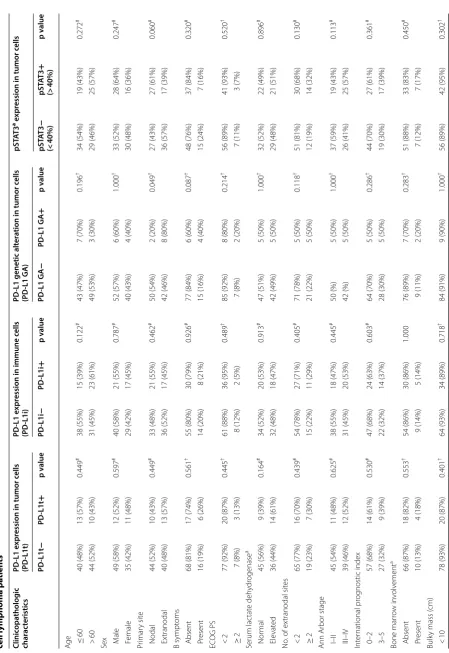
We investigated the frequencies of PD-L1 expression, PD-L1 gene alteration, i.e., translocation, copy number gain and/or amplification, and pSTAT3 expression in tumor cell nuclei according to clinicopathologic param-eters in DLBCL patients (Table 2). The PD-L1 expression was interpreted in two aspects as expression in tumor cells (PD-L1t) and expression in immune cells (PD-L1i). The prevalence of PD-L1 expression was 21% (23/107) in tumor cells and 36% (38/107) in non-malignant immune
Table 1 Clinicopathologic characteristics according
to Hans classification in diffuse large B cell lymphoma patients
Clinicopathologic
characteristics Total GCB Non‑GCB p‑value
Age
≤ 60 53 (50%) 17 (63%) 31 (43%) 0.078#
> 60 54 (50%) 10 (37%) 41 (57%) Sex
Male 61 (57%) 7 (26%) 34 (47%) 0.055#
Female 46 (43%) 20 (74%) 38 (53%) Primary site
Nodal 54 (50%) 23 (85%) 51 (71%) 0.196†
Extranodal 53 (49%) 4 (15%) 21 (29%) B symptoms
Absent 85 (79%) 25 (93%) 55 (76%) 0.088†
Present 22 (21%) 2 (7%) 17 (24%) ECOG PS
< 2 97 (91%) 26 (96%) 64 (89%) 0.437†
≥ 2 10 (9%) 1 (4%) 8 (11%) Serum lactate dehydrogenase
Normal 54 (50%) 18 (69%) 32 (46%) 0.040#
Elevated 50 (47%) 8 (31%) 38 (54%) Unknown 3 (3%)
No. of extranodal sites
< 2 81 (76%) 17 (63%) 33 (46%) 0.129#
≥ 2 26 (24%) 10 (37%) 39 (54%) Ann Arbor stage
I–II 56 (52%) 17 (63%) 35 (49%) 0.203†
III–IV 51 (48%) 10 (37%) 37 (51%) International prognostic index
0–2 71 (66%) 22 (81%) 44 (61%) 0.056#
3–5 36 (34%) 5 (19%) 28 (39%) Bone marrow involvement
Absent 84 (79%) 25 (96%) 55 (85%) 0.168†
Present 14 (13%) 1 (4%) 10 (15%) Unknown 9 (8%)
Bulky mass (cm)
< 10 98 (92%) 25 (93%) 66 (92%) > 0.999†
≥10 9 (8%) 2 (7%) 6 (8%) Hans classification
GCB 27 (25%) 27 (100%) 0 (0%) NA Non‑GCB 72 (67%) 0 (0%) 72 (100%) Unclassifiable 8 (8%)
BCL2 expression
Negative 42 (39%) 13 (50%) 24 (33%) 0.133#
Positive 65 (61%) 13 (50%) 48 (67%) BCL6 expression
Negative 60 (56%) 8 (30%) 44 (61%) 0.005#
Positive 47 (44%) 19 (70%) 28 (39%) CD10 expression
Negative 92 (86%) 12 (44%) 72 (100%) < 0.001†
NA: not applicable; ECOG PS: the Eastern Cooperative Group Performance Status; GCB: germinal center B-cell like; R-CHOP: rituximab with cyclophosphamide– doxorubicin–vincristine–prednisone, GI: gastrointestinal
p values were calculated by using Fisher’s exact test (2-sided)† or Pearson’s Chi
square test (2-sided)#
Table 1 (continued) Clinicopathologic
characteristics Total GCB Non‑GCB p‑value
Positive 15 (14%) 15 (56%) 0 (0%) MUM1 expression
Negative 41 (38%) 25 (93%) 8 (11%) < 0.001†
Positive 66 (62%) 2 (7%) 64 (89%) Treatment regimen
R‑CHOP 93 (87%) 23 (85%) 64 (89%) 0.731†
[image:4.595.306.537.99.227.2] [image:4.595.58.286.127.720.2]Table 2 C linic opa tholo gic char ac teristics ac cor ding t o pr ot ein e xpr ession and genetic alt er ation of PD -L1 and ST AT3 ac tiv ation in EB V-nega tiv
e diffuse lar
ge B
cell lymphoma pa
tien ts Clinic opa tholog ic char ac teristics PD ‑L1 e xpr
ession in tumor c
ells (PD ‑L1t) PD ‑L1 e xpr
ession in immune c
ells
(PD
‑L1i)
PD
‑L1 genetic alt
er
ation in tumor c
ells (PD ‑L1 GA ) pST AT3
a e
xpr
ession in tumor c
ells PD ‑L1t − PD ‑L1t + p v alue PD ‑L1i − PD ‑L1i + p v alue PD ‑L1 GA − PD ‑L1 GA + p v alue pST AT3 − (< 40%) pST AT3 + (> 40%) p v alue Ag
e ≤ 60
40 (48%) 13 (57%) 0.449 # 38 (55%) 15 (39%) 0.122 # 43 (47%) 7 (70%) 0.196 † 34 (54%) 19 (43%) 0.272 # > 60 44 (52%) 10 (43%) 31 (45%) 23 (61%) 49 (53%) 3 (30%) 29 (46%) 25 (57%)
Sex M
ale 49 (58%) 12 (52%) 0.597 # 40 (58%) 21 (55%) 0.787 # 52 (57%) 6 (60%) 1.000 † 33 (52%) 28 (64%) 0.247 # F emale 35 (42%) 11 (48%) 29 (42%) 17 (45%) 40 (43%) 4 (40%) 30 (48%) 16 (36%) Pr imar y sit e Nodal 44 (52%) 10 (43%) 0.449 # 33 (48%) 21 (55%) 0.462 # 50 (54%) 2 (20%) 0.049 † 27 (43%) 27 (61%) 0.060 # Ex tranodal 40 (48%) 13 (57%) 36 (52%) 17 (45%) 42 (46%) 8 (80%) 36 (57%) 17 (39%) B sympt oms Absent 68 (81%) 17 (74%) 0.561 † 55 (80%) 30 (79%) 0.926 # 77 (84%) 6 (60%) 0.087 † 48 (76%) 37 (84%) 0.320 # P resent 16 (19%) 6 (26%) 14 (20%) 8 (21%) 15 (16%) 4 (40%) 15 (24%) 7 (16%) EC OG PS < 2 77 (92%) 20 (87%) 0.445 † 61 (88%) 36 (95%) 0.489 † 85 (92%) 8 (80%) 0.214 † 56 (89%) 41 (93%) 0.520 † ≥ 2 7 (8%) 3 (13%) 8 (12%) 2 (5%) 7 (8%) 2 (20%) 7 (11%) 3 (7%) Serum lac tat e deh ydr ogenase a Nor mal 45 (56%) 9 (39%) 0.164 # 34 (52%) 20 (53%) 0.913 # 47 (51%) 5 (50%) 1.000 † 32 (52%) 22 (49%) 0.896 # Ele vat ed 36 (44%) 14 (61%) 32 (48%) 18 (47%) 42 (49%) 5 (50%) 29 (48%) 21 (51%) No
. of ex
tranodal sit es < 2 65 (77%) 16 (70%) 0.439 # 54 (78%) 27 (71%) 0.405 # 71 (78%) 5 (50%) 0.118 † 51 (81%) 30 (68%) 0.130 # ≥ 2 19 (23%) 7 (30%) 15 (22%) 11 (29%) 21 (22%) 5 (50%) 12 (19%) 14 (32%) Ann Ar bor stage I–II 45 (54%) 11 (48%) 0.625 # 38 (55%) 18 (47%) 0.445 # 50 (%) 5 (50%) 1.000 † 37 (59%) 19 (43%) 0.113 # III–IV 39 (46%) 12 (52%) 31 (45%) 20 (53%) 42 (%) 5 (50%) 26 (41%) 25 (57%) Int er national pr og nostic index 0–2 57 (68%) 14 (61%) 0.530 # 47 (68%) 24 (63%) 0.603 # 64 (70%) 5 (50%) 0.286 † 44 (70%) 27 (61%) 0.361 # 3–5 27 (32%) 9 (39%) 22 (32%) 14 (37%) 28 (30%) 5 (50%) 19 (30%) 17 (39%) Bone mar ro w in volv ement a Absent 66 (87%) 18 (82%) 0.553 † 54 (86%) 30 (86%) 1.000 76 (89%) 7 (70%) 0.283 † 51 (88%) 33 (83%) 0.450 # P resent 10 (13%) 4 (18%) 9 (14%) 5 (14%) 9 (11%) 2 (20%) 7 (12%) 7 (17%) Bulk
y mass (
[image:5.595.72.522.75.729.2]NA: not applicable; EC
OG PS: the East
er n C ooper ativ e Gr oup P er for manc e S ta
tus; GCB: ger
minal c
en
ter B
-c
ell like;
R-CHOP
: r
ituximab with c
yclophosphamide –do xorubicin– vincr istine –pr
ednisone; GI: gastr
oin
testinal; GA:
genetic alt
er
ation; IHC: immunohist
ochemistr
y; SD: standar
d devia
tion
a T
hese v
ar
iables e
xcluded unclassifiable (or unk
no wn) cases p v alues w er e calcula ted b
y using F
isher
’s e
xac
t t
est (2-sided)
† or P
earson
’s Chi squar
e t est (2-sided) # Table 2 (c on tinued) Clinic opa tholog ic char ac teristics PD ‑L1 e xpr
ession in tumor c
ells (PD ‑L1t) PD ‑L1 e xpr
ession in immune c
ells
(PD
‑L1i)
PD
‑L1 genetic alt
er
ation in tumor c
ells (PD ‑L1 GA ) pST AT3
a e
xpr
ession in tumor c
ells PD ‑L1t − PD ‑L1t + p v alue PD ‑L1i − PD ‑L1i + p v alue PD ‑L1 GA − PD ‑L1 GA + p v alue pST AT3 − (< 40%) pST AT3 + (> 40%) p v alue ≥ 10 6 (7%) 3 (13%) 5 (7%) 4 (11%) 8 (9%) 1 (10%) 7 (11%) 2 (5%) Hans classification a GCB 26 (34%) 1 (5%) 0.006 † 20 (32%) 7 (19%) 0.186 26 (30%) 0 (0%) 0.058 † 20 (35%) 7 (17%) 0.042 # Non ‑GCB 51 (66%) 21 (95%) 43 (68%) 29 (81%) 61 (70%) 10 (100%) 37 (65%) 35 (83%) BCL2 expr ession a Negativ e 33 (40%) 8 (35%) 0.665 # 31 (46%) 10 (26%) 0.051 # 35 (38%) 2 (20%) 0.321 † 31 (50%) 10 (23%) 0.004 # P ositiv e 50 (60%) 15 (65%) 37 (54%) 28 (74%) 57 (62%) 8 (80%) 31 (50%) 34 (77%) BCL6 expr ession Negativ e 43 (51%) 17 (74%) 0.052 # 36 (52%) 24 (63%) 0.273 # 46 (50%) 9 (90%) 0.019 † 39 (62%) 21 (48%) 0.146 # P ositiv e 41 (49%) 6 (26%) 33 (48%) 14 (37%) 46 (50%) 1 (10%) 24 (38%) 23 (52%) CD10 expr ession Negativ e 69 (82%) 23 (100%) 0.037 † 57 (83%) 35 (92%) 0.248 † 77 (84%) 10 (100%) 0.351 † 52 (83%) 40 (91%) 0.268 † P ositiv e 15 (18%) 0 (0%) 12 (17%) 3 (8%) 15 (16%) 0 (0%) 11 (17%) 4 (9%) MUM1 expr ession Negativ e 36 (43%) 5 (22%) 0.065 # 28 (41%) 13 (34%) 0.517 # 35 (38%) 1 (10%) 0.094 † 31 (49%) 10 (23%) 0.006 # P ositiv e 48 (57%) 18 (78%) 41 (59%) 25 (66%) 57 (62%) 9 (90%) 32 (51%) 34 (77%)
Total N (%)
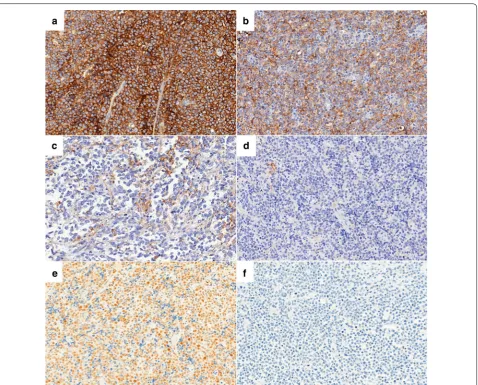
[image:6.595.66.341.79.726.2]cells. All cases with PD-L1 gene alteration (PD-L1 GA+) expressed PD-L1 protein in tumor cells (PD-L1t+), and accounted for 10% (10/102) of DLBCLs which includes translocation in 6% (6/102) and gain/amplification in 4% (4/102). Nuclear expression of pSTAT3 (> 40% cutoff) was observed in 41% (44/107) of DLBCLs (Figs. 1 and 2).
In the analysis with clinicopathologic variables (Table 2), PD-L1 GA+ was more frequent in primary extranodal DLBCLs than nodal cases (p = 0.049), and all PD-L1 GA+ cases (n = 10) belonged to non-GCB sub-type according to Hans algorithm, while not reaching sta-tistical significance (p = 0.058). As for protein expression, non-GCB subtype also showed more frequent PD-L1 expression (PD-L1t+), as well as pSTAT3 expression, in tumor cells than GCB subtype (p = 0.006 and p = 0.042,
respectively). In the analysis with Bcl-2 and each com-ponent of Hans algorithm, PD-L1 GA and PD-L1t was significantly or marginally associated with lack of expres-sion of Bcl-6 and/or CD10 (p = 0.019 for PD-L1 GA vs. Bcl-6; p = 0.052 for PD-L1t vs Bcl-6; p = 0.037 for PD-L1t vs CD10), while pSTAT3 expression was mainly related with MUM1 expression (p = 0.006). Of note, PD-L1i was marginally associated with Bcl-2 expression in tumor cells (p = 0.051). Taken together, PD-L1 and/or pSTAT3 signaling pathways are frequently activated in non-GCB subtype or extranodal DLBCLs.
[image:7.595.61.540.85.470.2]Association within PD‑L1/pSTAT3‑related markers
To clarify the associations between PD-L1 gene/pro-tein status and pSTAT3 expression in DLBCLs, we next performed correlation analysis among PD-L1/pSTAT3-related markers including PD-L1t, PD-L1i, PD-L1 GA
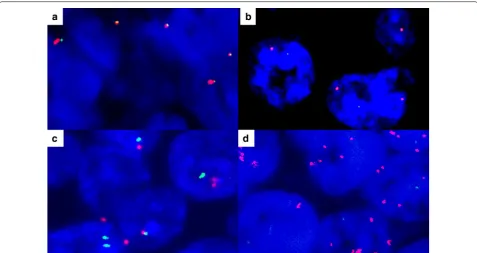
[image:8.595.59.537.87.340.2]and pSTAT3 expression with dichotomized variable by 40% cutoff and continuous variable (%) (Table 3). To effectively recognize associations between PD-L1-re-lated markers and pSTAT3, pSTAT3 was analyzed as two different modes of variables: (1) a digitally counted Fig. 2 Fluorescence in situ hybridization analysis of PD‑L1 gene in diffuse large B cell lymphoma. By using dual‑color orange/green break‑apart probe, in contrast to non‑split fused yellow signals showing no translocation (a), separate orange and green signals indicate translocation of PD‑L1 gene (b). Copy number analysis probes containing orange (PD‑L1 gene) and green (chromosome 9) signals show nearly 1:1 ratio of orange to green signals, indicating no increase of copy number of PD‑L1 gene (c). In contrast, orange signals are amplified, compared to green signals (d)
Table 3 Associations between PD-L1, pSTAT3 and other clinicopathologic factors in diffuse large B cell lymphoma (n = 107)
Correlation coefficients (R) and p values by Pearson’s correlation
a Indicates the proportion (%) of tumor cells expressing pSTAT3 by using digital image analyzer b Indicates PD-L1t+ cases with no alteration (translocation or gain/amplification) of PD-L1 gene
PD‑L1i PD‑L1 translocation (A)
PD‑L1 gain/ amplification (B)
PD‑L1 gene alteration (A + B)
PD‑L1 non‑ genetic expressionb
pSTAT3a (continuous) pSTAT3 (> 40%)
PD‑L1t R = 0.325
p = 0.001 R p < 0.001= 0.477 R p < 0.001= 0.386 R p < 0.001= 0.629 p < 0.001R = 0.698 R p == 0.079 0.429 R p == 0.071 0.466
PD‑L1i R = 0.239
p = 0.015 R p == 0.159 0.109 p R == 0.291 0.003 R p == 0.166 0.092 R p == 0.081 0.414 R p == 0.015 0.879 PD‑L1 translocation (A) R =− 0.051
p = 0.614 R p < 0.001= 0.758 R p == 0.364− 0.090 p R == 0.628− 0.049 R p == 0.714− 0.037 PD‑L1 gain/amplifica‑
tion (B) p < 0.001R = 0.613 R p == 0.464− 0.073 p R == 0.242− 0.117 R p == 0.470− 0.072 PD‑L1 gene alteration
(A + B) R p == 0.228− 0.120 R p == 0.245− 0.117 R p == 0.835− 0.021 PD‑L1 non‑genetic
[image:8.595.61.540.439.606.2]proportional variable (%) of pSTAT3-positive tumor cells and (2) a conventionally interpreted dichotomized variable with 40% cutoff value. In this way, PD-L1t was positively correlated with PD-L1i, PD-L1 translocation and PD-L1 gain/amplification, while PD-L1i was asso-ciated only with PD-L1 translocation. Notably, tumor cells of DLBCLs with PD-L1 expression but no PD-L1
gene alteration (PD-L1t+ PD-L1 GA−) had a higher proportion (%) of pSTAT3-positive tumor cells than the rest of the subset (PD-L1t− or PD-L1t+ PD-L1 GA+) (p = 0.033; Fig. 3a), and in comparison to both PD-L1t−
subset (p = 0.053) and PD-L1t+ PD-L1 GA+ subset (p = 0.050) with marginal significance as well (Fig. 3b). These results suggest that PD-L1 protein expression in Fig. 3 Dot plots for proportions of pSTAT3‑positive tumor cells according to PD‑L1 protein expression in tumor cells and gene alteration status in diffuse large B cell lymphoma. PD‑L1t+ PD‑L1 GA− cases have higher proportions (%) of pSTAT3‑positive tumor cells than the rest cases (PD‑L1t− or PD‑L1t+ PD‑L1 GA+) (a), and this tendency was preserved in comparison of each subset (PD‑L1t+ PD‑L1 GA− vs. PD‑L1t−; PD‑L1t+ PD‑L1 GA− vs. PD‑L1t+ PD‑L1 GA+) (b)
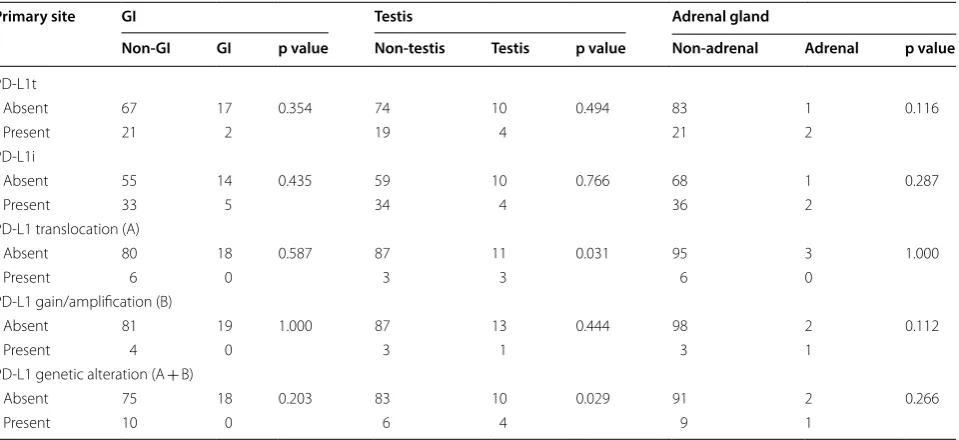
Table 4 Associations between genetic alteration and protein expression status of PD-L1 and primary sites
p values were calculated by using Fisher’s exact test (2-sided) GI: gastrointestinal; GA: genetic alteration
Primary site GI Testis Adrenal gland
Non‑GI GI p value Non‑testis Testis p value Non‑adrenal Adrenal p value
PD‑L1t
Absent 67 17 0.354 74 10 0.494 83 1 0.116
Present 21 2 19 4 21 2
PD‑L1i
Absent 55 14 0.435 59 10 0.766 68 1 0.287
Present 33 5 34 4 36 2
PD‑L1 translocation (A)
Absent 80 18 0.587 87 11 0.031 95 3 1.000
Present 6 0 3 3 6 0
PD‑L1 gain/amplification (B)
Absent 81 19 1.000 87 13 0.444 98 2 0.112
Present 4 0 3 1 3 1
PD‑L1 genetic alteration (A + B)
Absent 75 18 0.203 83 10 0.029 91 2 0.266
[image:9.595.61.539.86.292.2] [image:9.595.60.540.376.596.2]Table 5 Survival analysis with progression-free survival in total cohort and in patients treated with rituximab plus cyclophosphamide, doxorubicin, vincristine and prednisone (n = 93)
PD-L1: programmed cell death-ligand 1; pSTAT3: phosphorylated signal transducer and activator of transcription 3; ECOG PS: the Eastern Cooperative Group Performance Status; GCB: germinal center B-cell like; R-CHOP: rituximab plus cyclophosphamide, doxorubicin, vincristine and prednisone
Clinicopathologic variables Total cohort Patients treated with R‑CHOP Univariate Multivariate Univariate Multivariate
p value p value HR (95% CI) p value p value HR (95% CI)
Age
> 60 vs. ≤ 60 0.035 0.181 0.074
Sex
Male vs. female 0.544 0.661
ECOG PS
≥ 2 vs. < 2 <0.001 0.010 3.717 (1.371–10.080) < 0.001 0.031 3.286 (1.116–9.677) B symptoms
Present vs. absent 0.049 0.807 0.112
Serum LDH
Elevated vs. normal 0.003 0.328 0.033 0.319
IPI
3–5 vs. 0–2 < 0.001 0.001 4.910 (1.888–12.767) < 0.001 0.002 4.823 (1.763–13.191) Primary site
Extranodal vs. nodal 0.488 0.523
Extranodal site
≥ 2 vs. < 2 < 0.001 0.649 0.001 0.978
Bone marrow involvement
Present vs. absent 0.308 0.359
Bulky mass
≥ 10 cm vs. < 10 cm 0.136 0.048 0.010 4.664 (1.449–15.017)
Ann Arbor stage
III–IV vs. I–II < 0.001 0.682 < 0.001 0.812
Hans classification
Non‑GCB vs. GCB 0.075 0.135
Treatment regimen
RCHOP vs. other 0.676 –
BCL2 expression
Positive vs. negative 0.391 0.699
BCL6 expression
Positive vs. negative 0.247 0.545
CD10 expression
Positive vs. negative 0.543 0.778
MUM1 expression
Positive vs. negative 0.138 0.211
PD‑L1 tumor cell expression
Positive vs. negative 0.400 0.353
PD‑L1 immune cell expression
Positive vs. negative 0.187 0.146
PD‑L1 gene alteration
Present vs. absent 0.900 0.871
pSTAT3 expression (> 40%)
DLBCL tumor cells lacking intrinsic PD-L1 gene acti-vation mechanism, i.e., translocation and gain/amplifi-cation, may be induced by STAT3-mediated signaling pathway.
Associations between PD‑L1 expression and gene alteration and primary sites
Frequent gene alteration and expression of PD-L1 were known in DLBCLs arising in certain specific sites such as mediastinum and brain [33, 34], both of which were excluded in our cohort. In our cohort, we further ana-lyzed the PD-L1 according to the primary sites, focus-ing on gastrointestinal tract, testis and adrenal gland. As shown in Table 4, primary testis cases (n = 14) had a higher frequency of PD-L1 gene alteration (29%; 4/14), mainly translocation (21%; 3/14), than non-testis cases (p = 0.029 for PD-L1 GA; p = 0.031 for PD-L1 transloca-tion). Notably, one of the three adrenal gland cases (33%) had a gain/amplification of PD-L1, though with limited significance due to low incidence (p = 0.112). These data suggest that DLBCLs of specific anatomic sites might have preferential alteration patterns of PD-L1 gene.
Survival analysis
Survival analysis was conducted in total cohort and sepa-rately in the subgroup of patients treated with R-CHOP (n = 93; Table 5). No significance was found in clinical outcome with PD-L1 expression alone in either tumor (PD-L1t) or non-malignant immune cells (PD-L1i) (Fig. 4a–d). However, pSTAT3 expression (> 40%) was significantly associated with inferior progression-free survival in the total cohort (p = 0.021; Fig. 4e) and in the R-CHOP-treated group (p = 0.015; Fig. 4f). Multivariate cox regression that followed revealed pSTAT3 to be an independent prognostic factor in both the total cohort (p = 0.017, HR = 2.724) and R-CHOP-treated patients (p = 0.007, HR = 3.510). Other significant prognostic factors in this multivariate analysis were IPI (p = 0.001, HR = 4.910 in total cohort; p = 0.002, HR = 4.823 in the R-CHOP treated group), Eastern Cooperative Group Performance Status (p = 0.010, HR = 3.717 in the total cohort; p = 0.031, HR =3.286 in R-CHOP treated group) and Bulky mass (p = 0.010, HR = 4.664 in the R-CHOP treated group). When the R-CHOP cohort (n = 93) was divided into pSTAT3-negative (n = 56) and
pSTAT3-positive subgroups (n = 37), PD-L1
expres-sion of non-malignant immune cells (PD-L1i) correlated with poor progression-free survival in pSTAT3-negative patients who received R-CHOP regimen by log-rank test in Kaplan–Meier analysis (p = 0.042; Fig. 5). It did not, however, turn out to be an independent prognostic factor (p = 0.089; Table 6), while ECOG PS was the only signifi-cant prognostic factor (p < 0.001, HR = 21.553). Analysis with overall survival revealed no significant results (Addi-tional file 1: Figure S1).
Discussion
The roles of PD-L1 expression and gene alteration are relatively unclear in EBV-negative DLBCLs, compared to EBV-positive DLBCLs. In this study, we observed that (1) immunopositivity for PD-L1 was 21% in tumor cells which included all the cases of PD-L1 gene altera-tion that accounts for 10%, and 36% in immune cells, while pSTAT3 positivity was 41% in tumor cells, (2) the non-GCB subtype showed higher PD-L1 and pSTAT3 tumor cell expression and a tendency for PD-L1 gene alteration, (3) PD-L1 expression without gene altera-tion correlated with pSTAT3 expression, (4) pSTAT3 expression independently predicted shorter PFS in total cohort and R-CHOP-treated group and (5) PD-L1 expression in immune cells correlated with shorter PFS in pSTAT3-negative R-CHOP-treated subset, while influenced by ECOG PS.
Research on PD-L1 in DLBCL has started rather recently and the evaluation methods or standards of PD-L1 immunohistochemistry in DLBCL has not yet met consensus. Studies vary in the PD-L1 antibodies used, the method of evaluation (manual or digital) and the cutoff values to determine positivity. The preva-lence of PD-L1 expression ranges greatly from 10.5 to 61.1% in tumor cells and 15.3 to 30% in non-malignant immune cells [4–6, 35, 36], which are similar to our observation.
In the present study, tumor cell expression of PD-L1, but not the non-malignant immune cell expression, significantly associated with non-GCB DLBCL. This is in concordance with previous studies [6–8]. Siddiqi and colleagues provided more concrete evidence of the association between PD-L1 expression and Hans algorithm classification by conducting next generation sequencing on primary DLBCL specimens [9]. In their
Fig. 4 Kaplan–Meier curves of progression‑free survival in total and R‑CHOP‑treated diffuse large B cell lymphoma patients. Survival analysis for progression‑free survival (PFS) according to PD‑L1t in total cohort (n = 107) (a) and R‑CHOP cohort (n = 93) (b), and according to PD‑L1i in total cohort (c) and R‑CHOP cohort (d). Survival analysis for PFS according to pSTAT3 (40% cutoff ) in total cohort (e) and R‑CHOP cohort (f). *T: tumor cell; I: immune cell
study, the positive correlation of PD-L1 expression and mutations associated with non-GCB DLBCL such as FAT2 contrasted with the negative correlation of mutations associated with GCB DLBCL such as BCL2, FOXO1 and KMT2D. Considering that PD-L1 gene tended to be frequently altered in non-GCB or extran-odal DLBCLs, PD-L1 gene alteration may be one of the important genetic features of non-GCB DLBCLs, and these findings may provide an insight into the under-standing of the pathogenesis of non-GCB DLBCLs.
Among various extranodal DLBCLs, several site-spe-cific variants or distinct entities have been described [29]. Primary testicular DLBCLs are well-known to have unique clinicopathologic features with frequent PD-L1 gene alteration [34]. In accordance with these reports, we observed frequent PD-L1 gene alteration of testicular DLBCLs in our cohort as well, and translocation was the predominant form of alteration. Primary adrenal DLBCL is another very rare extranodal subset with unique clini-cal features [37]. However, the underlying genetic altera-tion is not well characterized. In our observaaltera-tion, one of the three adrenal DLBCL harbored PD-L1 gain/amplifi-cation, although the clinical significance could not yet be determined. This finding might provide a clue to adrenal lymphomagenesis and lead to further investigation of PD-L1 gene alteration in adrenal DLBCLs.
The 41% positivity of pSTAT3 immunohistochemis-try of this study is in agreement with most reports [27, 38–40]. Increased expression of pSTAT3 also showed sig-nificant association with non-GCB DLBCL. Constitutive
activation of STAT3 in non-GCB DLBCL has been investigated more in depth than PD-L1. Higher levels of STAT3 mRNA was detected in the non-GCB sub-type than the GCB subsub-type using DLBCL cell lines [22, 28] and pSTAT3 appeared to bind to promoters of dif-ferent genes in each subtype, wherein genes regulating cell proliferation and survival are mostly upregulated in non-GCB DLBCL [28]. The preferential activation of STAT3 in non-GCB DLBCL may in part be explained by Bcl-6-induced down-regulation of STAT3 in non-GCB DLBCL cells [23]. It is of note that Bcl-6 is a typical GCB marker and its expression level is generally low in non-GCB DLBCL, possibly leading to STAT3 activation.
Activated PD-1/PD-L1 axis plays the role of tumor eva-sion from host tumor-specific T-cell immunity. Concep-tually, the activation mechanism of PD-L1 gene may be divided into the intrinsic alteration of PD-L1 gene and activation of its upstream signaling pathway, which may contain STAT3 signaling [17]. This might be supported by our observation that the frequency of PD-L1 pro-tein expression (21%) is higher than PD-L1 gene altera-tion (10%). In the present study, cases with no alteraaltera-tion of PD-L1 gene (PD-L1t+ PD-L1 GA−) tended to have higher proportions (%) of pSTAT3-positive cells than PD-L1t− subset and PD-L1t+ PD-L1 GA+ subset. This finding suggests that STAT3-mediated PD-L1 expression and genetically activated PD-L1 expression might partly be mutually exclusive, and STAT3-mediated signaling might be an alternative mechanism for PD-L1 expression, which remains to be clarified further.
[image:13.595.61.539.87.301.2]Our finding in survival analysis for pSTAT3 expres-sion as an independent prognostic factor for shorter progression-free survival is consistent with the pre-vious reports in DLBCLs [19, 25, 39, 40]. Huang and
colleagues [40] took a step further in taking DLBCL cell lines to gene expression profiling analysis and found an 11-gene STAT3 signature including CD48, IRF1 and IL10, which correlated well with inferior clinical out-comes. In an experimental animal model, microenviron-mental immature dendritic cells coproducing IL-10 and PD-L1 enhanced anti-tumor immune reaction [41]. This finding suggests the cooperative immunosuppressive role of IL-10 and PD-L1, which may prevail in the STAT3-skewed microenvironment of non-GCB DLBCLs. Con-sidering that IL-10 is also produced by B cells via Toll-like receptor/MyD88/STAT3 pathway in immune reaction [42], the mechanism of interplay between neoplastic B cells and non-malignant immune cells with activated STAT3- and PD-L1-related signaling in the milieu of IL-10 may be more complex than solid tumor models. In this context, the effects of PD-L1 on clinical outcome need to be carefully analyzed with distinctive interpreta-tion of its expression on tumor cells and immune cells with consideration of activation status of the STAT3-related signaling pathway.
[image:14.595.56.289.126.619.2]Few have investigated the prognostic value of PD-L1 in DLBCL and the results are controversial. Kiyasu and colleagues [6] reported that PD-L1 expression of DLBCL tumor cells was associated with poor clinical outcome whereas that of non-malignant stromal cells showed no significant difference in prognosis. Siddiqi’s group [9] also found PD-L1 tumor cell expression to be associated with inferior survival while Kwon and colleagues [35] reported no significant association to clinical outcome in DLBCL. In the present study, though PD-L1 tumor cell expression had no prognostic significance, immune cell expression of PD-L1 was associated with poor out-come in the pSTAT3-negative R-CHOP-treated subset in univariate analysis. It is not clear why this prognostic effect of PD-L1 expressing immune cell was observed in this subset. One explanation might be that paucity of STAT3-related signature could make the immune micro-environment more dependent on PD-L1 signaling. Fur-thermore, the pSTAT3-positive subset may have robust STAT3-driven survival signaling of tumor cells that can override the effect of PD-L1-mediated immune evasion [23, 30, 43]. In another point of view, the prognostic role of immune cell PD-L1 may be related with tumoral Bcl-2 expression in our study, where both markers of different cell types had marginal association. The intrinsic mecha-nism of cancer cell may influence anti-tumor immunity [44, 45], where Bcl-2 protein may act as a tumor-associ-ated antigen [46], although further studies are required for support. In this context, proper isolation of clinico-pathologic subsets may provide chances for efficient therapeutic application in targeting PD-L1 signaling in DLBCL patients.
Table 6 Survival analysis with progression-free survival in patients treated with rituximab plus cyclophosphamide, doxorubicin, vincristine and prednisone (n = 56)
PD-L1: programmed cell death-ligand 1; pSTAT3: phosphorylated signal transducer and activator of transcription 3; ECOG PS: the Eastern Cooperative Group Performance Status; GCB: germinal center B-cell like; R-CHOP: rituximab with cyclophosphamide, doxorubicin, vincristine and prednisone
Clinicopathologic
variables Univariate Multivariate p value p value HR (95% CI)
Age
> 60 vs. ≤ 60 0.158 Sex
Male vs. female 0.702 ECOG PS
≥ 2 vs. < 2 < 0.001 < 0.001 21.553 (4.682–99.208) B symptoms
Present vs. absent 0.099 Serum LDH
Elevated vs. normal 0.189 IPI
3–5 vs. 0–2 0.002 0.238 Primary site
Extranodal vs. nodal 0.204 Extranodal site
≥ 2 vs. < 2 < 0.001 0.167 Bone marrow involvement
Present vs. absent 0.476 Bulky mass
≥ 10 cm vs. < 10 cm 0.279 Ann Arbor stage
III–IV vs. I–II 0.037 0.610 Hans classification
Non‑GCB vs. GCB 0.503 BCL2 expression
Positive vs. negative 0.983 BCL6 expression
Positive vs. negative 0.600 CD10 expression
Positive vs. negative 0.600 MUM1 expression
Positive vs. negative 0.409 PD‑L1 tumor cell expression
Positive vs. negative 0.209 PD‑L1 immune cell expression
Positive vs. negative 0.042 0.089 PD0L1 gene alteration
Conclusion
Our study revealed the association between gene altera-tion and protein expression of PD-L1 and pSTAT3 expression, both of which constituted features of non-GCB DLBCLs. We also observed that DLBCL patients with pSTAT3-positive tumors had an independently inferior clinical outcome, while in those with pSTAT3-negative tumors, PD-L1 immune cell expression was predictive of poor prognosis. These findings may open another potential immunotherapeutic strategy for the treatment of DLBCL.
Additional file
Additional file 1: Figure S1. Kaplan–Meier curves of overall survival in total and R‑CHOP‑treated diffuse large B cell lymphoma patients. *T, tumor cell; I, immune cell.
Abbreviations
DLBCL: diffuse large B cell lymphoma; PD‑L1: programmed cell death ligand 1; pSTAT3: phosphorylated signal transducer and activator of transcription 3; GCB: germinal center B cell like; R‑CHOP: rituximab combined with cyclophos‑ phamide–doxorubicin–vincristine–prednisone; EBV: Epstein–Barr virus; PD‑L1t: PD‑L1 expression in tumor cells; PD‑L1i: PD‑L1 expression in immune cells; PD‑L1 GA: PD‑L1 gene alteration.
Authors’ contributions
HJK and JHP conceived and designed the experiments. HJK, YJM and JHP per‑ formed the experiments and analyzed pathologic data. JSL and JOL collected and analyzed clinical data. HJK and JHP performed clinicopathologic analysis and wrote the manuscript. All authors edited the final manuscript. All authors read and approved the final manuscript.
Author details
1 Department of Pathology, Seoul National University Bundang Hospital, Seoul National University College of Medicine, 300 Gumi‑dong, Bundang‑gu, Seong‑ nam 463‑707, South Korea. 2 Department of Internal Medicine, Seoul National University Bundang Hospital, Seoul National University College of Medicine, Seongnam, South Korea.
Acknowledgements
Not applicable.
Competing interests
The authors declare that they have no competing interests.
Availability of data and materials
The datasets during and/or analyzed during the current study available from the corresponding author on reasonable request.
Consent for publication
Not applicable.
Ethics approval and consent to participate
The Institutional Review Board of Seoul National University Bundang Hospital (IRB of SNUBH) approved this study, and informed consent was waived by IRB of SNUBH because this study used archived materials with retrospective design.
Funding
This work was supported by Basic Science Research Program through the National Research Foundation (NRF) of Korea funded by the Ministry of Educa‑ tion (NRF‑2016R1D1A1B03935507).
Publisher’s Note
Springer Nature remains neutral with regard to jurisdictional claims in pub‑ lished maps and institutional affiliations.
Received: 1 October 2018 Accepted: 9 November 2018
References
1. Li S, Young KH, Medeiros LJ. Diffuse large B‑cell lymphoma. Pathology. 2018;50:74–87.
2. Hans CP, Weisenburger DD, Greiner TC, Gascoyne RD, Delabie J, Ott G, Muller‑Hermelink HK, Campo E, Braziel RM, Jaffe ES, et al. Confirmation of the molecular classification of diffuse large B‑cell lymphoma by immuno‑ histochemistry using a tissue microarray. Blood. 2004;103:275–82. 3. Rosenwald A, Wright G, Chan WC, Connors JM, Campo E, Fisher RI, Gas‑
coyne RD, Muller‑Hermelink HK, Smeland EB, Giltnane JM, et al. The use of molecular profiling to predict survival after chemotherapy for diffuse large‑B‑cell lymphoma. N Engl J Med. 2002;346:1937–47.
4. Chen BJ, Chapuy B, Ouyang J, Sun HH, Roemer MG, Xu ML, Yu H, Fletcher CD, Freeman GJ, Shipp MA, et al. PD‑L1 expression is characteristic of a subset of aggressive B‑cell lymphomas and virus‑associated malignan‑ cies. Clin Cancer Res. 2013;19:3462–73.
5. Laurent C, Charmpi K, Gravelle P, Tosolini M, Franchet C, Ysebaert L, Brous‑ set P, Bidaut A, Ycart B, Fournie JJ. Several immune escape patterns in non‑Hodgkin’s lymphomas. Oncoimmunology. 2015;4:e1026530. 6. Kiyasu J, Miyoshi H, Hirata A, Arakawa F, Ichikawa A, Niino D, Sugita Y, Yufu
Y, Choi I, Abe Y, et al. Expression of programmed cell death ligand 1 is associated with poor overall survival in patients with diffuse large B‑cell lymphoma. Blood. 2015;126:2193–201.
7. Gravelle P, Burroni B, Pericart S, Rossi C, Bezombes C, Tosolini M, Damotte D, Brousset P, Fournie JJ, Laurent C. Mechanisms of PD‑1/PD‑L1 expres‑ sion and prognostic relevance in non‑Hodgkin lymphoma: a summary of immunohistochemical studies. Oncotarget. 2017;8:44960–75.
8. Georgiou K, Chen L, Berglund M, Ren W, de Miranda NF, Lisboa S, Fan‑ gazio M, Zhu S, Hou Y, Wu K, et al. Genetic basis of PD‑L1 overexpression in diffuse large B‑cell lymphomas. Blood. 2016;127:3026–34.
9. Siddiqi IN, Thodima V, Friedman J, Violeta A, Tulpule A, Shaknovich R, Houldsworth J. PD‑L1 expression identifies high risk diffuse large B‑cell lymphoma and is associated with several genomic markers. Blood. 2016;128:153‑.
10. Nicolae A, Pittaluga S, Abdullah S, Steinberg SM, Pham TA, Davies‑Hill T, Xi L, Raffeld M, Jaffe ES. EBV‑positive large B‑cell lymphomas in young patients: a nodal lymphoma with evidence for a tolerogenic immune environment. Blood. 2015;126:863–72.
11. Goodman A, Patel SP, Kurzrock R. PD‑1‑PD‑L1 immune‑checkpoint block‑ ade in B‑cell lymphomas. Nat Rev Clin Oncol. 2017;14:203–20.
12. Green MR, Monti S, Rodig SJ, Juszczynski P, Currie T, O’Donnell E, Chapuy B, Takeyama K, Neuberg D, Golub TR, et al. Integrative analysis reveals selective 9p24.1 amplification, increased PD‑1 ligand expression, and further induction via JAK2 in nodular sclerosing Hodgkin lymphoma and primary mediastinal large B‑cell lymphoma. Blood. 2010;116:3268–77. 13. Tirado CA, Chen W, Garcia R, Kohlman KA, Rao N. Genomic profiling using
array comparative genomic hybridization define distinct subtypes of diffuse large B‑cell lymphoma: a review of the literature. J Hematol Oncol. 2012;5:54.
14. Fang W, Zhang J, Hong S, Zhan J, Chen N, Qin T, Tang Y, Zhang Y, Kang S, Zhou T, et al. EBV‑driven LMP1 and IFN‑gamma up‑regulate PD‑L1 in nasopharyngeal carcinoma: implications for oncotargeted therapy. Oncotarget. 2014;5:12189–202.
15. Calo V, Migliavacca M, Bazan V, Macaluso M, Buscemi M, Gebbia N, Russo A. STAT proteins: from normal control of cellular events to tumorigenesis. J Cell Physiol. 2003;197:157–68.
16. Ritprajak P, Azuma M. Intrinsic and extrinsic control of expression of the immunoregulatory molecule PD‑L1 in epithelial cells and squamous cell carcinoma. Oral Oncol. 2015;51:221–8.
•fast, convenient online submission •
thorough peer review by experienced researchers in your field
• rapid publication on acceptance
• support for research data, including large and complex data types
•
gold Open Access which fosters wider collaboration and increased citations maximum visibility for your research: over 100M website views per year •
At BMC, research is always in progress.
Learn more biomedcentral.com/submissions
Ready to submit your research? Choose BMC and benefit from: induces through STAT3 expression of immunosuppressive protein CD274
(PD‑L1, B7‑H1). Proc Natl Acad Sci USA. 2008;105:20852–7. 18. Ansell SM, Lesokhin AM, Borrello I, Halwani A, Scott EC, Gutierrez M,
Schuster SJ, Millenson MM, Cattry D, Freeman GJ, et al. PD‑1 blockade with nivolumab in relapsed or refractory Hodgkin’s lymphoma. N Engl J Med. 2015;372:311–9.
19. Song TNM, Lim J, Nagarajan S, Pang JW, Laurensia Y, Wijaya GC, Jing T, Ong C. Oncogenic activation of STAT3 pathway drives PD‑L1 expression in natural killer/T cell lymphoma. Hematol Oncol. 2017;35:163–4. 20. Atsaves V, Tsesmetzis N, Chioureas D, Kis L, Leventaki V, Drakos E, Pana‑
retakis T, Grander D, Medeiros LJ, Young KH, et al. PD‑L1 is commonly expressed and transcriptionally regulated by STAT3 and MYC in ALK‑ negative anaplastic large‑cell lymphoma. Leukemia. 2017;31:1633–7. 21. Ma C, Horlad H, Pan C, Yano H, Ohnishi K, Fujiwara Y, Matsuoka M, Lee
A, Niidome T, Yamanaka R, et al. Stat3 inhibitor abrogates the expres‑ sion of PD‑1 ligands on lymphoma cell lines. J Clin Exp Hematopathol. 2017;57:21–5.
22. Lam LT, Wright G, Davis RE, Lenz G, Farinha P, Dang L, Chan JW, Rosenwald A, Gascoyne RD, Staudt LM. Cooperative signaling through the signal transducer and activator of transcription 3 and nuclear factor‑{kappa} B pathways in subtypes of diffuse large B‑cell lymphoma. Blood. 2008;111:3701–13.
23. Ding BB, Yu JJ, Yu RY, Mendez LM, Shaknovich R, Zhang Y, Cattoretti G, Ye BH. Constitutively activated STAT3 promotes cell proliferation and survival in the activated B‑cell subtype of diffuse large B‑cell lymphomas. Blood. 2008;111:1515–23.
24. Scuto A, Kujawski M, Kowolik C, Krymskaya L, Wang L, Weiss LM, Digiusto D, Yu H, Forman S, Jove R. STAT3 inhibition is a therapeutic strategy for ABC‑like diffuse large B‑cell lymphoma. Cancer Res. 2011;71:3182–8. 25. Ok CY, Chen J, Xu‑Monette ZY, Tzankov A, Manyam GC, Li L, Visco C,
Montes‑Moreno S, Dybkaer K, Chiu A, et al. Clinical implications of phos‑ phorylated STAT3 expression in de novo diffuse large B‑cell lymphoma. Clin Cancer Res. 2014;20:5113–23.
26. Ohgami RS, Ma L, Monabati A, Zehnder JL, Arber DA. STAT3 muta‑ tions are present in aggressive B‑cell lymphomas including a subset of diffuse large B‑cell lymphomas with CD30 expression. Haematologica. 2014;99:e105–7.
27. Gupta M, Han JJ, Stenson M, Wellik L, Witzig TE. Regulation of STAT3 by histone deacetylase‑3 in diffuse large B‑cell lymphoma: implications for therapy. Leukemia. 2012;26:1356–64.
28. Hardee J, Ouyang Z, Zhang Y, Kundaje A, Lacroute P, Snyder M. STAT3 targets suggest mechanisms of aggressive tumorigenesis in diffuse large B‑cell lymphoma. G3 Bethesda. 2013;3:2173–85.
29. Swerdlow SH, Campo E, Harris NL. WHO classification of tumours of haematopoietic and lymphoid tissues. Lyon: IARC Press; 2017. 30. Paik JH, Nam SJ, Kim TM, Heo DS, Kim CW, Jeon YK. Overexpression of
sphingosine‑1‑phosphate receptor 1 and phospho‑signal transducer and activator of transcription 3 is associated with poor prognosis in rituxi‑ mab‑treated diffuse large B‑cell lymphomas. BMC Cancer. 2014;14:911. 31. Paik JH, Go H, Nam SJ, Kim TM, Heo DS, Kim CW, Jeon YK. Clinico‑
pathologic implication of A20/TNFAIP3 deletion in diffuse large B‑cell
lymphoma: an analysis according to immunohistochemical subgroups and rituximab treatment. Leuk Lymphoma. 2013;54:1934–41.
32. Go H, Cho HJ, Paik JH, Park CM, Oh YH, Jung KC, Kim CW, Jeon YK. Thymic extranodal marginal zone B‑cell lymphoma of mucosa‑associated lym‑ phoid tissue: a clinicopathological and genetic analysis of six cases. Leuk Lymphoma. 2011;52:2276–83.
33. Twa DD, Chan FC, Ben‑Neriah S, Woolcock BW, Mottok A, Tan KL, Slack GW, Gunawardana J, Lim RS, McPherson AW, et al. Genomic rearrange‑ ments involving programmed death ligands are recurrent in primary mediastinal large B‑cell lymphoma. Blood. 2014;123:2062–5. 34. Chapuy B, Roemer MG, Stewart C, Tan Y, Abo RP, Zhang L, Dunford AJ,
Meredith DM, Thorner AR, Jordanova ES, et al. Targetable genetic features of primary testicular and primary central nervous system lymphomas. Blood. 2016;127:869–81.
35. Kwon D, Kim S, Kim PJ, Go H, Nam SJ, Paik JH, Kim YA, Kim TM, Heo DS, Kim CW, et al. Clinicopathological analysis of programmed cell death 1 and programmed cell death ligand 1 expression in the tumour microenvironments of diffuse large B cell lymphomas. Histopathology. 2016;68:1079–89.
36. Menter T, Bodmer‑Haecki A, Dirnhofer S, Tzankov A. Evaluation of the diagnostic and prognostic value of PDL1 expression in Hodgkin and B‑cell lymphomas. Hum Pathol. 2016;54:17–24.
37. Rashidi A, Fisher SI. Primary adrenal lymphoma: a systematic review. Ann Hematol. 2013;92:1583–93.
38. Sung J‑Y, Lim S‑J, Kim YW, Lee J. Prognostic significance of pSTAT3 and Survivin expression in diffuse large B‑cell lymphoma. Basic Appl Pathol. 2010;3:7–13.
39. Wu ZL, Song YQ, Shi YF, Zhu J. High nuclear expression of STAT3 is associ‑ ated with unfavorable prognosis in diffuse large B‑cell lymphoma. J Hematol Oncol. 2011;4:31.
40. Huang X, Meng B, Iqbal J, Ding BB, Perry AM, Cao W, Smith LM, Bi C, Jiang C, Greiner TC, et al. Activation of the STAT3 signaling pathway is associ‑ ated with poor survival in diffuse large B‑cell lymphoma treated with R‑CHOP. J Clin Oncol. 2013;31:4520–8.
41. Llopiz D, Ruiz M, Infante S, Villanueva L, Silva L, Hervas‑Stubbs S, Alignani D, Guruceaga E, Lasarte JJ, Sarobe P. IL‑10 expression defines an immuno‑ suppressive dendritic cell population induced by antitumor therapeutic vaccination. Oncotarget. 2017;8:2659–71.
42. Liu BS, Cao Y, Huizinga TW, Hafler DA, Toes RE. TLR‑mediated STAT3 and ERK activation controls IL‑10 secretion by human B cells. Eur J Immunol. 2014;44:2121–9.
43. Lu L, Zhu F, Zhang M, Li Y, Drennan AC, Kimpara S, Rumball I, Selzer C, Cameron H, Kellicut A, et al. Gene regulation and suppression of type I interferon signaling by STAT3 in diffuse large B cell lymphoma. Proc Natl Acad Sci USA. 2018;115:E498–505.
44. Spranger S, Gajewski TF. Mechanisms of tumor cell—intrinsic immune evasion. Annu Rev Cancer Biol. 2018;2:213–28.
45. Wellenstein MD, de Visser KE. Cancer‑cell‑intrinsic mechanisms shaping the tumor immune landscape. Immunity. 2018;48:399–416.