M E T H O D O L O G Y
Open Access
Analytical platform evaluation for quantification
of ERG in prostate cancer using protein and
mRNA detection methods
Jintang He
1, Athena A Schepmoes
1, Tujin Shi
1, Chaochao Wu
1, Thomas L Fillmore
2, Yuqian Gao
1,
Richard D Smith
1, Wei-Jun Qian
1, Karin D Rodland
1, Tao Liu
1, David G Camp II
1, Anshu Rastogi
3, Shyh-Han Tan
3,
Wusheng Yan
3, Ahmed A Mohamed
3, Wei Huang
3, Sreedatta Banerjee
3, Jacob Kagan
4, Sudhir Srivastava
4,
David G McLeod
3,5, Shiv Srivastava
3, Gyorgy Petrovics
3, Albert Dobi
3and Alagarsamy Srinivasan
3*Abstract
Background:The established methods for detecting prostate cancer (CaP) are based on tests using PSA (blood), PCA3 (urine), and AMACR (tissue) as biomarkers in patient samples. The demonstration of ERG oncoprotein overexpression due to gene fusion in CaP has thus provided ERG as an additional biomarker. Based on this, we hypothesized that ERG protein quantification methods can be of use in the diagnosis of prostate cancer.
Methods:An antibody-free assay for ERG3 protein detection was developed based on PRISM (high-pressure high-resolution separations with intelligent selection and multiplexing)-SRM (selected reaction monitoring) mass spectrometry. We utilizedTMPRSS2-ERGpositive VCaP andTMPRSS2-ERGnegative LNCaP cells to simulate three different sample types (cells, tissue, and post-DRE urine sediment). Enzyme-linked immunosorbent assay (ELISA), western blot, NanoString, and qRT-PCR were also used in the analysis of these samples.
Results:Recombinant ERG3 protein spiked into LNCaP cell lysates could be detected at levels as low as 20 pg by PRISM-SRM analysis. The sensitivity of the PRISM-SRM assay was approximately 10,000 VCaP cells in a mixed cell population model of VCaP and LNCaP cells. Interestingly, ERG protein could be detected in as few as 600 VCaP cells spiked into female urine. The sensitivity of the in-house ELISA was similar to the PRISM-SRM assay, with detection of 30 pg of purified recombinant ERG3 protein and 10,000 VCaP cells. On the other hand, qRT-PCR exhibited a higher sensitivity, asTMPRSS2-ERGtranscripts were detected in as few as 100 VCaP cells, in comparison to NanoString methodologies which detectedERGfrom 10,000 cells.
Conclusions:Based on this data, we propose that the detection of bothERGtranscriptional products with RNA-based assays, as well as protein products ofERGusing PRISM-SRM assays, may be of clinical value in developing diagnostic and prognostic assays for prostate cancer given their sensitivity, specificity, and reproducibility.
Keywords:ERG, Quantification, Biomarker, PRISM-SRM, MRM, Mass spectrometry, ELISA, Prostate cancer, Diagnosis
* Correspondence:[email protected]
3
Center for Prostate Disease Research, Department of Surgery, Uniformed Services University of the Health Sciences, Bethesda, MD, USA
Full list of author information is available at the end of the article
© 2015 He et al.; licensee BioMed Central. This is an Open Access article distributed under the terms of the Creative Commons Attribution License (http://creativecommons.org/licenses/by/4.0), which permits unrestricted use, distribution, and
Background
Human cancers are commonly stratified by expression sta-tus and/or mutation of cancer causing genes and their encoded proteins. Genetic rearrangements involving DNA sequences from different chromosomes or intrachromoso-mal regions have been extensively documented in various cancers, including prostate cancer (CaP) [1]. It has been reported that several ETS transcription factors play im-portant roles in CaP as a result of genetic rearrangements. Of these, overexpression of the ETS-related gene (ERG) [2,3], resulting from the fusion of ERG coding sequences to the androgen-responsiveTMPRSS2gene [4], represents the most common subtype, with a prevalence of approxi-mately 50% in clinically localized prostate cancers [1,5-11]. In addition, studies evaluating the expression ofERGin matched benign and malignant prostate tissues from a large patient cohort indicated that CaP cells harboring
TMPRSS2-ERG fusions showed overexpression of ERG
in 60-70% of patients [8]. This genomic rearrangement is now established as one of the most common mecha-nisms of oncogenic activation in CaP [6,9,12]. ERG overexpression has also been implicated in a diverse number of cancers, including Ewing’s sarcoma and acute myeloid leukemia [13-15].
A major goal in CaP is to define protein and antibody markers which may facilitate early detection, distinguish indolent from aggressive disease, define treatment strat-egies, and allow follow up of patients. The prevalence of ERGoverexpression has therefore provided an impetus for the development of detection assays for TMPRSS2-ERG mRNA in cells from tissues or urine samples from CaP patients [16,17]. Currently, real-time quantitative reverse transcription PCR (qRT-PCR), which detects the presence of TMPRSS2-ERGfusion transcripts, is routinely used in research and clinical laboratories. However, the selection of primer-probe sets used for evaluation has resulted in variable sensitivity in the detection of the respective RNA. This has led to the development of monoclonal and poly-clonal antibodies for the detection of ERG protein for diagnostic and/or therapeutic purposes [18-20]. In this re-gard, a mouse monoclonal antibody (MAb) against ERG was developed in our laboratory. One of the ERG MAb clones, 9FY, recognized an epitope formed by the amino
acid sequence GQTSKMSPRVPQQDWLSQPPARVTI,
which corresponds to residue positions 42-66 in the ERG protein [NCBI Reference Sequence: NP_891548.1] [18,21]. The 9FY monoclonal antibody was found to be highly spe-cific in the detection of ERG protein in cell culture-based experiments and human prostate cancer specimens by immunofluorescence and immunohistochemistry (IHC), respectively, without cross-reactivity to other members of the ETSfamily [18,20]. Similar observations were also reported for a rabbit monoclonal antibody using the C-terminal peptide of ERG as an immunogen [19,22].
Recent analysis of whole mount prostate sections from age and pathologic stage matched specimens from over 180 patients revealed that there is a striking difference in ERG expression in African American and Caucasian American patients [20]. Much lower fre-quencies (10-27%) of ERG alterations have been re-ported in studies from China, Japan, and India [23-26]. This overexpression of ERG protein in prostate cancer cells may result in a scenario in which the protein may also be released in body fluids, either through a non-classical secretory pathway and/or lysis of cells, provid-ing ERG as a marker associated with the distinct stage of the disease.
While IHC is ideal for the analysis of biopsied tissues from patients, assays to quantitate ERG protein are desir-able for the analysis of cells in blood and urine samples. As there are no commercially available serologic assays for ERG, there is a need to develop assays that are sensitive, accurate, and offer the flexibility of testing multiple target proteins simultaneously. Emerging targeted proteomic technologies, exemplified by the selected reaction moni-toring mass spectrometry (SRM-MS), are ideal for achieving these goals with high multiplexing capability and good reproducibility [27-29]. However, a major limitation of SRM-based targeted quantification is the lack of sufficient sensitivity for measuring low abundance proteins. To address this issue, we recently developed an antibody-independent strategy, termed high-pressure high-resolution separations with intelligent selection and multiplexing (PRISM), for significantly enhan-cing the SRM sensitivity by at least 100-fold when com-pared to conventional liquid chromatography (LC)-SRM [30-32]. More recently, PRISM-SRM assays have been utilized for accurately measuring 16 distinct peptides from various domains of TMPRSS2-ERG gene fusion products in prostate cancer cell lines and patient-derived tumor tissues [33].
Materials and methods Cell culture
Vertebral-Cancer of the Prostate (VCaP) cells, Lymph Node Carcinoma of the Prostate (LNCaP), and human embryonic kidney 293 (HEK293) cells were obtained from American Type Culture Collection (ATCC, Manassas, VA). VCaP and HEK293 cells were cultured in Dulbecco’s Modified Eagle Medium (DMEM; ATCC) supplemented with 10% fetal bovine serum (FBS; ATCC). LNCaP cells were cultured in Roswell Park Memorial Institute-1640 medium (RPMI-1640; Life Technologies, Carlsbad, CA) supplemented with 10% FBS. All cells were cultured in hu-midified conditions, at 37°C with 5% CO2.
Sample preparation
Recombinant full length ERG protein, produced in mammalian cells by exogenous expression, was pur-chased from Origene (Rockville, MD). HEK293, LNCaP, and VCaP cells were harvested by trypsinization, diluted in PBS, and counted by using a hemocytometer. HEK293 and LNCaP cells were aliquoted at 1,000,000 cells/ml into Eppendorf tubes and pelleted with or without the addition of VCaP cells. Three sample types were pre-pared: 1) Purified recombinant ERG was incrementally spiked into 1,000,000 LNCaP or HEK293 cell lysates which are negative forTMPRSS2-ERG; 2)TMPRSS2-ERG fusion positive VCaP cells were titrated into 1,000,000 LNCaP cells incrementally, and pelleted by centrifugation; 3) VCaP cells were incrementally spiked into 5 mL urine donated by female volunteers, collected as per an ap-proved IRB protocol. All samples were prepared at CPDR, and used by both PNNL and CPDR for analyses of ERG.
PRISM-SRM protein extraction and digestion
Proteins were extracted from sample types 1 and 2 (see above) directly, using a urea solution (8 M urea in 50 mM NH4HCO3); sample type 3 was first centrifuged at 4,000 ×
g for 45 min in an Amicon Ultra-4 concentrator with 10 kDa molecular weight cutoff (EMD Millipore, Billerica, MA), followed by protein extraction from the concen-trated sample using the same urea solution. Cells were sonicated for 1 min, chilled on ice for 1 min, which was repeated for a total of three times, and the protein con-centration was determined using the bicinchoninic acid (BCA) assay (Pierce, Rockford, IL). Proteins in each sample were reduced with 10 mM dithiothreitol at 37°C for 1 h and alkylated using 40 mM iodoacetamide at room temperature for 1 h in the dark. Samples were then diluted 10-fold with 50 mM NH4HCO3 and 1 M
CaCl2 was added to each sample to reach a final
con-centration of 1 mM. Protein digestion was performed at 37°C for 3 h using trypsin (Affymetrix, Santa Clara, CA) at a 1:50 enzyme-to-substrate ratio (w/w). Each sample was desalted using a Discovery DSC-18 C18 SPE
column (SUPELCO, Bellefonte, PA) and concentrated to a volume of ~50 μL. The peptide concentration was measured using the BCA assay.
SRM assay development
Seven proteotypic peptides of ERG protein were selected and stable isotope-labeled heavy peptides with C-terminal [13C615N2] lysine or [13C615N4] arginine were synthesized
(ThermoFisher Scientific, Waltham, MA) for SRM assay development [33]. SRM parameters were optimized by dir-ect infusion experiments on a TSQ Quantum Ultra triple quadrupole mass spectrometer (ThermoFisher Scientific), where the 6-8 most intense fragment ions for each peptide were selected as precursor-to-fragment transitions and the collision energy (CE) of each transition was optimized automatically in SRM mode. The peptides were dissolved in a buffer containing 50% acetonitrile and 0.1% formic acid, and the infusion rate was 300 nL/min. The transitions and corresponding optimal CE values from the infusion experiments were further validated for optimal detec-tion of the target peptides in actual LC-SRM analysis. In this step 50 fmol/μL of heavy peptide standards were spiked with 0.5μg/μL of VCaP-derived tryptic peptides, and 2μL of the sample was analyzed using a nanoAC-QUITY UPLC® system (Waters Corporation, Milford, MA) and a TSQ Vantage triple quadrupole mass spec-trometer (ThermoFisher Scientific). Transitions with lower intensity or higher level of interference were re-moved, and the three best transitions were retained for each peptide in developing the final SRM assays.
PRISM fractionation
voltage of 35 V, a skimmer offset voltage of−5 V, and a capillary inlet temperature of 220°C. Tube lens voltages were obtained from automatic tuning and calibration without further optimization. Both Q1 and Q3 were set at unit resolution of 0.7 FWHM and Q2 gas pressure was 1.5 mTorr. A scan width of 0.002m/z and a dwell time of 10 ms were used. The remaining fraction of the capillary column eluate, flowing at a rate of 3μL/min, was automat-ically collected every 1 min into a 96-well plate using a Triversa NanoMate® system (Advion BioSciences, Ithaca, NY) over the course of ~100 min LC separation. Prior to peptide fraction collection, 17 μL of water was added to each well in the plate to avoid peptide loss and also to di-lute the peptide fraction for LC-SRM analysis. The frac-tion containing a target peptide was intelligently selected based on the retention time of the peptide obtained by on-line monitoring. The detailed method for intelligent selec-tion was described in our previous study [30,32].
LC-SRM analysis
Following high pH capillary reversed-phase LC (RPLC) separation and intelligent selection, the fractions con-taining the target peptides were subjected to conven-tional LC-SRM analysis. All peptide fractions were analyzed using a nanoACQUITY UPLC® system coupled on-line to a TSQ Vantage triple quadrupole mass spec-trometer. The UPLC® system was equipped with a nanoACQUITY UPLC BEH 1.7μm C18 column (100μm i.d. × 10 cm), which was connected to a chemically etched 20μm i.d. fused-silica emitter via a stainless steel union. Four microliters of each peptide fraction were loaded onto the column at a flow rate of 1 μL/min for 5 min. Peptides were separated at a flow rate of 500 nL/ min, using a 10-min gradient from 10-35% acetonitrile in water. The TSQ Vantage was operated in the same manner as the TSQ Quantum Ultra. The raw data ac-quired on the TSQ Vantage triple quadrupole MS were imported into Skyline software [34] for visualization of chromatograms of target peptides and to quantify the detected peptides. The most abundant transition for each peptide was used for quantification unless interfer-ence was observed. Peak detection and integration were based on two criteria: 1) the same retention time; and 2) approximately the same relative peak intensity ratios across multiple transitions between light peptide and heavy peptide standards. All data were manually inspected to ensure correct peak detection and accurate integration. Light to heavy peak area ratios were used to quantify target peptides.
ELISA assay
An ELISA was developed for use in detection of ERG protein in biospecimens, including body fluids such as sera and urine. Purified recombinant ERG protein was
used as a source of antigen for development. Different combinations of antibodies were used as capture and de-tection reagents in an antigen capture assay, or sandwich ELISA, to select for optimal reactivity. ELISA procedures using cell lysates were carried out in NUNC 96-well flat bottom Maxisorp plates (Thermo Scientific, Rockford, IL). Plates were coated with 1μg/mL of ERG MAb 9FY, using 100 μL coating buffer (50 mM NaHCO3, pH 9.6).
The reactions were carried out in duplicate. The plates were covered with microplate sealers (Thermo Scientific) and incubated at 4°C overnight. The next day, plates were washed 4 times with wash buffer (1X PBS + Tween-20; KD Medical, Columbia, MD) and blocked with 200 μL blocking buffer (StartingBlock; Thermo Scientific), covered, and incubated for 1 h at room temperature (RT). Each set of cell samples were lysed through 5 freeze-thaw cycles in a dry ice/methanol bath, followed by sonication at 35% amplitude with 15 s pulses for 10 min. Following pre-clearing by centrifugation (13,000 ×g for 10 min), lysates (100 μL) were loaded onto plates after washing once post-blocking, covered, and incubated for 1 h at 37°C. Plates were washed 4 times with wash buffer, and incubated with 100 μL bio-tinylated ERG antibody (2μg/mL; Origene), covered for 1 h at 37°C. Plates were again washed 4 times with wash buffer and then incubated with 100 μL of Streptavidin-HRP conjugated antibody diluted as per manufacturer’s protocols (KPL Inc., Gaithersburg, MD), covered for 1 h at 37°C. Plates were washed 4 times with wash buffer, 100 μL of K-Blue Aqueous TMB substrate (Neogen, Lexington, KY) was added to the plates, and incubated uncovered for 30 min at RT. Sulfuric acid (2 N, 100μL) was added to the plates post-incubation to stop the reac-tions. Plates were immediately read at 450 nm to meas-ure absorbance. All dilutions of reagents were performed in ELISA diluent (20% NGS in 1X PBS with 0.1% Triton-X 100).
Western blot
with specific antibodies against ERG (ERG MAb 9FY; Biocare Medical Inc., Concord, CA), and GAPDH (Santa Cruz biotechnology, Santa Cruz, CA). Membranes were washed in Tris-Buffered Saline + Tween 20 (TBST) before incubation with appropriate secondary antibodies (goat anti-Mouse IRDye 800CW or goat anti-Rabbit IRDye 680CW, LI-COR). Signals of proteins detected were visu-alized and quantitatively measured using the Odyssey infra-red imaging scanner and software (LI-COR).
Quantitative RT-PCR
RNA was isolated from cell pellets using RNeasy RNA Iso-lation Kit (Qiagen, Germantown, MD). The total amount of RNA isolated was used for reverse transcription (RT) for a final volume of 20μL of cDNA, and real-time qRT-PCR (TaqMan) was performed using 5μL of the cDNA. TaqMan primers and probe for quantitative evaluation of ERG3 were as follows: forward: 5′-CAGGTCCTTCTT
GCCTCCC-3′; reverse: 5′-TATGGAGGCTCCAATTGA
AACC-3′; probe: 5′-FAM-TGTCTTTTATTTCTAGCC
CCTTTTGGAACAGGA-TAMRA-3′. The expression of
glyceraldehyde 3-phosphate dehydrogenase (GAPDH) was used as an endogenous control gene in each reaction (Applied Biosystems, Grand Island, NY). RNA samples without reverse transcription were included as negative controls in each assay. Results are represented by the aver-age Ct values from individual runs.
NanoString platform RNA isolation and assessment
Pellets from VCaP-spiked female urine and VCaP-spiked LNCaP cell mixture were resuspended in 100 μL of extraction buffer. RNA was isolated using a PicoPure RNA isolation kit (Life Technologies), according to man-ufacturer’s protocols. RNA quality was measured using a Bioanalyzer 2100 (Agilent Technologies, Palo Alto, CA) and a NanoDrop ND-100 spectrophotometer (Thermo Scientific).
NanoString nCounter analysis
RNA isolated from each sample was input for NanoString nCounter analysis (NanoString Technologies, Seattle, WA). Hybridization and NanoString nCounter were processed according to manufacturer’s protocols reported previously [35,36]. In brief, hybridizations were carried at 65°C for 20 h, after which the hybridization products were applied to the nCounter Preparation Station for automated removal of excess probe and immobilization of probe-transcript complexes on a streptavidin-coated cartridge. Data were collected using the nCounter Digital Analyzer by count-ing the individual barcodes. Data were analyzed uscount-ing the nCounter™digital analyzer software (Version 2.1.1). The raw data were normalized through the following two steps: 1) The geometric mean of spiked-in exogen-ous positive controls was used to correct for differences resulting from assay efficiency (hybridization, purification,
binding, etc.); 2) Spiked-in negative controls were used to remove hybridization background. All signals below mean background +2 standard deviations (SD) were considered as hybridization background and subtracted from the raw data.
Results
PRISM-SRM detection of recombinant ERG protein spiked into LNCaP cells
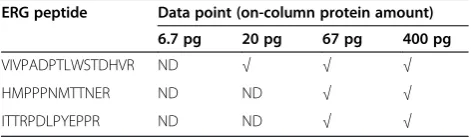
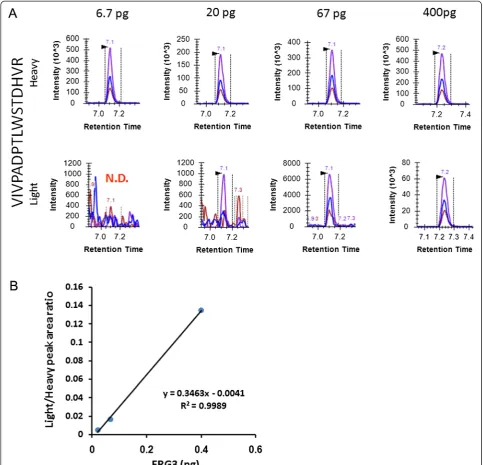
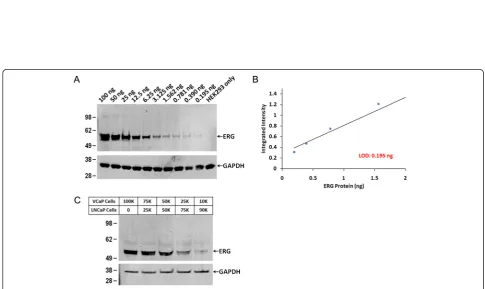
To define ERG detection sensitivity in cells, purified re-combinant ERG3 protein (30, 100, 300, 1000, 6000 pg) was spiked into 1,000,000TMPRSS2-ERGnegative LNCaP cells and analyzed by PRISM-SRM. After cell lysis, tryptic diges-tion and sample clean-up, 1/15 of each sample was used for PRISM-SRM analysis. Three ERG peptides were con-sistently detected, with peptide VIVPADPTLWSTDHVR (residues 125-160 in the predicted amino acid sequence of ERG3) displaying the best response (Table 1). Using this peptide, ERG3 protein could be detected at levels as low as 20 pg (Table 1 and Figure 1A). The response curve showed excellent linearity in the detected spiking range: 300-6,000 pg ERG3 protein spiked into 1,000,000 LNCaP cells (Figure 1B).
PRISM-SRM detection of ERG protein in the VCaP-LNCaP mixed cells
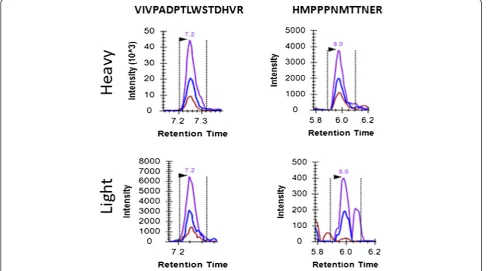
TMPRSS2-ERG positive VCaP cells (0, 10, 100, 1,000, 10,000, and 100,000) were incrementally spiked into 1,000,000 LNCaP cells to simulate prostate tumor tissue samples, which contain mixtures of tumor and non-malignant stroma, and 1/10 of each sample was analyzed using PRISM-SRM. In these samples two ERG peptides, VIVPADPTLWSTDHVR (amino acid positions 125-140) and HMPPPNMTTNER (amino acid positions 112-123), were confidently detected from samples corresponding to 10,000 VCaP cells (Table 2). Extracted ion chromato-grams (XICs) of the two peptides are shown in Figure 2.
PRISM-SRM detection of ERG protein in the VCaP-urine system
[image:5.595.304.540.648.717.2]VCaP cells (0, 1,000, 5,000, 10,000, 20,000, 50,000, 100,000, and 1,000,000) were spiked into 5 mL of human female urine to simulate prostate cancer urine sediment samples, and analyzed using PRISM-SRM. Due to the limited total
Table 1 Detection of recombinant ERG3 protein spiked into LNCaP cells using PRISM-SRM
ERG peptide Data point (on-column protein amount)
6.7 pg 20 pg 67 pg 400 pg
VIVPADPTLWSTDHVR ND √ √ √
HMPPPNMTTNER ND ND √ √
ITTRPDLPYEPPR ND ND √ √
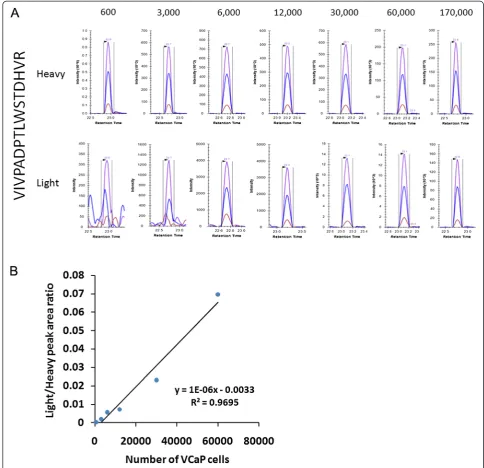
protein content (i.e., the low yield of urinary proteins from urine samples) in these samples, 60% of each sample (as opposed to 1/10) was used for the analysis, except for the highest concentration data point sample (where 1/6 of the sample was used for the analysis). The results showed that four ERG peptides were detected and peptide VIV-PADPTLWSTDHVR had the best response, which is con-sistent with the above observations (Table 3). XICs of VIVPADPTLWSTDHVR showed that this peptide could
Figure 1Detection of ERG peptide VIVPADPTLWSTDHVR from LNCaP cells.Different amounts of recombinant ERG3 protein (6.7 pg, 20 pg, 67 pg, 400 pg) was spiked into LNCaP cells.A. XICs of peptide VIVPADPTLWSTDHVR from the different data points. Heavy indicate heavy internal standard peptide; Light indicate endogenous peptide. N.D.: not detected.B. Response curve.
Table 2 Detection of ERG protein in VCaP cells spiked into LNCaP cells using PRISM-SRM
ERG peptide Data point (number of VCaP cells)
1 10 100 1000 10000
VIVPADPTLWSTDHVR ND ND ND ND √
HMPPPNMTTNER ND ND ND ND √
[image:6.595.55.292.661.717.2]be detected and quantified from as low as 600 VCaP cells (Figure 3A). Based on the peak area ratio of this ERG pep-tide and the concentration of heavy peppep-tide standard, the abundance of ERG protein was estimated as ~18,000 cop-ies per VCaP cell, i.e., 1.8 fg per cell. The response curve of the best detected peptide, VIVPADPTLWSTDHVR, again showed good linearity (Figure 3B).
Detection of ERG protein by ELISA
For the development of an in-house ELISA for ERG pro-tein detection, we initially tested the affinity of several anti-bodies available against ERG protein. The reactivity data indicated that the ERG MAb 9FY antibody showed high af-finity when compared to antibodies from Epitomics, Ori-gene, and Santa Cruz (Figure 4A). As the sandwich ELISA format requires two antibodies that recognize the ERG
[image:7.595.56.545.91.362.2]protein at non-overlapping sites, we used recombinant ERG protein to test a series of antibody combinations for the capture and detection of ERG. Our results showed that a combination of ERG MAb 9FY for capture and Origene ERG biotinylated antibody (Clone 5 F12) has high sensitiv-ity for detecting ERG protein (Figure 4B). We utilized this specific antibody combination for generating a standard curve for the detection of ERG protein (Figure 4C), as well as defining the limit of detection for ERG, which was found to be 30 pg. The results showed a linear relationship with respect to the concentration of ERG protein and absorb-ance values noted. A similar linear relationship was ob-served with recombinant ERG spiked into cell lysates. However, cell lysates from the VCaP-LNCaP mixed cell population did not yield quantifiable ERG data using ELISA methods, presumably due to an overabundance of
Figure 2Detection of ERG protein in the VCaP-LNCaP system.XICs of the two ERG peptides detected from ~ 10,000 VCaP cells. Heavy indicates heavy internal standard peptide; Light indicates endogenous peptide.
Table 3 Detection of ERG protein in VCaP cells spiked into human female urine
ERG peptide Data point (number of VCaP cells)
0 600 3000 6000 12000 30000 60000 170000
VIVPADPTLWSTDHVR ND √ √ √ √ √ √ √
HMPPPNMTTNER ND ND ND √ √ √ √ √
MVGSPDTVGMNYGSYMEEK ND ND ND ND ND ND √ √
ITTRPDLPYEPPR ND ND ND ND ND ND ND √
[image:7.595.56.542.635.718.2]cellular protein (data not shown). Therefore, we utilized the sandwich ELISA to evaluate detection limit of ERG protein in VCaP cells directly (without mixing with LNCaP cells). The number of VCaP cells considered for analysis included: 1,000, 5,000, 10,000, 15,000, 20,000, 30,000, 40,000, 50,000, 75,000 and 100,000. The results indicated that the limit of detection was 10,000 cells (Figure 4D). Based on the ERG protein quantification results derived from the 20,000-cell data point, the absolute concentration of ERG approximates 9 fg per cell.
Detection of ERG protein by western blot
[image:8.595.54.539.89.557.2]To assess the detection limit of ERG protein by western blot, we used the HEK293 cell line, which lacks expres-sion of TMPRSS2-ERG. Recombinant ERG protein was added to 15 μg equivalent of HEK293 cell lysate in the following amounts: 100, 50, 25, 12.5, 6.25, 3.125, 1.562, 0.781, 0.390 and 0.195 ng. As expected, a band corre-sponding to 55 kDa was noted in all the cell lysates spiked with recombinant ERG protein except for the control (Figure 5A). The intensity of the signal was
Figure 4Detection of ERG protein using ELISA. A. Evaluation of ERG antibody reactivity in the ELISA format.B. Capture and detection antibody combinations for development of antigen capture assay (sandwich ELISA).C. The limit of detection of purified recombinant ERG protein was 30 pg.D. The limit of detection of ERG protein from VCaP cell lysates (without mixing with LNCaP cells) was 10,000 cells.
[image:9.595.54.540.390.679.2]quantified using Odyssey Infrared Imaging System (LI-COR). The four highest dilutions were presented as scat-ter plot in Figure 5B. This showed that the limit of detection was 195 pg of the recombinant ERG protein. We then quantified endogenous ERG protein present in VCaP cells (10,000 to 100,000) mixed with ERG negative LNCaP cells (the overall cell number was kept constant at 100,000). The results showed that ERG protein signal was detected in as little as 10,000 VCaP cells (Figure 5C). The analysis of the signals through scanning densitom-etry revealed that the signal from 10,000 VCaP cells cor-responds approximately to 440 pg of ERG based on the standard curve.
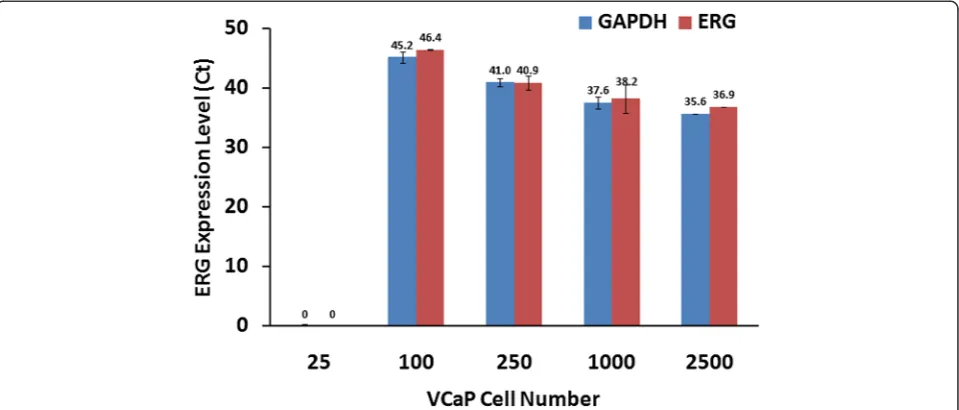
Detection ofERG3mRNA by qRT-PCR
In an effort to evaluate the detection limit ofERGat the mRNA level with respect to cell number, we utilized TMPRSS2-ERG fusion harboring VCaP cells. The VCaP-LNCaP mixed cell population was not amenable for the assay due to high RNA concentrations in a relatively small sample size, thus we utilized urine samples incre-mentally spiked with VCaP cells.ERG3,the longest func-tional splice form of ERG, was consistently detected from cDNA corresponding to as few as 100 VCaP cells. The Ct values of the internal control, GAPDH, corre-sponded with ERG values, and both became progres-sively lower as cell numbers increased (Figure 6).
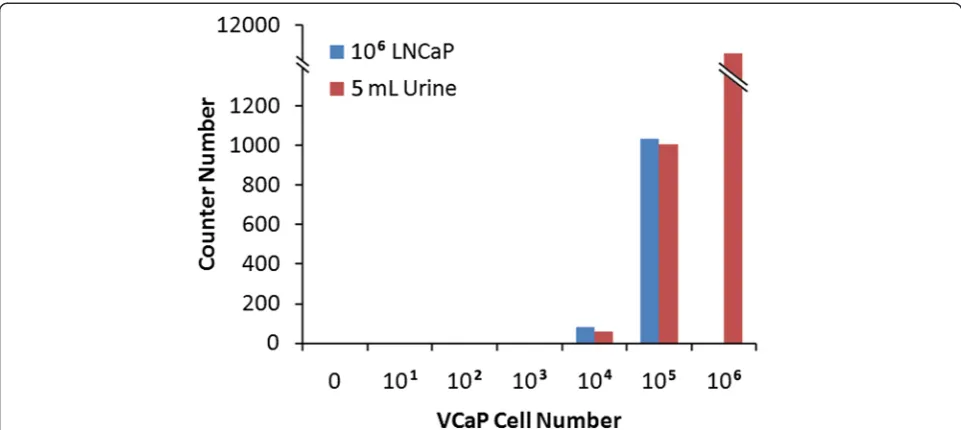
Detection ofERG3by NanoString
RNA extracted from the LNCaP-VCaP mixed cell sam-ple showed high quality RNA with the median RNA in-tegrity number (RIN) of 8.7 (range 8.3-9.0) and 260/280 of 1.84 (range 1.84-2.03), respectively. However, VCaP
cells spiked urine samples failed measurement by both the Bioanalyzer (Nanochip) and Nanodrop, showing an undetectable RIN or 260/280 (Table 4). However, all of the RNA isolated from each sample was used for hybridization, therefore, analysis ofERGwas not affected by RNA assessment and the NanoString readout directly correlated with the initial number of cells in each sam-ple. Figure 7 shows that the NanoString detected the highest level ofERG(copy number) in urine spiked with one million VCaP cells (~11,000 copies, lower panel). Around 1,000 copies of ERG were detected in both LNCaP cells and urine samples spiked with 100,000 VCaP cells, while 81 and 57 copies ofERGwere detected in LNCaP cells and urine spiked with 10,000 VCaP cells, respectively (Table 5). Given that the number of RNA copies detected was decreased by almost the identical fold change of VCaP cell numbers, ERG should be de-tected for both LNCaP cells and urine spiked with 1,000 VCaP cells by the NanoString nCounter system, with around 5 copies each. The lack of ERG detection from both of these cell preparations might result from our stringent background subtraction in which we removed all signals below mean background + 2 standard devia-tions (median of SD = 5). Extrapolating from the above results, we should be able to detect around 25 copies of RNA in 5000 VCaP cells (1/2 fold of the number from 10, 000 VCaP cells), by the NanoString from both spiked LNCaP cells and urine.
Discussion
[image:10.595.59.539.501.706.2]The discovery of fusion transcripts involvingERGcoding sequences andTMPRSS2promoter sequences has eluci-dated a role forERGin the initiation and progression of
prostate cancer in a subset of patients. PSA screening has been used as a diagnostic test for prostate cancer since the 1990s. Although this is a convenient assay using blood samples, the specificity of the assay is only around 20% [15,16]. This has led to frequent overtreat-ment and its related consequences. This scenario has also spurred significant interest in the search for new and highly specific biomarkers for the detection of pros-tate cancer. In this regard, tests involving various forms of PSA have also been utilized with moderate success.
The detection of ERG protein expression in biopsied tis-sues from prostate cancer patients using the highly specific ERG MAb 9FY has been valuable for the stratification of
[image:11.595.58.541.100.296.2]prostate cancer. Several laboratories, including ours, have shown that ERG expression is detected only in prostate tumor tissue and not in matched controls, consistent with studies showing low/undetectable levels of expression of endogenous ERG protein in prostate epithelial cells [18,19]. It has also been demonstrated that PRISM-SRM detects ERG protein only in theTMPRSS2-ERGfusion positive tu-mors, and not in the TMPRSS2-ERG fusion negative tu-mors [33]. Recently, we have completed a study involving 1000 prostate whole mount specimens and the results con-firmed our earlier observations ([20]; unpublished data). In addition, there is a striking population difference as Caucasian Americans registered ERG expression in about
Table 4 RNA assessment by Bioanalyzer and Nanodrop
Sample Bioanalyzer Nanodrop
ng/mL RIN Total RNA (ng) ng/mL 260/280 Total RNA (ng)
106LNCaP 100 8.3 2800 110 1.93 3080
106LNCaP + 101VCaP 540 8.6 15120 513 1.96 14364
106LNCaP + 102VCaP 280 8.9 7840 302 1.91 8456
106LNCaP + 103VCaP 350 9 9800 393 1.84 11004
106LNCaP + 104VCaP 350 8.6 9800 333 2.03 9324
106LNCaP + 105VCaP 250 8.8 7000 277 1.9 7756
5 mL Urine 30 ND 840 11 ND 308
5 mL Urine + 102VCaP 30 ND 840 6 ND 168
5 mL Urine + 103VCaP 10 ND 280 8 ND 224
5 mL Urine + 104VCaP 80 ND 2240 9 ND 252
5 mL Urine + 105VCaP 10 ND 280 22 ND 616
5 mL Urine + 106VCaP 130 ND 3640 83 ND 2324
ND indicates that a reading was not detected.
[image:11.595.57.538.490.705.2]50% of patients compared to a relatively low level of expres-sion in African Americans (25%) [20,23].
The analysis of biopsied tissues is currently carried out by IHC which is labor intensive and, for the most part, qualitative rather than quantitative in nature. Quantita-tive approaches, based on either a single or a combin-ation of biomarkers, are therefore desirable for the diagnosis and prognosis of prostate cancer. Considering this, we sought to develop assays for assessing the level of ERG oncoprotein in cells from multiple sample types including tissue and urine sediment. Such assays are likely to be useful in clinical applications such as patient stratification. For example, it is well known that prostate cancer cells are present in urine/post-DRE urine samples of patients, due to manual manipulation of the prostate, which represent a truly non-invasive source for analysis [37]. In comparison to analysis involving tissues contain-ing endothelial cells in addition to prostate tumor cells as a source of analysis, the cells present in the post-DRE urine may be mostly devoid of endothelial cells. In such a scenario, the observed ERG signal could be attributed to its expression from tumor cells. Recently, the FDA approved the PCA3 urine test based on RNA evaluation, which is used in the context of making decisions about repeat biopsies [38]. Along the same line, cells in urine samples could be tested for the presence of ERG oncoprotein.
Several different technologies were evaluated for quan-tification of ERG protein with the goal of identifying their detection limit. Commercially available purified recombinant ERG protein, established prostate cancer cell lines VCaP (TMPRSS2-ERG fusion positive) and LNCaP (TMPRSS2-ERG fusion negative), and female urine were used to prepare three types of samples mim-icking cell lines, tissues, and urine sediments for the analysis. It is worth noting that the antibody-free, MS-based PRISM-SRM assay enables the detection of 20 pg of recombinant ERG protein spiked into LNCaP cell lysate. In a mixed cell population model containing a constant number (1,000,000) of LNCaP cells with an incremental number of VCaP cells, the assay was able to detect and quantify ERG protein in 10,000 VCaP cells. Interestingly, the same assay detected ERG protein in as few as 600 VCaP cells spiked into female urine samples. This sensitivity difference between the mixed cell line
samples and the female urine is most likely because the spiked urine sample has less total protein content than the mixed VCaP/LNCaP cell line sample, hence, when the same amount of peptides from these two different sample types were injected for PRISM-SRM analysis, the effective loading of ERG is increased, and the back-ground (i.e., matrix effects) is reduced in the simulated urine sediment samples.
In addition to developing antibody-free assays for the quantification of ERG protein, we have also compared the sensitivity of both protein and RNA detection methods. The detection limit of the former assay, using ERG MAb 9FY as the capture antibody in ELISA, was in the range of 30 pg of recombinant ERG. It should be noted that the 9FY antibody recognizes an epitope at the amino terminus of the ERG protein and has the poten-tial to detect protein encoded by allTMPRSS2-ERG vari-ants. The limit of detection for western blot analysis was approximately 195 pg of recombinant ERG protein. Thus, PRISM-SRM at a 20 pg detection limit was the most sensitive of the three methods. With regard to the detection of cells expressing ERG, both ELISA and west-ern blot methods exhibited the sensitivity of detecting 10,000 VCaP cells, the same as the PRISM-SRM assay. The comparison studies were also expanded to include methods detecting mRNA by qRT-PCR and NanoString. Quantitative RT-PCR showed high sensitivity as it was able to detect RNA from a minimum of 100 VCaP cells spiked in female urine. It should be pointed out that our RNA detection method utilized total RNA without in-volving a pre-amplification step in the analysis. While the NanoString has the advantage of analyzing the ex-pression of multiple genes simultaneously, it was found to be less sensitive than qRT-PCR assay, as it detected RNA from 10,000 VCaP cells spiked into LNCaP cells. Several factors may contribute to the differences in sen-sitivity with respect to detection limit in the analysis of the mixed VCaP/LNCaP cells and VCaP spiked urine samples. These include: i) dilution of ERG protein in a mixed cell population model; ii) the lysis of cells involv-ing freeze-thaw and sonication methods; iii) differences in the stability and half-life of the analytes; and iv) limi-tation of the sensitivity of capturing and detection anti-bodies in ELISA.
Conclusions
[image:12.595.57.291.113.167.2]In summary, the data presented here suggest that qRT-PCR and PRISM-SRM platforms are highly sensitive in detecting TMPRSS2-ERG transcripts and proteins, re-spectively. Compared to other RNA and protein detec-tion technologies, the PRISM-SRM assay has several significant advantages: it is not affected by RNA stability, it does not rely on a specific antibody, and it is ideal for isoform-specific detection with high multiplexing
Table 5 Detection of ERG in VCaP cells spiked into LNCaP cells and human female urine using NanoString nCounter
Spiked Sample
Number of VCaP Cells
0 101 102 103 104 105 106
106LNCaP ND ND ND ND 81.85 1033.8 ND
5 mL Urine ND ND ND ND 57.55 1004.12 10945.38
capability (e.g., multiplexed quantitative analysis of ERG3 and ERG8 isoforms; data not shown). Therefore, PRISM-SRM assays can be adapted to detect ERG protein in cells present in clinical specimens (e.g., tissue, post-DRE urine, and circulating tumor cells in blood), and cell-free ERG protein present in the blood sera, providing an opportunity for its use in the clinical setting for detec-tion in prostate cancer patients, and define treatment strategies in accordance.
Abbreviations
CaP:Prostate cancer; ERG: ETS-related gene; PSA: Prostate specific antigen; qRT-PCR: Quantitative reverse transcription polymerase chain reaction; MAb: Monoclonal antibody; IHC: Immunohistochemistry; SRM-MS: Selected reaction monitoring mass spectrometry; PRISM: High-pressure high-resolution separations with intelligent selection and multiplexing; LC: Liquid chromatography; ELISA: Enzyme-linked immunosorbent assay;
VCaP: Vertebral-Cancer of the Prostate; LNCaP: Lymph Node Carcinoma of the Prostate; HEK293: Human embryonic kidney 293; DMEM: Dulbecco’s Modified Eagle Medium; FBS: Fetal bovine serum; BCA: Bicinchoninic acid; CE: Collision energy; M-PER: Mammalian Protein Extraction Reagent; TBST: Tris-Buffered Saline + Tween 20; RT: Reverse transcription; GAPDH: Glyceraldehyde 3-phosphate dehydrogenase; XIC: Extracted ion chromatograms; RIN: RNA integrity number.
Competing interests
The authors declare that they have no competing interests.
Authors’contributions
TL, JH, DGC, AR, S-H T, WY, GP, AD, SS, JK, SS and AS designed the experiments. JH, AAS, TS, CW, TLF, YG, AR, S-H T, WY, AAM, WH, and SB performed the quality control assays and experiments. JH, TL, DGC, KDR, W-J Q, AR, S-H T, WY, GP, AD and AS analyzed and interpreted the data. JH, TL, TS, DGC, KDR, W-J Q, RDS, AR, S-H T, WY, SS, JK, SS, DGM, SS, GP, AD and AS contributed to the discussion and preparation of the manuscript. All authors have read and approved the manuscript.
Acknowledgements
Portions of this work were supported by the National Cancer Institute (NCI) Early Detection Research Network (EDRN) Interagency Agreement ACN12003-001-00000 (to K.D.R. and D.G.C.) and National Institutes of Health grant P41GM103493 (to R.D.S.), as well as the DoD/CDMRP/PCRP grant PC073614 (to S.S.) and the NCI/EDRN ACN12011-001-0 (to S.S.). The experimental work described herein was performed in the Environmental Molecular Sciences Laboratory, a national scientific user facility sponsored by the Department of Energy and located at Pacific Northwest National Laboratory, which is operated by Battelle Memorial Institute for the Department of Energy under Contract DE-AC05-76RL0 1830, as well as The Center for Prostate Disease Research, under the Basic Science Research Program under the Department of Surgery, at the Uniformed Services University of the Health Sciences.
DoD Disclaimer
The opinions and assertions contained herein represent the personal views of the authors and are not to be construed as official or as representing the views of the Department of the Army, the Department of Defense, or the United States Government.
Author details 1
Biological Sciences Division, Pacific Northwest National Laboratory, Richland, WA, USA.2Environmental Molecular Sciences Laboratory, Pacific Northwest
National Laboratory, Richland, WA, USA.3Center for Prostate Disease Research, Department of Surgery, Uniformed Services University of the Health Sciences, Bethesda, MD, USA.4Cancer Biomarkers Research Group, Division of Cancer Prevention, National Cancer Institute, Bethesda, MD, USA.
5
Urology Service, Walter Reed National Military Medical Center, Bethesda, MD, USA.
Received: 21 November 2014 Accepted: 23 January 2015
References
1. Albertson DG, Collins C, McCormick F, Gray JW. Chromosome aberrations in solid tumors. Nat Genet. 2003;34(4):369–76.
2. Rao VN, Papas TS, Reddy ES. Erg, a human ets-related gene on chromosome 21: alternative splicing, polyadenylation, and translation. Science. 1987;237 (4815):635–9.
3. Reddy ES, Rao VN, Papas TS. The erg gene: a human gene related to the ets oncogene. Proc Natl Acad Sci U S A. 1987;84(17):6131–5.
4. Lin B, Ferguson C, White JT, Wang S, Vessella R, True LD, et al. Prostate-localized and androgen-regulated expression of the membrane-bound serine protease TMPRSS2. Cancer Res. 1999;59(17):4180–4.
5. Ernst T, Hergenhahn M, Kenzelmann M, Cohen CD, Bonrouhi M, Weninger A, et al. Decrease and gain of gene expression are equally discriminatory markers for prostate carcinoma: a gene expression analysis on total and microdissected prostate tissue. Am J Pathol. 2002;160(6):2169–80. 6. Kumar-Sinha C, Tomlins SA, Chinnaiyan AM. Recurrent gene fusions in
prostate cancer. Nat Rev Cancer. 2008;8(7):497–511.
7. Mani RS, Iyer MK, Cao Q, Brenner JC, Wang L, Ghosh A, et al. TMPRSS2-ERG-mediated feed-forward regulation of wild-type ERG in human prostate cancers. Cancer Res. 2011;71(16):5387–92.
8. Petrovics G, Liu A, Shaheduzzaman S, Furusato B, Sun C, Chen Y, et al. Frequent overexpression of ETS-related gene-1 (ERG1) in prostate cancer transcriptome. Oncogene. 2005;24(23):3847–52.
9. Tomlins SA, Rhodes DR, Perner S, Dhanasekaran SM, Mehra R, Sun XW, et al. Recurrent fusion of TMPRSS2 and ETS transcription factor genes in prostate cancer. Science. 2005;310(5748):644–8.
10. Vanaja DK, Cheville JC, Iturria SJ, Young CY. Transcriptional silencing of zinc finger protein 185 identified by expression profiling is associated with prostate cancer progression. Cancer Res. 2003;63(14):3877–82. 11. Zammarchi F, Boutsalis G, Cartegni L. 5' UTR control of native ERG and of
Tmprss2:ERG variants activity in prostate cancer. PLoS One. 2013;8(3):e49721. 12. Rubin MA, Maher CA, Chinnaiyan AM. Common gene rearrangements in
prostate cancer. J Clin Oncol. 2011;29(27):3659–68.
13. Clark J, Merson S, Jhavar S, Flohr P, Edwards S, Foster CS, et al. Diversity of TMPRSS2-ERG fusion transcripts in the human prostate. Oncogene. 2007;26(18):2667–73.
14. Sementchenko VI, Schweinfest CW, Papas TS, Watson DK. ETS2 function is required to maintain the transformed state of human prostate cancer cells. Oncogene. 1998;17(22):2883–8.
15. Rahim S, Uren A. Emergence of ETS transcription factors as diagnostic tools and therapeutic targets in prostate cancer. Am J Transl Res. 2013;5(3):254–68.
16. Prensner JR, Rubin MA, Wei JT, Chinnaiyan AM. Beyond PSA: the next generation of prostate cancer biomarkers. Sci Transl Med.
2012;4(127):127rv123.
17. Tomlins SA, Aubin SM, Siddiqui J, Lonigro RJ, Sefton-Miller L, Miick S, et al. Urine TMPRSS2:ERG fusion transcript stratifies prostate cancer risk in men with elevated serum PSA. Sci Transl Med. 2011;3(94):94ra72.
18. Furusato B, Tan SH, Young D, Dobi A, Sun C, Mohamed AA, et al. ERG oncoprotein expression in prostate cancer: clonal progression of ERG-positive tumor cells and potential for ERG-based stratification. Prostate Cancer Prostatic Dis. 2010;13(3):228–37.
19. Park K, Tomlins SA, Mudaliar KM, Chiu YL, Esgueva R, Mehra R, et al. Antibody-based detection of ERG rearrangement-positive prostate cancer. Neoplasia. 2010;12(7):590–8.
20. Rosen P, Pfister D, Young D, Petrovics G, Chen Y, Cullen J, et al. Differences in frequency of ERG oncoprotein expression between index tumors of Caucasian and African American patients with prostate cancer. Urology. 2012;80(4):749–53.
21. Rastogi A, Tan SH, Banerjee S, Sharad S, Kagan J, Srivastava S, et al. ERG monoclonal antibody in the diagnosis and biological stratification of prostate cancer: delineation of minimal epitope, critical residues for binding, and molecular basis of specificity. Monoclon Antib Immunodiagn Immunother. 2014;33(4):201–8.
23. Farrell J, Young D, Chen Y, Cullen J, Rosner IL, Kagan J, et al. Predominance of ERG-negative high-grade prostate cancers in African American men. Mol Clin Oncol. 2014;2(6):982–6.
24. Magi-Galluzzi C, Tsusuki T, Elson P, Simmerman K, LaFargue C, Esgueva R, et al. TMPRSS2-ERG gene fusion prevalence and class are significantly different in prostate cancer of Caucasian. Afr Am Japan Patients Prostate. 2011;71(5):489–97.
25. Rawal S, Young D, Williams M, Colombo M, Krishnappa R, Petrovics G, et al. Low frequency of the ERG oncogene alterations in prostate cancer patients from India. J Cancer. 2013;4(6):468–72.
26. Mao X, Yu Y, Boyd LK, Ren G, Lin D, Chaplin T, et al. Distinct genomic alterations in prostate cancers in Chinese and Western populations suggest alternative pathways of prostate carcinogenesis. Cancer Res. 2010;70(13):5207–12.
27. Shi T, Su D, Liu T, Tang K, Camp 2nd DG, Qian WJ, et al. Advancing the sensitivity of selected reaction monitoring-based targeted quantitative proteomics. Proteomics. 2012;12(8):1074–92.
28. Lange V, Picotti P, Domon B, Aebersold R. Selected reaction monitoring for quantitative proteomics: a tutorial. Mol Syst Biol. 2008;4:222.
29. Picotti P, Aebersold R. Selected reaction monitoring-based proteomics: workflows, potential, pitfalls and future directions. Nat Meth. 2012;9(6):555–66.
30. Shi T, Fillmore TL, Sun X, Zhao R, Schepmoes AA, Hossain M, et al. Antibody-free, targeted mass-spectrometric approach for quantification of proteins at low picogram per milliliter levels in human plasma/serum. Proc Natl Acad Sci U S A. 2012;109(38):15395–400.
31. Shi T, Qian WJ. Antibody-free PRISM-SRM for multiplexed protein quantification: is this the new competition for immunoassays in bioanalysis? Bioanalysis. 2013;5(3):267–9.
32. Shi T, Sun X, Gao Y, Fillmore TL, Schepmoes AA, Zhao R, et al. Targeted quantification of low ng/mL level proteins in human serum without immunoaffinity depletion. J Proteome Res. 2013;12(7):3353–61. 33. He J, Sun X, Shi T, Schepmoes AA, Fillmore TL, Petyuk VA, et al.
Antibody-independent targeted quantification of TMPRSS2-ERG fusion protein products in prostate cancer. Mol Oncol. 2014;8(7):1169–80. 34. MacLean B, Tomazela DM, Shulman N, Chambers M, Finney GL, Frewen B,
et al. Skyline: an open source document editor for creating and analyzing targeted proteomics experiments. Bioinformatics. 2010;26(7):966–8. 35. Geiss GK, Bumgarner RE, Birditt B, Dahl T, Dowidar N, Dunaway DL, et al.
Direct multiplexed measurement of gene expression with color-coded probe pairs. Nat Biotechnol. 2008;26(3):317–25.
36. Reis PP, Waldron L, Goswami RS, Xu W, Xuan Y, Perez-Ordonez B, et al. mRNA transcript quantification in archival samples using multiplexed, color-coded probes. BMC Biotechnol. 2011;11:46.
37. Rigau M, Olivan M, Garcia M, Sequeiros T, Montes M, Colas E, et al. The present and future of prostate cancer urine biomarkers. Int J Mol Sci. 2013;14(6):12620–49.
38. Leyten GH, Hessels D, Jannink SA, Smit FP, de Jong H, Cornel EB, et al. Prospective multicentre evaluation of PCA3 and TMPRSS2-ERG gene fusions as diagnostic and prognostic urinary biomarkers for prostate cancer. Eur Urol. 2014;65(3):534–42.
Submit your next manuscript to BioMed Central and take full advantage of:
• Convenient online submission
• Thorough peer review
• No space constraints or color figure charges
• Immediate publication on acceptance
• Inclusion in PubMed, CAS, Scopus and Google Scholar
• Research which is freely available for redistribution