R E S E A R C H A R T I C L E
Open Access
New chronic disease medication
prescribing by nurse practitioners,
physician assistants, and primary care
physicians: a cohort study
Zachary A. Marcum
1*, Johanna E. Bellon
2, Jie Li
3, Walid F. Gellad
4and Julie M. Donohue
3Abstract
Background:Medications to treat and prevent chronic disease have substantially reduced morbidity and mortality; however, their diffusion has been uneven. Little is known about prescribing of chronic disease medications by nurse practitioners (NPs) and physician assistants (PAs), despite their increasingly important role as primary care providers. Thus, we sought to conduct an exploratory analysis to examine prescribing of new chronic disease medications by NPs and PAs compared to primary care physicians (PCPs).
Methods:We obtained prescribing data from IMS Health’s Xponent™on all NPs, PAs, and PCPs in Pennsylvania regularly prescribing anticoagulants, antihypertensives, oral hypoglycemics, and/or HMG-Co-A reductase inhibitors pre- and post-introduction of five new drugs in these classes that varied in novelty (i.e., dabigatran, aliskiren, sitagliptin or saxagliptin, and pitavastatin). We constructed three measures of prescriber adoption during the 15-month post-FDA approval period: 1) any prescription of the medication, 2) proportion of prescriptions in the class for the medication, and 3) time to adoption (first prescription) of the medication.
Results:From 2007 to 2011, the proportion of antihypertensive prescriptions prescribed by NPs and PAs approximately doubled from 2.0 to 4.2 % and 2.2 to 4.9 %, respectively. Similar trends were found for anticoagulants, oral hypoglycemics, and HMG-Co-A reductase inhibitors. By 2011, more PCPs had prescribed each of the newly approved medications than NPs and PAs (e.g., 44.3 % vs. 18.5 % vs. 20 % for dabigatran among PCPs, NPs, and PAs). Across all medication classes, the newly approved drugs accounted for a larger share of prescriptions in the class for PCPs followed by PAs, followed by NPs (e.g., dabigatran: 4.9 % vs. 3.2 % vs. 2.8 %, respectively). Mean time-to-adoption for the newly approved medications was shorter for PCPs compared to NPs and PAs (e.g., dabigatran, 7.3 vs. 8.2 vs. 8.5 months;Pall medications <0.001).
Conclusions:PCPs were more likely to prescribe each of the newly approved medications per each measure of drug adoption, regardless of drug novelty. Differences in the rate and speed of drug adoption between PCPs, NPs, and PAs may have important implications for care and overall costs at the population level as NPs and PAs continue taking on a larger role in prescribing.
Keywords:Health services research, Pharmacoepidemiology, Primary care, Work force
* Correspondence:zmarcum@uw.edu
1Department of Pharmacy, School of Pharmacy, University of Washington,
1959 NE Pacific St, Box 357630, Seattle, WA 98102, USA Full list of author information is available at the end of the article
Background
Since the 1977 passage of the Rural Health Clinic Services Act, nurse practitioners (NPs) and physician assistants (PAs) have been authorized by Medicare and Medicaid to be reimbursed as providers [1]. Although all states allow NPs and PAs to practice in some capacity, scope-of-practice laws vary widely by state [2, 3]. Nationally, ap-proximately 56 % of physician group practices and 40 % of independent providers utilize NPs and PAs in their prac-tices, with continued growth expected due to a confluence of factors–fewer medical students choosing primary care, increasing health care demand from a growing and aging population, and a broad increase in access to care through the Affordable Care Act [1, 4, 5]. NPs and PAs generally perform 80 % of the functions of physicians, and studies to-date indicate that their quality measures and patient sat-isfaction are equal or greater than physicians’ for care within their scope-of-practice [1, 6–8].
One of the most important roles of a primary care provider–NP, PA, or primary care physician (PCP)–is to manage chronic diseases, and pharmacotherapy is the mainstay of treatment. National estimates for the US in-dicate that approximately 70 % of primary care office visits result in a medication being prescribed [9]. A re-view of state NP and PA regulations from 2001 to 2010 found that most states have loosened regulations over time, granting greater autonomy to NPs and PAs, par-ticularly with respect to prescriptive authority [10].
Some of the most widely prescribed chronic medication classes are those to treat hyperlipidemia and prevent the development and progression of ischemic heart disease, stroke, diabetes, and heart failure, which have greatly re-duced cardiovascular disease-related morbidity and mor-tality [11, 12]. However, diffusion of these therapies across the US is sub-optimal. There is both ‘under-diffusion’ of evidence-based therapies and‘over-diffusion’of new drugs that are more costly but no more effective than existing therapies. Diffusion is known to vary by physician spe-cialty, with PCPs typically adopting new drugs more slowly than physicians with sub-specialty training [13]. However, it is not known how NPs and PAs utilize newly-approved drugs compared to PCPs despite their increas-ingly important role as primary care providers. Differential uptake of new chronic disease medications by NPs and PAs compared to physicians in primary care has potential implications for both cost and quality of care. Thus, we sought to conduct an exploratory analysis to examine the prescribing of new cardiovascular and diabetes medica-tions by NPs and PAs relative to that of PCPs.
Methods
Data sources and sample
We used IMS Health’s Xponent™ prescription database to characterize NP, PA, and PCP prescribing of five new
chronic disease medications (representing four medica-tion classes), and IMS Healthcare Organizamedica-tion Services™ (HCOS) database for provider specialty and organizational affiliations. While data exist for physician characteristics, such as age, medical school, and residency program, in the American Medical Association Physician Masterfile, an equivalent dataset does not exist for NPs and PAs. As a result, we were unable to measure these provider-level characteristics in our sample. Xponent™directly captures 86 % of all US prescriptions filled in retail pharmacies and utilizes a patented proprietary projection method to repre-sent 100 % of prescriptions filled in these outlets [14]. We obtained monthly provider-level data on all prescriptions of interest dispensed in Pennsylvania between January 1, 2007 and December 31, 2011. Of note, certified registered NPs and PAs in Pennsylvania are both authorized to prescribe medical and therapeutic treatments. Xponent™ contains limited patient-level information, including the source of payment (Medicare, Medicaid fee-for-service, commercial insurance, cash or uninsured) and patient age, with no individual patient identifiers. We obtained information on provider specialty, provider sex, and organizational affiliations (e.g., medical group) from IMS Health’s HCOS database. HCOS data were used to identify primary care medical groups and to specify the number of providers within each medical group.
Study cohort
We compiled data for four cohorts of prescribers–one for each of the medication classes under investigation – including prescribers of oral anticoagulants, antihy-pertensives targeting the renin-angiotensin-aldosterone system, oral hypoglycemics, and HMG-CoA reductase inhibitors among the three prescriber types (i.e., NPs, PAs, and PCPs). We excluded those who never pre-scribed a medication from the class of interest during the study period. Because we were interested in pri-mary care prescribing behavior, we excluded those providers not practicing in a primary care practice as well as those with missing values for National Provider Identifier or sex.
Study medications
compared to warfarin in patients with atrial fibrillation [15, 16]. Sitagliptin and saxagliptin were part of a new class of oral hypoglycemic agents that target a differ-ent physiologic pathway than other diabetes medica-tions and were purported to have minimal risk of hypoglycemia and weight gain compared to sulfonyl-ureas with comparable efficacy [17]. Aliskiren was the first in a new class of agents for hypertension, joining two others (i.e., angiotensin-converting enzyme inhibi-tors and angiotensin II receptor blockers) that inhibit the renin-angiotensin-aldosterone system; comparative efficacy and safety among the antihypertensive classes is largely unknown. Pitavastatin was the seventh ‘ sta-tin’approved in the US and represents the most minor therapeutic advance among the study drugs [18]. This variation in medication classes and novelty allowed us to assess whether any differences between NP, PA, and PCP prescribing were specific to a medication class or consistent across multiple classes.
Outcome measures
The decision to adopt a new drug is multifaceted. A pre-scriber first needs to learn about a new drug and then decide whether to use it and how frequently to prescribe it. Therefore, we constructed three measures: 1) any pre-scription of the newly approved medication in the final year of the study period (2011), 2) proportion of new medication among the medication class, and 3) time to first adoption of the newly approved medication. Time to first adoption – defined as the time from FDA ap-proval to first prescription of the new drug –provides a measure of speed of adoption, while the other two mea-sures identify the extent of provider adoption over time [19]. In order to assess NP and PA prescribing trends in general, we also measured the share of prescribing within the drug classes of interest accounted for by NPs and PAs compared to PCPs over time.
Statistical analysis
Our analysis followed three steps. First, for each of the four chronic disease medication classes, we described characteristics of NPs, PAs, and PCPs who were regular prescribers of the medication class as a frequency (per-centage) for each variable. We used Chi-square tests to assess differences in characteristics across provider types, and Wilcoxon rank sum tests for non-normally distributed variables. Second, for each of the four chronic disease medication classes, we measured the proportion of all medications within the class pre-scribed by the three provider types (i.e., NPs, PAs, and PCPs) across all years. Third, we estimated new drug adoption among the three provider types by assessing the three measures of adoption previously described. To assess time to first adoption, we used the
Kaplan-Meier method to compute the proportion of providers who had adopted the new drug in the 15 months post-FDA approval. The date of first prescription of each newly approved medication in the dataset was used as the index date.
Given evidence suggesting the potential for sex differ-ences in new drug adoption by providers [20], we con-ducted post-hoc sensitivity analyses. Because sex was almost perfectly correlated with provider type, we could not control for it in multivariable analysis. Thus, we re-peated all primary analyses described above on only fe-male providers across the three provider types. We used SAS version 9.3 (SAS Institute, Cary, NC, USA) for ana-lyses and the Stata version 11.0 (StataCorp, College Station, TX, USA) for the Kaplan-Meier graphs.
Results
Characteristics of the study sample
We identified more than 5000 NPs, PAs, and PCPs in Pennsylvania who prescribed each chronic disease medi-cation category in 2007–2011 (oral anticoagulants, n= 5299; select antihypertensives, n= 5514; oral hypoglyce-mics,n= 5510; HMG-CoA reductase inhibitors,n= 5454; and all four classes, n= 5177). Among the medication classes with the most prescribers – antihypertensives – NPs and PAs were more likely than PCPs to be female (93 % of NPs and 77 % of PAs vs. 34 % of PCPs,P< 0.001) (Table 1). NPs and PAs were also more than twice as likely to practice in a rural setting (21 % of NPs and 27 % of PAs vs. 12 % of PCPs, P< 0.001). PCPs were slightly more likely to prescribe to older patients (with age ≥65 years representing 52 % of PCP patients vs. 41 % of NP patients and 40 % of PAs, P< 0.001). PCPs scribed a larger annual volume of antihypertensive pre-scriptions compared to NPs and PAs (2011 mean: PCPs, 1127.2; NPs, 433.3; PAs, 423.8;P< 0.001). Similar results were found for the other three medication clas-ses (see Additional file 1: Tables S1-S3).
Prescribing patterns over time
From 2007 to 2011, the proportion of all prescriptions in these classes written by NPs and PAs increased substan-tially. Among select antihypertensives, the proportion of prescriptions written by NPs and PAs approximately doubled from 2.0 to 4.2 % and 2.2 to 4.9 % among NPs and PAs, respectively (Table 2). Conversely, the pro-portion of all antihypertensive prescriptions accounted for by PCPs decreased from 95.9 to 91.0 % (Table 2). Similar results were found for the other three medica-tion classes.
New drug adoption
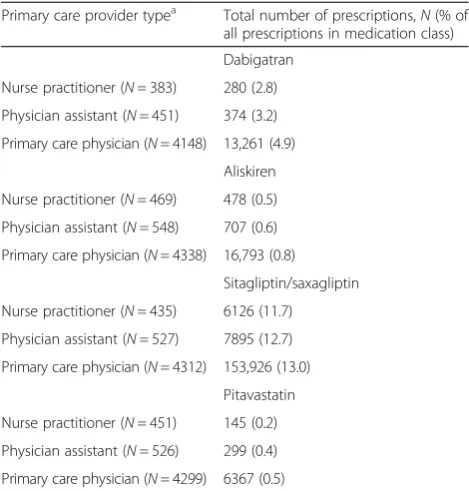
disease medications than NPs and PAs (Fig. 1; Table 3). For example, 44.3 % of PCPs ordered at least one prescription for dabigatran compared to 18.5 % of NPs and 20.0 % of PAs (Fig. 1). We found similar differences for each of the other new medica-tions (31.9 % vs. 13.9 % vs. 20.4 % for aliskiren among PCPs, NPs, and PAs; 87.3 % vs. 71.5 % vs. 72.5 % for sitagliptin or saxagliptin among PCPs, NPs, and PAs; and 17.1 % vs. 6.9 % vs. 12.0 % for pitavastatin among PCPs, NPs, and PAs). Across all medication classes, the new cardiovascular agents accounted for a larger share of all prescriptions in the class for PCPs followed by PAs, followed by NPs (Table 3). For example, dabigatran prescriptions accounted for 4.9 % of all anticoagulant prescriptions ordered by PCPs compared to 3.2 % for PAs and 2.8 % for NPs. Similarly, PCPs adopted each of the newly approved cardiovascular medications significantly more rapidly than did NPs and PAs during the post-FDA
Table 1Characteristics of nurse practitioners, physician assistants, and primary care physicians who prescribed select
antihypertensiveaprescription medications in Pennsylvania, 2011b
Characteristics Nurse practitioner
Physician assistant
Primary care physician N= 504 N= 591 N= 4419
Provider sex, % – – –
Female 93.1 76.8 34.2
Provider setting, % – – –
Rural 20.8 27.4 11.9
Provider prescribing – – –
Annual prescription volume, mean (sd)
433.3 (496.6) 423.8 (496.0) 1127.2 (853.8)
Patient age, % – – –
<64 59.1 60.0 47.7
65–74 19.9 20.2 22.6
75–84 13.4 13.0 18.5
85+ 7.7 6.8 11.2
Source of payment for prescription, %
– – –
Cash 5.3 5.5 5.3
Commercial 55.2 54.8 54.9
Medicaid 8.7 9.1 5.4
Medicare 30.7 30.6 34.3
Primary care medical
group – – –
Number of practice sites 550 569 3277
Number of providers per site, mean (sd)
45.1 (160.1) 47.2 (148.9) 20.7 (89.0)
a
Antihypertensive medications included those targeting the renin-angiotensin-aldosterone system, including angiotensin-converting enzyme inhibitors, angiotensin II receptor blockers, and direct renin inhibitors;b
[image:4.595.58.287.122.460.2]P<0.001 for comparisons across providers for all variables
Table 2Proportion of cardiovascular prescriptions ordered by nurse practitioners, physician assistants, and primary care physicians over time, 2007–2011
2007 2008 2009 2010 2011
Antihypertensives
Total prescriptions,N
2,116,048 2,182,069 2,188,136 2,248,183 2,272,489
NP (%) 2.0 2.4 3.0 3.8 4.2
PA (%) 2.2 2.8 3.4 4.2 4.9
PCP (%) 95.9 94.8 93.6 92.1 91.0
Anticoagulants
Total,N 261,698 264,176 267,630 278,745 291,524
NP 1.5 1.9 2.3 3.2 3.4
PA 1.4 2.1 2.8 3.6 4.1
PCP 97.1 96.0 94.9 92.6 92.6
Oral hypoglycemics
Total,N 1,292,094 1,293,618 1,302,716 1,315,114 1,301,535
NP 1.9 2.3 2.9 3.7 4.0
PA 2.1 2.7 3.3 4.1 4.8
PCP 96.0 95.0 93.8 92.3 91.2
HMG-CoA Reductase inhibitors
Total,N 1,294,269 1,319,042 1,359,293 1,411,180 1,455,255
NP 2.1 2.6 3.3 4.1 4.4
PA 2.3 2.8 3.5 4.4 5.1
PCP 95.6 94.5 93.2 91.6 90.5
Abbreviations:NPnurse practitioner,PAphysician assistant,PCPprimary
care physician
Percen
tage
Fig. 1Percent of each provider type with any prescription for a newly approved medication in 2011a.aPrevalence of any prescription
[image:4.595.305.539.524.683.2]approval period (Fig. 2;P< 0.001). Mean time-to-adoption for the newly approved medications was shorter for PCPs compared to NPs and PAs: dabigatran, 7.3 vs. 8.2 vs. 8.5 months; aliskiren, 6.6 vs. 9.0 vs. 7.9 months; sitagliptin, 4.4 vs. 5.7 vs. 6.9; saxagliptin, 8.4 vs. 10.1 vs. 9.7; and pita-vastatin, 7.6 vs. 8.8 vs. 9.5.
Sensitivity analyses: only female providers
When sub-setting the analyses to only female providers, the results were largely unchanged–female PCPs adopted the new drugs more rapidly than did NPs and PAs (Additional file 1: Tables S4-S6, Figures S1 and S2). However, there were some noteworthy differences be-tween the main analysis and the sensitivity analysis. Across the included medication classes, the propor-tion of prescrippropor-tions written by female NPs and PAs was greater than in the main analysis (Additional file 1: Table S5). In addition, consistent with the main analysis, by the final year of the study period (2011), dabigatran accounted for a larger share of all prescriptions in the class for female PCPs followed by female PAs, followed by female NPs (Additional file 1: Table S6). In contrast to the main analysis, this pattern did not follow for alis-kiren, sitagliptin/saxagliptin, or pitavastatin, for which female PAs accounted for the largest share of prescrip-tions of the new medicaprescrip-tions. By the final year of the study period (2011), more female PCPs had prescribed each of the newly approved chronic disease medications than female NPs and PAs, with the exception of
pitavastatin (Additional file 1: Figure S1). Similarly, fe-male PCPs adopted each of the newly approved cardio-vascular medications significantly more rapidly than did female NPs and PAs during the post-FDA approval period (Additional file 1: Figure S2;P< 0.01).
Discussion
Our exploratory study yielded three key findings regard-ing NP, PA, and PCP prescribregard-ing of newly approved chronic disease medications in the primary care setting. First, we found that NPs and PAs ordered a small but in-creasing share of prescriptions in some of the most widely used classes, responsible for almost 1 in 10 pre-scriptions in these classes by 2011. Second, we found that PCPs adopted each of the new chronic disease med-ications more rapidly than did NPs and PAs, regardless of drug novelty. Third, we found that PCPs ordered a greater proportion of their prescriptions for the new medications than did NPs and PAs. Differences in the rate and speed of drug adoption between PCPs and NPs and PAs may have important implications for care and overall costs at the population level as NPs and PAs con-tinue to take on a larger role in prescribing.
[image:5.595.56.291.109.355.2]To our knowledge, this study is the first to examine new drug adoption across primary care provider types. This is noteworthy because much of the existing lit-erature comparing NPs and PAs and PCPs has focused on process measures (e.g., patient satisfaction), with less emphasis on utilization measures. For example, a systematic review comparing NPs to PCPs found that processes of care were not significantly different between the two provider types for chronic disease management [21]. Moreover, a Cochrane Review evaluat-ing the impact of doctor-nurse substitution in primary care on patient outcomes, processes of care, and re-source utilization reported that appropriately trained NPs can produce as high quality care as PCPs on the measured processes and achieve comparable health outcomes [7]. However, the review acknowledged major limitations in the current literature, including only one study being powered to assess equivalence of care, sev-eral studies having methodological limitations, and pa-tient follow-up being short. [7] The most comparable study to ours (not included in the Cochrane Review) examined use of diagnostic imaging ordered by NPs and PAs relative to that of PCPs following office-based encounters as a measure of healthcare utilization. Hughes et al. found that NPs and PAs ordered more imaging services than PCPs for similar patients and concluded that although these differences appeared modest at the individual level, the potential implica-tions on care and costs at the population level are significant [5]. Prior research from the National Ambu-latory Medical Care Surveys found that NPs and PAs
Table 3Proportion of prescriptions in each category accounted for by the newly approved medications, 2011
Primary care provider typea Total number of prescriptions,N(% of
all prescriptions in medication class)
Dabigatran
Nurse practitioner (N= 383) 280 (2.8)
Physician assistant (N= 451) 374 (3.2)
Primary care physician (N= 4148) 13,261 (4.9)
Aliskiren
Nurse practitioner (N= 469) 478 (0.5)
Physician assistant (N= 548) 707 (0.6)
Primary care physician (N= 4338) 16,793 (0.8)
Sitagliptin/saxagliptin
Nurse practitioner (N= 435) 6126 (11.7)
Physician assistant (N= 527) 7895 (12.7)
Primary care physician (N= 4312) 153,926 (13.0)
Pitavastatin
Nurse practitioner (N= 451) 145 (0.2)
Physician assistant (N= 526) 299 (0.4)
Primary care physician (N= 4299) 6367 (0.5)
a
and PCPs prescribe a similar number of medications per visit [4]. However, our study revealed differential prescribing behavior between NPs and PAs and PCPs for newly approved drugs.
The differences in prescribing we identify may be due to patient-, practice-, provider-, manufacturer-, or payer-level factors that differ between provider types. Previous research has shown that NPs and PAs generally spend greater amounts of time educating and counseling patients and that physicians retain older, more complex patients [22]. Our findings are consistent in that PCPs were more likely than NPs and PAs to prescribe to older patients, who often take multiple medications due to chronic co-morbidity. Given an older, more complex pa-tient panel, PCPs may be more likely to prescribe from a broader prescription armamentarium, including newly approved drugs. In addition, some evidence points to provider sex as an important factor in health technology adoption; male providers tend to adopt new treatment more rapidly on average [19]. Our findings support this notion, given that the vast majority of NPs and PAs were female compared to one-third of PCPs. To explore this,
we conducted post-hoc sensitivity analyses by including only female NPs, PAs, and PCPs in order to qualitatively compare these results with the main results. These results were largely similar to the main results, with a few exceptions. On the whole, we continued to find sta-tistically significant differences in the rate of new drug adoption across provider type. Further, differences in peer influences, which may affect new technology adop-tion, could differ between NPs, PAs, and PCPs [23–25]. It is interesting to note, however, that NPs and PAs in our study worked in much larger practices where there are presumably more peers to learn from and, yet, they were found to be slower adopters of new drugs. Another factor that could drive new drug adoption is pharma-ceutical marketing. However, previous research has shown that NPs have similar exposure to pharmaceutical promotion and tend to respond in the same way as phy-sicians [4]. We also note that there were differences in speed and extent of adoption across the five study drugs, with first-in-class drugs being more rapidly adopted than others. Finally, we found that NPs and PAs were more likely to prescribe to patients receiving Medicaid Fig. 2Time to adoption of new chronic disease medications post-FDA approval among primary care providers by specialtya.aP< 0.001 log-rank
[image:6.595.57.539.88.420.2]coverage, and it is possible that Medicaid formularies were more restrictive, thus explaining a lower use of new brand name drugs.
Our study has important limitations. First, we lacked clinical information on patient-level factors (e.g., comor-bidities). Prescriber adoption decisions may be influ-enced by their patient case mix although prior studies suggest this explains little of the variation in choice of prescription drugs [26]. Second, we lacked data on the provider characteristics, such as age, training, and years in practice. As previously mentioned, data exist for phys-ician characteristics (e.g., age, sex, medical school, and residency program) in the American Medical Association Physician Masterfile; however, an equivalent dataset does not exist for NPs and PAs. As a result, we were unable to measure these provider-level characteristics. Third, be-cause of a lack of data, we were unable to adjust for some of the external influences on prescribing behavior, such as manufacturer promotional efforts directed at providers, characteristics of the specific organizations in which providers practice, and health plan coverage of other medications. Fourth, our analysis included five newly approved medications from four medication classes and, thus, may not represent prescribing habits of pri-mary care providers for all newly approved medications. Finally, we were not able to assess appropriateness for the prescribing behaviors and thus cannot say whether there is underuse of new drugs by NPs and PAs and/or overuse by PCPs.
Conclusions
In conclusion, our exploratory findings point to differen-tial adoption of newly approved chronic disease medica-tions between NPs and PAs and PCPs. PCPs were more likely to prescribe each of the newly approved medica-tions, including both more and less novel drugs, by all three measures of adoption used in our study. While there were small absolute differences among prescriber groups detected, these may have important implications for care and overall costs at the population level given the number of new drugs approved each year.
Additional file
Additional file 1: Table S1.Characteristics of nurse practitioners, physician assistants, and primary care physicians who prescribed anticoagulant prescription medications in Pennsylvania, 2011.Table S2.Characteristics of nurse practitioners, physician assistants, and primary care physicians who prescribed oral hypoglycemic prescription medications in Pennsylvania, 2011.Table S3.Characteristics of nurse practitioners, physician assistants, and primary care physicians who prescribed HMG-CoA reductase inhibitor prescriptions in Pennsylvania, 2011.Table S4.Characteristics of female nurse practitioners, physician assistants, and primary care physicians who prescribed select antihypertensive prescription medications in Pennsylvania, 2011.Table S5.Proportion of cardiovascular prescriptions ordered by female nurse practitioners, physician assistants, and primary care physicians
over time, 2007–2011.Table S6.Proportion of prescriptions from female providers in each category accounted for by the newly approved medications, 2011.Figure S1.Percent of each female provider type with any prescription for a newly approved medication in 2011.Figure S2.Time to adoption of new chronic disease medications post-FDA approval among female primary care providers. (DOCX 168 kb)
Abbreviations
HCOS, Healthcare Organization Services; NP, nurse practitioner; PA, physician assistant; PCP, primary care physician
Acknowledgements Not applicable.
Funding
This work was supported by R01HL119246 from NHLBI (Drs. Donohue and Gellad). Dr. Gellad was also supported by a VA HSR&D Career Development Award (CDA 09–207). Drs. Donohue and Gellad were partially supported by a pilot grant from the RAND-University of Pittsburgh Health Institute (RUPHI) and Grant Number UL1 RR024153 from the National Center for Research Resources (NCRR), a component of the National Institutes of Health.
Availability of data and materials
The datasets generated during and/or analysed during the current study are not publicly available due to an ongoing data use agreement but are available from the corresponding author on reasonable request.
Authors’contributions
ZM participated in the design and interpretation of the data and drafting/ revising the manuscript. JD conceived of the study, and participated in its design and interpretation and helped to draft the manuscript. JL performed the statistical analysis and revised the manuscript critically. JB and WG participated in its design and interpretation and helped to revise the manuscript critically. All authors read and approved the final manuscript.
Competing interests
None of the authors has relevant competing interests to report. The views of Dr. Gellad represent his alone and are not necessarily representative of the views of the Department of Veterans Affairs or US Government.
Consent for publication Not applicable.
Ethics approval and consent to participate
All procedures performed in studies were in accordance with the 1964 Declaration of Helsinki and its later amendments or comparable ethical standards. The University of Pittsburgh Institutional Review Board deemed the study exempt.
Author details
1
Department of Pharmacy, School of Pharmacy, University of Washington, 1959 NE Pacific St, Box 357630, Seattle, WA 98102, USA.2Wolff Center at
UPMC, Ross Building, Room 219, 4601 Baum Blvd, Pittsburgh, PA 15213, USA.
3Department of Health Policy & Management, Graduate School of Public
Health, University of Pittsburgh, 130 De Soto Street, Pittsburgh, PA 15261, USA.4VA Pittsburgh Healthcare System and Department of General Internal
Medicine, School of Medicine, University of Pittsburgh, 200 Meyran Avenue, Parkvale Building, Pittsburgh, PA 15213, USA.
Received: 7 April 2016 Accepted: 20 July 2016
References
1. Staton FS, Bhosle MJ, Camacho FT, et al. How PAs improve access to care for the underserved. JAAPA. 2007;20(6):32–40.
2. Wing P, Langelier MH, Salsberg ES, et al. The changing professional practice of physician assistants: 1992 to 2000. JAAPA. 2004;17(1):37–40. 42,45-49. 3. Ricketts TC. Workforce issues in rural areas: a focus on policy equity.
4. Hooker RS, McCaig LF. Use of physician assistants and nurse practitioners in primary care, 1995–1999. Health Aff (Millwood). 2001;20(4):231–8. 5. Hughes DR, Jiang M, Duszak Jr R. A comparison of diagnostic imaging
ordering patterns between advanced practice clinicians and primary care physicians following office-based evaluation management visits. JAMA Intern Med. 2015;175(1):101–7.
6. Baldwin KA, Sisk RJ, Watts P, et al. Acceptance of nurse practitioners and physician assistants in meeting the perceived needs of rural communities. Public Health Nurs. 1998;15(6):389–97.
7. Laurant M, Reeves D, Hermens R, et al. Substitution of doctors by nurses in primary care. Cochrane Database Syst Rev. 2005;2:CD001271.
8. Halter M, Drennan V, Chattopadhyay K, et al. The contribution of physician assistants in primary care: a systematic review. BMC Health Serv Res. 2013; 13:223. doi:10.1186/1472-6963-13-223.
9. Raofi S, Schappert SM. Medication therapy in ambulatory medical care: United States, 2003–04. National Center for Health Statistics. Vital Health Stat. 2006;13(163):1.
10. Gadbois EA, Miller EA, Tyler D, et al. Trends in state regulation of nurse practitioners and physician assistants, 2001 to 2010. Med Care Res Rev. 2015;72(2):200–19.
11. Ford ES, Ajani UA, Croft JB, et al. Explaining the decrease in U.S. deaths from coronary disease,1980–2000. N Engl J Med. 2007;356(23):2388–98. 12. Wijeysundera HC, Machado M, Farahati F, et al. Association of temporal
trends in risk factors and treatment uptake with coronary heart disease mortality, 1994–2005. JAMA. 2010;303(18):1841–7.
13. De Smet BD, Fendrick AM, Stevenson JG, et al. Over and under-utilization of cyclooxygenase-2 selective inhibitors by primary care physicians and specialists: the tortoise and the hare revisited. J Gen Intern Med. 2006; 21(7):694–7.
14. IMS Health. Information Sources, IMS Xponent. http://www.imshealth.com/ portal/site/imshealth/menuitem.c76283e8bf81e98f53c753c71ad8c22a/? vgnextoid=39d15dba9648e310VgnVCM10000076192ca2RCRD&vgn extchannel=abb6e590cb4dc310VgnVCM100000a48d2ca2RCRD. Accessed 26 September 2015.
15. Connolly SJ, Ezekowitz MD, Yusuf S, et al. Dabigatran versus warfarin in patients with atrial fibrillation. N Engl J Med. 2009;361(12):1139–51. 16. Graham DJ, Reichman ME, Wernecke M, et al. Cardiovascular, bleeding, and
mortality risks in elderly Medicare patients treated with dabigatran or warfarin for non-valvular atrial fibrillation. Circulation. 2015;131(2):157–64.
17. Dicker D. DPP-4 inhibitors: impact on glycemic control and cardiovascular risk factors. Diabetes Care. 2011;34 Suppl 2:S276–8.
18. Duggan ST. Pitavastatin: a review of its use in the management of hypercholesterolemia or mixed dyslipidemia. Drugs. 2012;72(4):565–84. 19. Huskamp HA, O’Malley AJ, Horvitz-Lennon M, et al. How quickly do physicians
adopt new drugs? The case of second-generation antipsychotics. Psychiatr Serv. 2013;64(4):324–30.
20. Lo-Ciganic W, Gellad WF, Huskamp HA, et al. Who were the early adopters of dabigatran? An application of group-based trajectory models. Med Care. 2016;54:725–32.
21. Martínez-González NA, Rosemann T, Tandjung R, et al. The effect of physician-nurse substitution in primary care in chronic diseases: a systematic review. Swiss Med Wkly. 2015;145:w14031.
22. Henry LR, Hooker RS. Retention of physician assistants in rural health clinics. J Rural Health. 2007;23(3):207–14.
23. Menchik DA, Meltzer DO. The cultivation of esteem and retrieval of scientific knowledge in physician networks. J Health Soc Behav. 2010;51(2):137–52. 24. Prosser H, Walley T. New drug prescribing by hospital doctors: the nature
and meaning of knowledge. Soc Sci Med. 2006;62(7):1565–78.
25. Prosser H, Almond S, Walley T. Influences on GP’s decision to prescribe new drugs-the importance of who says what. Fam Pract. 2003;20(1):61–8. 26. Schneeweiss S, Glynn RJ, Avorn J, et al. A Medicare database review found
that physician preferences increasingly outweighed patient characteristics as determinants of first-time prescriptions for COX-2 inhibitors. J Clin Epidemiol. 2005;58(1):98–102.
• We accept pre-submission inquiries
• Our selector tool helps you to find the most relevant journal
• We provide round the clock customer support • Convenient online submission
• Thorough peer review
• Inclusion in PubMed and all major indexing services
• Maximum visibility for your research
Submit your manuscript at www.biomedcentral.com/submit