R E S E A R C H
Open Access
Environmental and social determinants of
population vulnerability to Zika virus
emergence at the local scale
Erin E. Rees
1*, Tatiana Petukhova
2, Mariola Mascarenhas
2, Yann Pelcat
1and Nicholas H. Ogden
1Abstract
Background:Zika virus (ZIKV) spread rapidly in the Americas in 2015. Targeting effective public health interventions for inhabitants of, and travellers to and from, affected countries depends on understanding the risk of ZIKV
emergence (and re-emergence) at the local scale. We explore the extent to which environmental, social and neighbourhood disease intensity variables influenced emergence dynamics. Our objective was to characterise population vulnerability given the potential for sustained autochthonous ZIKV transmission and the timing of emergence. Logistic regression models estimated the probability of reporting at least one case of ZIKV in a given municipality over the course of the study period as an indicator for sustained transmission; while accelerated failure time (AFT) survival models estimated the time to a first reported case of ZIKV in weektfor a given municipality as an indicator for timing of emergence.
Results:Sustained autochthonous ZIKV transmission was best described at the temporal scale of the study period (almost one year), such that high levels of study period precipitation and low mean study period temperature reduced the probability. Timing of ZIKV emergence was best described at the weekly scale for precipitation in that high precipitation in the current week delayed reporting. Both modelling approaches detected an effect of high poverty on reducing/slowing case detection, especially when inter-municipal road connectivity was low. We also found that proximity to municipalities reporting ZIKV had an effect to reduce timing of emergence when located, on average, less than 100 km away.
Conclusions:The different modelling approaches help distinguish between large temporal scale factors driving vector habitat suitability and short temporal scale factors affecting the speed of spread. We find evidence for inter-municipal movements of infected people as a local-scale driver of spatial spread. The negative association with poverty suggests reduced case reporting in poorer areas. Overall, relatively simplistic models may be able to predict the vulnerability of populations to autochthonous ZIKV transmission at the local scale.
Keywords:Zika, Environmental determinants, Public health surveillance, Social bias, Risk analysis, Logistic regression model, Accelerated failure time survival model, Colombia
Background
Zika virus (ZIKV) has been endemic to Africa and Asia for decades [1]. About 20% of infected people show clin-ical manifestations, which are mostly mild (rash, low grade fever, headache, conjunctivitis and myalgia [2]). Severe complications including Guillain-Barré syndrome
[3, 4] and microcephaly and other presumed
ZIKV-related birth defects in children born to mothers in-fected during pregnancy have been reported [5]. The main mechanism of ZIKV transmission is thought to be throughAedesmosquitoes (particularlyAe. aegyptiandAe. albopictus), although sexual and perinatal transmission and transmission by blood transfusion also occur [6–8].
During the new millennium the Asian strain of ZIKV began spreading beyond its traditional range across the Pacific Ocean. In April 2007 an outbreak was detected on Yap Island, followed by Guam and Micronesia. From 2013 to 2014, ZIKV had spread to other Pacific islands * Correspondence:erin.rees@canada.ca
1Public Health Risk Sciences Division, National Microbiology Laboratory,
Public Health Agency of Canada, Saint-Hyacinthe, Québec, Canada Full list of author information is available at the end of the article
including French Polynesia, New Caledonia, Cook Islands, Tahiti and Easter Island [1]. The first autochthonous out-break on mainland South America was detected by May 2015 in Brazil [9]. However, estimates using genetic methods date the Brazil outbreak as starting sometime be-tween May to December 2013 [1,10]. From Brazil, ZIKV spread rapidly in South and Central America and the
Caribbean. By February 2016, the World Health
Organization declared ZIKV a public health emergency of international concern. Autochthonous transmission of ZIKV is now reported throughout South America except Chile and Uruguay as of January 4th, 2018 (http://ais. paho.org/phip/viz/ed_zika_epicurve.asp).
It is not well understood why ZIKV spread rapidly across the Americas following years of relative endemic stability in Africa and Asia. At the international level, a dynamic model of ZIKV transmission in the Americas indicated that spread dynamics were driven by factors affecting mosquito vector occurrence, abundance and activity, and human population characteristics such as international mobility and social status [11]. Abundance and activity of vectors depends on climatic and other en-vironmental factors. Precipitation influences the avail-ability of breeding habitat and Aedes spp. abundance is usually higher in wet seasons [12]. Temperature directly influences vector mortality rates and activity, ZIKV de-velopment rates within mosquitoes, and indirectly affects vector abundanceviainfluences on interstadial develop-ment rates. Aedesspp. vectors of ZIKV (Ae. aegyptiand Ae. albopictus) have an approximate range of tempera-tures suitable for reproduction and survival of at 16–35 °C [13]. Higher temperatures shorten the duration of the extrinsic incubation period enabling faster rates of trans-mission [14]. Elevation is correlated with temperature (higher elevations being cooler) but may also be a proxy for different habitats that have more complex interactions with mosquito survival and reproduction [15].
Human social factors may affect exposure to infected vectors and also influence bias in case detection by sur-veillance systems. Detection of ZIKV may be more likely in dense populations because there may be more availability of healthcare facilities. Poverty is associated with higher rates of transmission ofAedes-borne patho-gens amongst humans [16]. Poorer areas have lower quality housing, with lack of window screens and often more peridomestic Aedesspp. aquatic breeding habitat leading to higher mosquito abundance and biting rates
[17,18]. However, poorer populations may have less
ac-cess to healthcare and education for awareness and
pre-vention, resulting in lower disease detection by
surveillance programs [19,20]. Finally, rates of popula-tion movement will determine rates of spread of infec-tion into pathogen-free areas [1, 21], and these rates can be influenced by poverty [22].
Clearly the potential for, and speed of, ZIKV spread de-pends on the abundance and activity of vectors [11, 23], the level of human exposure and human density, global trade and human travel [11, 24], to some extent sexual transmission [8], and potentially the level of immunity in the human population [25]. Given that there is no clear evidence for ZIKV immunity [26,27], it is likely that naive human population immunity in South and Central Amer-ica combined with high abundance of vectors and suitable conditions for transmission and spread contributed to the rapid spread of ZIKV, as observed with the emergence and spread of chikungunya in the region [28]. The few areas not reporting the disease likely had either habitat in-hospitable for vectors (e.g. alpine regions) or were missed by the surveillance system.
The objective of our study was to characterize popula-tion vulnerability to sustained local autochthonous transmission of ZIKV as derived from environmental, so-cial and neighbourhood disease intensity factors. We used two modelling approaches on the same surveillance dataset to concentrate on the potential for autochthon-ous transmission versus the timing of emergence. Our analysis focused on Colombia, which suffered the second largest outbreak after Brazil. We discuss the implications of our dual-modelling approach for risk analysis in the context of advising effective public health management of ZIKV.
Methods
Study area
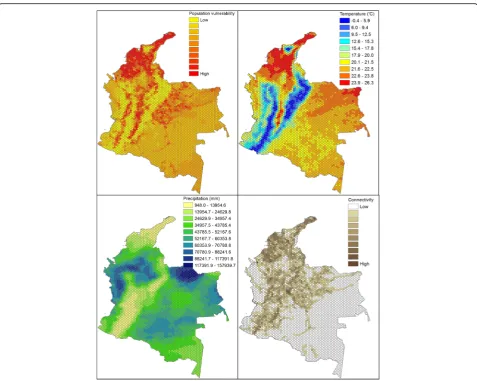
Colombia is geographically diverse with elevation ran-ging from sea level to > 5000 m in the Andes, and there are 11 Köppen climate zones [29]. In general, areas below 1000 m are hot (> 24 °C), 1000–3000 m are tem-perate (12–24 °C) and areas above 4000 m are typically below 12 °C and often experience sub-zero temperatures.
The climate is suitable for Aedes species and ZIKV
transmission, except at high elevations [30, 31]. Most Colombians live at mid-altitudes in the temperate zones. Colombia is a developing country and while measures of health, education and wealth are improving, there still remains significant levels of poverty particularly in low-lying and rural areas [32].
Surveillance data
suspected case definition also included the criteria that the individual has come from or visited places in Colombia below 2200 m in elevation and with confirmed circulation of ZIKV at least 15 days prior to the onset of symptoms, and/or countries with or without confirmed circulation of ZIKV. Confirmed cases were individuals who presented with clinical symptoms of ZIKV disease and tested positive for ZIKV in laboratories affiliated with the National Network of Laboratories, National Institute of Health, or collaborating centers designated by the INS. Confirmed cases also included a case definition typically associated with probable cases to describe indi-viduals with clinical symptoms as described above, who had visited sites with elevations less than 2200 m in Colombia with confirmed circulation of ZIKV in the 15 days prior to the onset of symptoms. Laboratory con-firmed cases were cases with a positive result for ZIKV by RT-PCR or by serological immunoassay testing [9, 33]. The case date for a patient was the week that they had presented themselves for care at health centres [9].
In Colombia, the first case of ZIKV was detected in the epidemiological week (EW) 41 in October of 2015
[9, 34]. Cases have since been confirmed back to EW 32
(August) of 2015 [35], and may have occurred as early as April [11]. The Colombian surveillance system has col-lected data on ZIKV cases at the municipal level on a weekly basis since January 9th 2016 (http://www.ins.gov.co), and these are the data we used for our study up to the third week in September 2016. To contend with missing data from 2015, we first grouped suspected with con-firmed case data at the municipal and week levels. Sec-ondly, if the number of reported cases was greater than one when first reported, we back-estimated the likely date of the first case for that municipality by assuming an ex-ponential growth rate to the power two [36]. For example, if 8 cases were reported at the first week,t= 0, of surveil-lance on January 9th 2016, then there were 4 cases at week t-1, 2 cases at weekt-2, and 1 cases at weekt-3.
To visually inspect for spatial patterns in reported emergence at the municipal level for the mainland we mapped days to first report in ArcGIS Map v. 10.5 (www.esri.com) using a GIS layer obtained from the GADM database, version 2.8 (www.gadm.org).
Statistical models
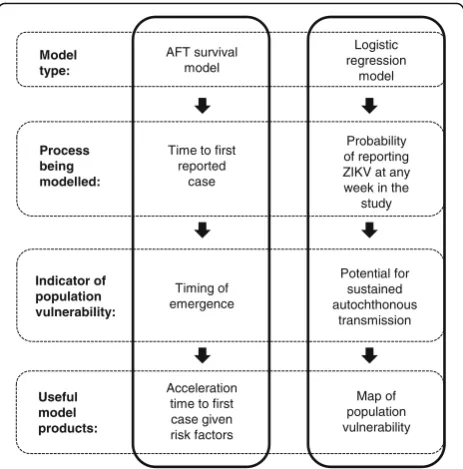
An overview of the modelling approach is summarised in Fig. 1 and Table 1. We used logistic regression that accounted for serial dependence in the longitudinal sur-veillance data and survival modelling approaches. It is important to account for serial dependence to ensure model output is not misleading given the assumption of independent observations [37]. For details on model formation and assumptions see Additional file 2, but briefly, the logistic regression was used to estimate the
probability of ZIKV being reported in a municipalityiat week t. Except for the municipality with the index case for the study area, at the start of the study period the outcome was negative, y = 0, and remained at y = 0 for eachtuntil at least 1 ZIKV case was detected, changing the outcome to y = 1. If an outcome was detected, the outcome remained at y = 1 until the end of the study period (Table 2). We consider this a valid assumption given that most municipalities reporting ZIKV had epi-demiological incidence curves typical of infectious dis-eases (i.e. increase, peak, and decrease in cases over time). Furthermore, almost 99% of these municipalities contin-ued reporting ZIKV by the last week in the study period.
A survival regression model was used to estimate the time t to report a first case of ZIKV in municipality i, under the assumption that all municipalities can experi-ence the event of reporting ZIKV. We adopted a para-metric technique to efficiently use all of the information we had about the observations. Assuming that the pres-ence of the first reported case of Zika accelerates the in-fection growth rate exponentially and then taking into consideration that the number of cases decays within a timeframe due to different processes [36], we modeled the time to the first report of ZIKV in municipalities with an accelerated failure time (AFT) model. Results from the AFT model can be used to quantify the role of variables in accelerating or slowing the time to the event (i.e. first reported case at week t). The distributional form of the baseline hazard was assessed using diagnos-tic procedures based on Akaike’s information criterion (AIC) and from graphical examination. The effect of
Useful model products:
Acceleration time to first case given risk factors
Map of population vulnerability Model
type:
AFT survival model
Logistic regression
model
Process being modelled:
Time to first reported
case
Probability of reporting ZIKV at any week in the
study
Indicator of population vulnerability:
Timing of emergence
Potential for sustained autochthonous
transmission
[image:3.595.306.538.87.322.2]time-dependent variables to influence the hazard over time was accommodated by including variable observa-tions at weektfrom t= 0 up to the week of the first re-ported case as formatted for right-censored data (Table2).
Explanatory variables
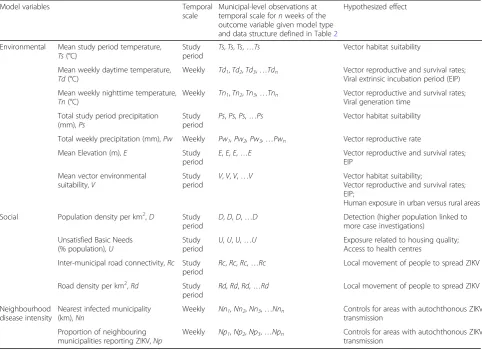
For details on explanatory variables see Additional file2, but briefly, environmental variables explored were those that are known determinants of vector abundance and ac-tivity, as well as ZIKV development rates in mosquitoes. A
[image:4.595.57.540.99.449.2]vector environmental suitability variable came from a pre-viously developed composite measure ofAedesspp. vector habitat and arbovirus transmission suitability at a 5 km resolution [31]. Total and weekly study period precipitation variables were derived at 0.1 degree latitude/ longitude resolution from Integrated Multi-satellitE Retrievals for GPM (IMERG) from NASA [38]. Study period and weekly mean surface daytime and nighttime temperature variables were derived at 0.05 degree latitude/ longitude resolution from Moderate Resolution Imaging Table 1Summary of modelling approach given variables, their structure and hypothesized effects
Model variables Temporal
scale
Municipal-level observations at temporal scale fornweeks of the outcome variable given model type and data structure defined in Table2
Hypothesized effect
Environmental Mean study period temperature, Ts(°C)
Study period
Ts,Ts,Ts,…Ts Vector habitat suitability
Mean weekly daytime temperature, Td(°C)
Weekly Td1,Td2,Td3,…Tdn Vector reproductive and survival rates;
Viral extrinsic incubation period (EIP)
Mean weekly nighttime temperature, Tn(°C)
Weekly Tn1,Tn2,Tn3,…Tnn Vector reproductive and survival rates;
Viral generation time
Total study period precipitation (mm),Ps
Study period
Ps,Ps,Ps,…Ps Vector habitat suitability
Total weekly precipitation (mm),Pw Weekly Pw1, Pw2, Pw3,…Pwn Vector reproductive rate
Mean Elevation (m),E Study
period
E,E,E,…E Vector reproductive and survival rates;
EIP
Mean vector environmental suitability,V
Study period
V,V,V,…V Vector habitat suitability;
Vector reproductive and survival rates; EIP;
Human exposure in urban versus rural areas
Social Population density per km2,D Study
period
D,D,D,…D Detection (higher population linked to
more case investigations)
Unsatisfied Basic Needs (% population),U
Study period
U,U,U,…U Exposure related to housing quality;
Access to health centres
Inter-municipal road connectivity,Rc Study period
Rc,Rc,Rc,…Rc Local movement of people to spread ZIKV
Road density per km2,Rd Study period
Rd,Rd,Rd,…Rd Local movement of people to spread ZIKV
Neighbourhood disease intensity
Nearest infected municipality (km),Nn
Weekly Nn1,Nn2,Nn3,…Nnn Controls for areas with autochthonous ZIKV
transmission
Proportion of neighbouring municipalities reporting ZIKV,Np
Weekly Np1,Np2,Np3,…Npn Controls for areas with autochthonous ZIKV
transmission
Table 2Example structure of the serial outcome variables used in the logistic regression and the accelerated failure time (AFT) models as derived from the 48 week ZIKV surveillance data for a positive outcome (y = 1), negative outcome (y = 0), or right-censored data
Modelling approach Possible outcome, y Weeks of study period
1 2 3 4 5 6 … 48
Logistic regression Index case 1 1 1 1 1 1 … 1
First case detected in week 3 0 0 1 1 1 1 … 1
No cases detected 0 0 0 0 0 0 … 0
AFT model Index case 1 – – – – – … –
First case detected in week 3 0 0 1 – – – … –
[image:4.595.58.538.623.732.2]Spectroradiometer (MODIS) [39]. Elevation data came from a 90 m resolution digital elevation model [40].
Social variables were considered as determinants of ZIKV transmission within and between municipalities. Data for municipal population size were available from the
Colombian Government (DANE; http://www.dane.gov.co)
and were converted to densities using municipal areas. Our measure of poverty was the percentage of the munici-pal population with unsatisfied basic needs (UBN). UBN is a common poverty metric for Latin America [32, 41] and was available from the Departamento Administrativo Nacional de Estadística (DANE: http://www.dane.gov.co). Municipal road density was considered a measure of human connectivity within a municipality, and obtained
from the Center for International Earth Science
Information Network (CIESIN) [42]. We used the same road network dataset to calculate a measure of inter-municipal connectivity as the number of roads entering/ leaving the municipality.
Neighbourhood infection intensity variables controlled for the spatial distribution and temporal progression of cases reported in municipalities. The rate at which municipal populations become infected likely depends on their proximity to ZIKV-affected areas. We tested two variables to represent proximity to other infected municipalities at time tas distance (km) to the nearest infected municipality, and the proportion of infected neighbouring municipalities. These variables were cre-ated using the imputed surveillance data, in that, once a municipality had reported ZIKV it was assumed to remain a source of ZIKV over the course of the study period. In the logistic regression models we accounted for the temporal progression of ZIKV by including a categorical variable for week of reporting as a proxy for the growth rate of infection in the population.
Model building
Missing values in the MODIS temperature data
(approximately 10%) were imputed using a two-step approach (see Additional file 2). For the logistic model, the variables were centred by their mean and then scaled to remove collinearity and to ensure that the regression coefficient estimates were on the same scale. For the AFT model, the variables were rescaled, as appropriate, to have meaningful baseline hazards by subtracting the minimum value from each observation. We derived the functional form of the variables with the response vari-able of the respective model and verified that they did not violate model assumptions of linearity. We examined all pairwise correlations among predictor variables. Highly correlated variables (Pearson’s r≥ 0.5) were not included in the same multivariable model.
We built multivariable models to investigate the role of environmental, social and neighbourhood disease
intensity variables. This included assessing for different temporal scales of temperature and precipitation data (e.g. study period mean, current and weekly time lags) Also, we tested for interacting effects between poverty and each of our connectivity metrics which could indicate that underreporting in poorer areas results from less road infrastructure and/or reduced mobility of infected people into these areas.
Model selection and validation
We selected our best logistic and AFT models using a forward stepwise process given the criteria of retaining statistically significant variables (P-values from the t-test and Wald test of the individual coefficients of the logis-tic and AFT models respectively), minimising AIC and maximising model parsimony (i.e. when competing models were within 2 AIC of each other we selected the more parsimonious model), and conforming to the assumptions of parametric modelling. For the logistic regression we calculated the predictive ability of the best selected model using the receiver operating characteris-tic (ROC) area under the curve (AUC) in R using package ROCR. The AUC value indicated the ability of the model to correctly classify the observed outcomes: 0.9–1.0, excellent; 0.8 to < 0.9, good; 0.7 to < 0.8, fair; 0.6 to < 0.7, poor; 0.5 to < 0.6, fail [43]. The AFT model was validated by verifying that the residuals conformed to the parametric distribution and by using a 10-fold validation method to check model accuracy (Additional file3).
Predicting population vulnerability to ZIKV emergence Our best logistic regression model was used to map population vulnerability to sustained autochthonous transmission of ZIKV as the relative probability of reporting ZIKV given environmental and connectivity variables. This provides an estimate of the general vulnerability irrespective to the space-time progression of the disease and reporting biases associated with poverty. Model predictions were calculated for a hexagonal grid of the median area of Colombia munici-palities (275 km2) to show population vulnerability at a homogeneous spatial scale. ArcGIS Map v. 10.5 (www.esri.com) was used for all mapping.
of variable values. Variable values have an effect to in-crease time to the first report when the acceleration fac-tor (AF) value is ≥ 1 and decrease time to the first report when the AF is < 1.
Results
Surveillance data
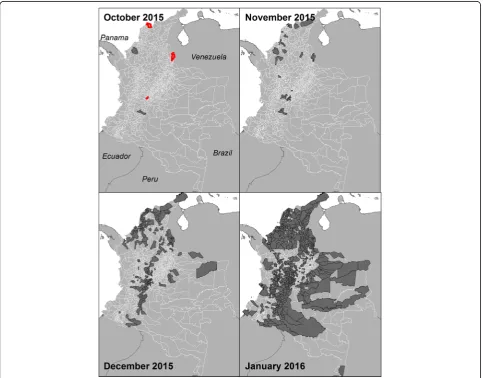
We identified three spatially distinct locations on October 24th 2015 in the municipalities of Barranquilla, Girardot and San José de Cúcuta from backtracking case reports greater than 1 on January 9th 2016 (Fig.2). We used October 24th 2015 as the start of our study period, which aligns well with a Pan American Health Organization report suggesting that case incidence began growing exponentially by approximately week 39 (i.e. October 2015) [35]. From October 24th 2015, the number of municipalities reporting their first case increased up to a peak in January 2016, and then de-creased to approximately 1–2 municipalities per week
in the later epidemic phase (Fig. 3). Municipalities with early emergence dates clustered around the early case locations (Fig. 2). The west coast, central-north and south-eastern regions of the country had later emergence dates. There are also notable outliers of municipalities that were late to report (or did not re-port ZIKV) and were surrounded by municipalities that reported ZIKV early, such as in the northern part of the country by January 2016. Of the 1062 mu-nicipalities with surveillance data, 1019 had with complete time series of variable data available for model building. By the end of the study period 797 of 1019 municipalities (78%) had reported a first case of ZIKV.
Factors affecting probability of ZIKV emergence
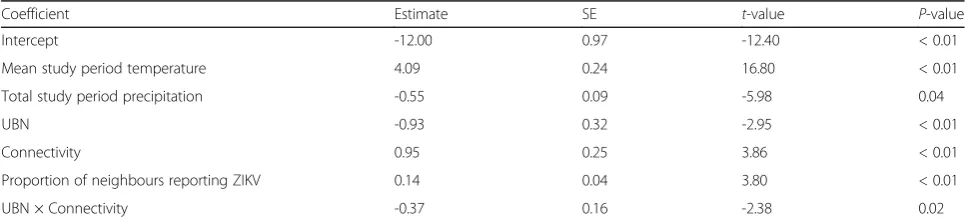
The best performing logistic regression model (Table 3) had an AUC = 0.91. The probability of reporting ZIKV increased with warmer mean study period nighttime
[image:6.595.57.541.326.704.2]temperatures, higher inter-municipal connectivity, an increasing proportion of neighbouring municipalities reporting ZIKV, and time. The reporting probability decreased with increasing total study period precipita-tion, and increasing poverty, especially in areas with lower connectivity (Additional file 3: Figure S3.1.a). See Additional file 3 for details on model output, variable effects and candidate models.
Our best model was used to calculate the relative prob-ability of reporting ZIKV to identify populations vulner-able to sustained autochthonous transmission using variables: mean study period nighttime temperature, mean study period total precipitation and inter-municipal con-nectivity. The variables for UBN and reporting week were not included (i.e. set to 0). The relative probability, as mapped over a hexagon grid, indicates that populations with high vulnerability to ZIKV emergence are clustered and occur in the northern and central regions of Colombia (Fig. 4). In visually assessing for correlations with temperature and precipitation it appears that precipi-tation is not a limiting factor unless it is low and occurs congruently with low temperature, as occurs in high
alpine areas in central Colombia (Fig. 4). Connectivity appears to help facilitate higher vulnerability in areas where temperature and precipitation are not limiting, which is more apparent in the eastern half of the country (Fig.4).
Factors affecting time to ZIKV emergence
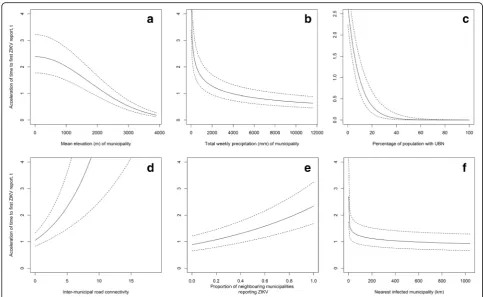
In the best AFT model (Table4), the environmental var-iables, particularly elevation and precipitation, had a sig-nificant negative impact on the time to the first reported ZIKV case in municipalities. That is, increases in elevation and precipitation slowed the expected time by a factor of 1.18 (i.e. 1/acceleration factor when the accel-eration factor is < 1) and 1.41, respectively (Fig. 5a, b). Social determinants of ZIKV transmission also signifi-cantly affected the time to the first report. Specifically, an increase in the percentage of the municipal popula-tion with UBN delayed the expected time by a factor of 1.07 (Fig.5c), while inter-municipal connectivity acceler-ated the expected time by a factor 1.17 (Fig. 5d). The significant interaction of these variables indicated that more wealthy areas reported a first case more quickly, especially when inter-municipal connectivity was high (Additional file 3: Figure S3.2.b). As for neighbourhood disease intensity variables, an increase in proportion of infected neighbouring municipalities accelerated signifi-cantly the expected first reporting time by a factor of 2. 63 (Fig. 5e). Neighbouring infected municipalities were associated with decreasing the time to the first report when located, on average, within about 100 km (Fig.5f). Increasing distance to the nearest infected municipality slowed down the expected time of first report by a factor 1.12. See Additional file 3 for details on candidate models and best model variable effects defined by sur-vival and hazard functions.
Discussion
Public health management of ZIKV is informed by the timely identification of vulnerable populations. In this study we used two modelling approaches to characterize population vulnerability as indicators for sustained Fig. 3The number of municipalities reporting their first case of Zika,
[image:7.595.58.291.87.273.2]per week, from October 2015 to September 2016
Table 3Parameters of the best model for the probability of reporting a first case of ZIKV in municipalityiat weekt
Coefficient Estimate SE t-value P-value
Intercept -12.00 0.97 -12.40 < 0.01
Mean study period temperature 4.09 0.24 16.80 < 0.01
Total study period precipitation -0.55 0.09 -5.98 0.04
UBN -0.93 0.32 -2.95 < 0.01
Connectivity 0.95 0.25 3.86 < 0.01
Proportion of neighbours reporting ZIKV 0.14 0.04 3.80 < 0.01
UBN × Connectivity -0.37 0.16 -2.38 0.02
[image:7.595.56.539.603.714.2]Fig. 4Population vulnerability to ZIKV emergence as derived from the top selected model for the probability of reporting a first ZIKV case. The mapped values for the variables in the top selected model (respectively mean study period nighttime temperature, total study period precipitation and inter-hexagon road connectivity)
Table 4Parameters of the best model estimating time to first report of ZIKV in municipalityiat weekt
Variable Weight mean Coef SE(Coef) WaldP AF
Mean elevation 4.02 -0.168 0.008 < 0.01 0.85
Total weekly precipitation (term 1) -2.55 -0.323 0.028 < 0.01 0.71
Total weekly precipitation (term 2) 13.60 -0.023 0.003 < 0.01
UBN 5.98 -0.076 0.021 < 0.01 0.93
Connectivity 2.79 0.157 0.029 < 0.01 1.17
Proportion of neighbours reporting ZIKV 0.252 0.968 0.093 < 0.01 2.63
Distance to nearest municipality reporting ZIKV -1.30 -0.115 0.025 < 0.01 0.89
UBN X connectivity -0.014 0.004 < 0.01 0.99
Baseline parameters
log(scale) 3.274 0.154 < 0.01
log(shape) 0.524 0.025 < 0.01
[image:8.595.56.539.555.725.2]autochthonous ZIKV transmission and timing to emer-gence. Results from our dual-modelling approach pro-vide insights as to the roles of environmental, social and neighbourhood disease intensity factors on ZIKV emer-gence patterns.
The probability of reporting ZIKV was higher at warm temperatures and the timing to its detection was faster at lower elevations. Elevation is correlated with tem-perature (lower elevations being warmer) but may also be a proxy for different habitats that have more complex interactions with mosquito survival and reproduction [15]. Warmer regions support larger vector populations via shorter vector generation times, and higher survival rates as well as shorter virus generation times resulting in higher rates of infective bites [13, 14, 44]. Nighttime temperature was a better predictor for ZIKV emergence than daytime temperature. In Colombia, nighttime temperatures drop below the suitable range for Aedes species reproduction and survival of 16–35 °C more often than daytime temperatures exceed this range [13]. As elevation increases, so too does the range in daily temperature, and this has been found to negatively impact Ae. aegypti survival and potential to transmit
dengue [15, 45]. The estimated survival and hazard
functions, given the range of elevation in Colombia,
were in close agreement with a study reporting Ae.
aegypti to be abundant up to 2200 m in Colombia
(Additional file3: Figure S3.2.c) [46].
[image:9.595.55.539.86.383.2]weekly time-scale) was essentially an immediate rather than a time-lagged effect. Therefore, we may be detect-ing an effect of rainfall on human behaviour, in that, ill people are less likely to travel to health centres when it is raining. This is the most likely explanation as the ob-served association was between precipitation during the week of reporting which would not have had time to
im-pact ZIKV transmission via effects on mosquito
reproduction or activity.
The role of poverty on vector-borne disease dynam-ics is also complex [53]. Impoverished areas have been linked to higher disease incidence [16, 18]. Poor quality services, such as insufficient plumbing, lead to water storage containers and more standing water providing greater breeding habitat and consequently higher vector abundance [17]. Further, poor quality housing, such as broken or absent screens on win-dows, can increase human exposure [54]. However, we observed a negative relationship between poverty level and detection of ZIKV, and time to the first re-ported ZIKV case. It may be that poor areas have more limited access to health centres, and thus fewer people are reporting suspect cases for investigation [19]. Inter-municipal connectivity can also be a proxy for infected people spreading infection (i.e. small-scale human movements) [55]. In our statistical models we found evidence that lower inter-municipal connectiv-ity in poor areas reduces the detection of ZIKV, and increases the time to the first reported case given the significant interaction between the connectivity and poverty variables. Poorer areas may also have lower access to education highlighting the presence of the epidemic, and the need to report suspect cases [20]. We do not suggest that poorer areas are less vulner-able to sustain autochthonous transmission than wealthy areas, though further studies are needed to determine the mechanism(s) behind the negative asso-ciation we detected.
Through our dual-modelling approach we detected different aspects of the emergence dynamics as reflected through the temporal scales of the environ-mental variables retained in the best models. The logis-tic regression approach detected the influence of temperature and precipitation over longer-term (study period mean) rather than shorter-term (weekly and lagged means) time scales. Using mean environmental data from across the study period is likely better at de-fining areas of habitat suitability and vector occurrence than short time-scale trends, as also found for an index ofAedesspp. vector habitat and arbovirus transmission suitability [31]. Even if weekly temperature and precipi-tation are suitable for vectors over short periods, condi-tions likely need to be sustained year-round for vectors to survive. Conversely, the AFT best model retained the
shorter-term total weekly precipitation variable rather than total study period precipitation, although, as de-scribed above, the effect of precipitation was likely on human behaviour. The survival model also provides a reference value for the distance (within 100 km) over which infected municipalities may most likely influence the timing of ZIKV emergence. This result underlines the importance of having effective surveillance systems that can use detection of disease in one location to act as early warning indicators for nearby populations.
Maps of estimated population vulnerability in coun-tries newly affected by ZIKV can guide surveillance and target prevention and preparedness strategies. Using the logistic regression model we estimated the population vulnerability to sustained autochthonous transmission of ZIKV given our long-term temperature and precipitation covariates, and road connectivity. We did not include ef-fects of poverty because we think its effect was mostly driven by underreporting rather than impacts on trans-mission. Also we did not account for the spatial progres-sion of ZIKV, though this can be useful for management preparedness if the goal is to estimate population vulnerability relative to locations of index cases or areas at high risk to disease importation. Whether our model can be generalised to other tropical and sub-tropical countries remains to be studied. However if it can, our approach may have the ability to predict vulnerability of ZIKV infection at a local scale more widely in Central and South America.
Study limitations arise from the quality and avail-ability of surveillance data. The spatial progression of ZIKV through Colombian municipalities is mostly clustered but there are notable outliers. Municipalities in which ZIKV was not detected could be the result of (i) inadequate surveillance (false negatives from asymptomatic or sub-clinical infections, underreport-ing when clinical infections were missed, misdiagnosis with other diseases) [2, 56, 57]; (ii) virus absence where ZIKV transmission is possible (true negatives); or (iii) virus absence where ZIKV transmission is not possible, such as in areas of high elevation with sub-zero temperatures (true negatives). To reduce error from inadequate surveillance we grouped suspected and confirmed ZIKV cases. Suspected case data have been used to reliably represent ZIKV dynamics [58]. Yet, we may have overestimated the effect of the vari-ables retained in our models if suspected cases were
misdiagnosed from co-circulating dengue and
chikungunya [56, 57]. We expect this error to be low given that INS diagnostic protocols tested for these diseases if they were known to be circulating in areas where the patient lived or had visited.
available from the Pan American Health Organization at the website http://www.paho.org/hq/index.php?options=com_ content&view=article&id=12390&Itemid=42090&lang=en), but exist at the country level. We backtracked case counts retrospectively for municipalities with counts greater than 1 on January 9th, 2016 assuming cases doubled weekly [36]. Our assumption may fail in areas where transmission dynamics do not follow this exponential growth rate, as could be caused by very high or low rates of movement of infected people [55]. Even if we had available surveillance data prior to 2016, these earlier data had higher rates of underreporting from areas where ZIKV circulation had yet to be confirmed and suffered from changing diagnostic protocols [59,60]. Also, under-reporting is commonplace in disease surveillance when an estimated 80% of cases are asymptomatic [2]. The first reported case in a municipality is unlikely to be the first actual case given the true number of infections. However, the difference in timing for the actual first case occurring in Colombia and the detection of the first cases by surveillance is expected to be longer, than the time lag between a first case in a municipality and detection of cases by surveillance after the ZIKV outbreak had been recognised and surveillance sys-tems alerted.
All of these issues could affect the coefficients of vari-ables in the final models. However, it would be expected that these issues would affect all locations equally (with inter-municipality variations in reporting rates being largely accounted for by the poverty metric), and while the precise coefficient values would be different if all cases were captured, the variables identified as signifi-cant, and their relative importance as determinants of local vulnerability, should be robust.
Conclusions
Public health management of ZIKV has been chal-lenged by the rapid spread of this disease through the Americas. We present a quantitative approach using two modelling frameworks that are relatively easy to implement and interpret. The logistic regres-sion and AFT models focused on different aspects of the emergence dynamics. The logistic regression model detected variables associated with environ-mental suitability for vector abundance and ZIKV
transmission, while the survival model detected
finer-scale processes affecting the timing of emer-gence. We suggest effective management of ongoing and future ZIKV infection will benefit from being able to both geo-locate areas of at risk for sustained autochthonous transmission, and predict the timing of emergence in the vulnerable areas. Therefore, lim-ited public health resources can be focused more ac-curately on high risk locations and times.
Additional files
Additional file 1:Case definitions for Zika virus infection in Colombia. 1.1 Suspected cases. 1.2 Confirmed cases. 1.3 References. (DOCX 31 kb)
Additional file 2:Methodology.2.1Data cleaning.Table S2.1.a.Number of observations and percentage of missing data.Table S2.1.b. Model parameter estimates, standard error andt-value.Table S2.1.c. Model parameter estimates, standard error andt-value.Table S2.1.d. Correlation between existing and imputed data.2.2Explanatory variables.2.2.1
Environmental.2.2.2Social.2.2.3Neighbourhood disease intensity.
Table S2.2.3.a.Summary statistics for explanatory variables.2.3Model formulation for a binary longitudinal response variable.2.3.1Logistic regression.2.3.2Accelerated failure time model.2.4References. (DOCX 56 kb)
Additional file 3:Model Output.3.1Logistic regressionTable S3.1.a.
Parameter estimates, standard errors, t-values and p-values.Table S3.1.b.
Variable functional forms.Figure S3.1.a.Probability of reporting a first case given a) mean study period nighttime temperature (°C), b) total study period precipitation (mm), c) UBN at high and low levels of inter-municipal road connectivity, and d) proportion of neighbouring municipalities reporting ZIKV.3.2Accelerated failure time model.Figure S3.2.a.a) Density, b) survivor and c) hazard functions at mean covariate values.Table S3.2.a.Variable functional forms.Figure S3.2.b.Acceleration time to a first case given UBN and inter-municipal connectivity, and other model variables at their median values.Figure S3.2.c.(i) survival and (ii) hazard functions given a) municipality elevation (m), b) total weekly precipitation (mm), c) UBN, d) inter-municipal connectivity, f) proportion of neighbouring municipalities reporting ZIKV, and g) nearest municipality reporting ZIKV (km).3.3Variable effects.3.3.1AIC model comparisons.Table S3.3.1.a.ΔAIC between best and candidate models.Table S3.3.1.b.ΔAIC between best and candidate models.3.4Model validation.Table S3.4.a10-fold cross-validation folds for training and validation data and their mean predictedt¼ex0
iβτ; t>0 and
difference (i.e. error) between their values.3.5References. (DOCX 1161 kb)
Abbreviations
AF:Acceleration factor; AFT: Accelerated failure time; AIC: Akaike’s information criterion; AUC: Area under the curve; DANE: Departamento Administrativo Nacional de Estadística; EW: Epidemiological week; PAHO: Pan American Health Organization; ROC: Receiver operating characteristic; UBN: Unsatisfied basic needs; ZIKV: Zika virus
Acknowledgements
Many thanks to Dr Serge-Olivier Kotchi for technical support in using satellite imagery data.
Funding
This study was funded by the Public Health Agency of Canada. This article was reviewed and approved for submission by the funding source.
Availability of data and materials
All data analysed during this study were freely available. Access to obtain these data is described in the article.
Authors’contributions
EER and NHO conceived the study. EER conducted the analysis with contributions from TP and YP. MM described the Colombian Zika surveillance system protocols. All authors read and approved the final manuscript.
Ethics approval and consent to participate
Formal ethical review was not sought because, in line with current guidelines [61], the study relied solely on secondary use of anonymous information, and there was no data linkage, recording or dissemination of results that could generate identifiable information.
Competing interests
Publisher’s Note
Springer Nature remains neutral with regard to jurisdictional claims in published maps and institutional affiliations.
Author details
1Public Health Risk Sciences Division, National Microbiology Laboratory,
Public Health Agency of Canada, Saint-Hyacinthe, Québec, Canada.2Public Health Risk Sciences Division, National Microbiology Laboratory, Public Health Agency of Canada, Guelph, Ontario, Canada.
Received: 27 January 2018 Accepted: 23 April 2018
References
1. Faria NR, Azevedo R do S da S, Kraemer MUG, Souza R, Cunha MS. Zika virus in the Americas: early epidemiological and genetic findings. Science. 2016;352:345–9. 2. Musso D, Gubler DJ. Zika Virus. Clin Microbiol Rev. 2016;29:1098–6618. 3. Cao-Lormeau V-M, Blake A, Mons S, Lastère S, Roche C, Vanhomwegen J, et
al. Guillain-Barre Syndrome outbreak associated with Zika virus infection in French Polynesia: a case-control study. Lancet. 2016;387:1531–9. 4. Parra B, Lizarazo J, Jiménez-Arango JA, Zea-Vera AF, González-Manrique G,
Vargas J, et al. Guillain-Barré Syndrome associated with Zika virus infection in Colombia. New Engl J Med Med. 2016;375:1513–23.
5. Honein MA, Dawson AL, Petersen EE, Jones AM, Lee EH, Yazdy MM, et al. Birth defects among fetuses and infants of US women with evidence of possible Zika virus infection during pregnancy. JAMA. 2016;317:59–68. 6. D’Ortenzio E, Matheron S, Yazdanpanah Y. Evidence of sexual transmission
of Zika virus. N Engl J Med. 2016;374:2195–8.
7. Musso D, Roche C, Robin E, Nhan T, Teissier A, Cao-Lormeau VM. Potential sexual transmission of Zika virus. Emerg Infect Dis. 2015;21:359–61. 8. Towers S, Brauer F, Castillo-Chavez C, Falconar AKI, Mubayi A, Romero-Vivas CME.
Estimate of the reproduction number of the 2015 Zika virus outbreak in Barranquilla, Colombia, and estimation of the relative role of sexual transmission. Epidemics. 2016;17:50–5.
9. Pacheco O, Beltrán M, Nelson C a, Valencia D, Tolosa N, Farr SL, et al. Zika virus disease in Colombia - preliminary report. N Engl J Med. 2016:1–10. https://doi.org/10.1056/NEJMoal1604037.
10. Shi W, Zhang Z, Ling C, Carr MJ, Tong Y, Gao GF. Increasing genetic diversity of Zika virus in the Latin American outbreak. Emerg Microbes Infect. 2016;5:e68.
11. Zhang Q, Sun K, Chinazzi M, Pastore y Piontti A, Dean NE, Rojas DP, et al. Spread of Zika virus in the Americas. Proc Natl Acad Sci USA. 2017;114:E4334–43. 12. Honório NA, Castro MG, Barros FS, Magalhaes MAFM, Sabroza PC. The
spatial distribution ofAedes aegyptiandAedes albopictusin a transition zone, Rio de Janeiro, Brazil. Cad Saúde Pública. 2009;25:1203–14. 13. Carrington LB, Armijos MV, Lambrechts L, Barker CM, Scott TW. Effects of
fluctuating daily temperatures at critical thermal extremes onAedes aegypti life-history traits. PLoS One. 2013;8:e58824.
14. Tjaden NB, Thomas SM, Fischer D, Beierkuhnlein C. Extrinsic incubation period of dengue: knowledge, backlog, and applications of temperature dependence. PLoS Negl Trop Dis. 2013;7:e2207.
15. Lozano-Fuentes S, Hayden MH, Welsh-Rodriguez C, Ochoa-Martinez C, Tapia-Santos B, Kobylinski KC, et al. The dengue virus mosquito vectorAedes aegyptiat high elevation in México. Am J Trop Med Hyg. 2012;87:902–9. 16. Hotez PJ, Murray KO, Buekens P. The Gulf Coast: a new American underbelly
of tropical diseases and poverty. PLoS Negl Trop Dis. 2014;8:4–6. 17. Brunkard JM, Luis J, López R, Ramirez J, Cifuentes E, Rothenberg SJ, et al.
Dengue fever seroprevalence and risk factors, Texas - Mexico. Emerg Infect Dis. 2007;13:1477–83.
18. Reiter P, Lathrop S, Bunning M, Biggerstaff B, Singer D, Tiwari T, et al. Texas lifestyle limits transmission of dengue virus. Emerg Infect Dis. 2003;9:86–9. 19. Wijayanti SPM, Porphyre T, Chase-Topping M, Rainey SM, McFarlane M,
Schnettler E, et al. The importance of socio-economicversusenvironmental risk factors for reported dengue cases in Java, Indonesia. PLoS Negl Trop Dis. 2016;10:e0004964.
20. Ali S, Gugliemini O, Harber S, Harrison A, Houle L, Ivory J, et al. Environmental and social change drive the explosive emergence of Zika virus in the Americas. PLoS Negl Trop Dis. 2017;11:e0005135.
21. Stoddard ST, Morrison AC, Vazquez-Prokopec GM, Soldan VP, Kochel TJ, Kitron U, et al. The role of human movement in the transmission of vector-borne pathogens. PLoS Negl Trop Dis. 2009;3:e481.
22. Vazquez-Prokopec GM, Bisanzio D, Stoddard ST, Paz-Soldan V, Morrison AC, Elder JP, et al. Using GPS technology to quantify human mobility, dynamic contacts and infectious disease dynamics in a resource-poor urban environment. PLoS One. 2013;8:e58802.
23. Monaghan AJ, Morin CW, Steinhoff DF, Wilhelmi O, Hayden MH, Quattrochi DA, et al. On the seasonal occurrence and abundance of the Zika virus vector mosquitoAedes aegyptiin the contiguous United States. PLoS Curr Outbreaks. 2016;https://doi.org/10.1371/currents.outbreaks. 50dfc7f46798675fc63e7d7da563da76.
24. Nah K, Mizumoto K, Miyamatsu Y, Yasuda Y, Kinoshita R, Nishiura H. Estimating risks of importation and local transmission of Zika virus infection. PeerJ. 2016;4:e1904.
25. Kucharski AJ, Funk S, Eggo RM, Mallet H, Edmunds WJ, Nilles EJ. Transmission dynamics of Zika virus in island populations: a modelling analysis of the 2013–2014 French Polynesia outbreak. PLoS Negl Trop Dis. 2016;10:e0004726. 26. Musso D, Lanteri MC. Zika virus in Singapore: unanswered questions. Lancet
Infect Dis. 2017;17:782–3.
27. Pierson TC, Graham BS. Zika Virus: immunity and vaccine development. Cell. 2016;167:625–31.
28. Musso D, Cao-Lormeau VM, Gubler DJ. Zika virus: following the path of dengue and chikungunya? Lancet. 2015;386:243–4.
29. Peel MC, Finlayson BL, McMahon TA. Updated world map of the Köppen-Geiger climate classification. Hydrol Earth Syst Sci. 2007;11:1633–44.
30. Kraemer MUG, Sinka ME, Duda K, Mylne A, Shearer FM, Brady OJ, et al. The global compendium ofAedes aegyptiandAe. albopictusoccurrence. Sci Data. 2015;2:150035.
31. Messina JP, Kraemer MU, Brady OJ, Pigott DM, Shearer FM, Weiss DJ, et al. Mapping global environmental suitability for Zika virus. eLife. 2016;5:e15272. 32. Diaz BY, Salazar RCA, Pinzon RP. Multidimensional poverty in Colombia,
1997 - 2010, ISER Working Paper Series, No. 2013-03, ISER, Colchester. 2013. Available at:http://hdl.handle.net/10419/91688.
33. Tolosa Pérez N, Ospina Martinez ML, Martinez Duran ME, Pacheco Garcia OE, Quijada BH. Protocolo de Vigilancia en Salud Pública: Enfermedad por Virus Zika. Inst. Nac. Salud. 2016;PRO-R02.05:1–27.
34. Camacho E, Paternina-Gomez M, Blanco PJ, Osorio JE, Aliota MT. Detection of autochthonous zika virus transmission in Sincelejo, Colombia. Emerg Infect Dis. 2016;22:927–9.
35. Pan American Health Organization. World Health Organization. Zika - Epidemiological Report Colombia. Washington, D.C.: WHO; 2017. 36. Ogden NH, Fazil A, Safronetz D, Drebot M, Wallace J, Rees EE, et al. Risk of
travel-related cases of Zika virus infection is predicted by transmission intensity. Parasit Vectors. 2017;10:41.
37. Beck N, Katz J, Tucker R. Taking Time Seriously: Time-series-cross-section analysis with a binary dependent variable. Am J Pol Sci. 1998;42:1260–88. 38. Huffman GJ, Stocker EF, Bolvin DT, Nelkin EJ. Integrated Multi-satellitE
Retrievals for GPM (IMERG), version 4.4. NASA’s Precipitation Processing Center,ftp://jsimpson.pps.eosdis.nasa.gov/NRTPUB/imerg/gis/2015/. Accessed 30 Jan 2016.
39. Wan Z, Hook S, Hulley G. MOD11C2 MODIS/Terra Land Surface Temperature/Emissivity 8-Day L3 Global 0.05Deg CMG V006. 2015, distributed by NASA EOSDIS LP DAAC,https://doi.org/10.5067/MODIS/ MOD11C2.006. Accessed 30 Jan 2016.
40. Jarvis A, Reuter HI, Nelson A, Guevara E. Hole-filled SRTM for the globe Version 4, available from the CGIAR-CSI SRTM 90m Database (http://srtm.csi.cgiar.org). 2008. 41. Bustamente Roldan J, Jaramillo Herrera C, Chamie M. Quality of life national
survey methodology. Bogota, D.C., Colombia: National Administrative Department of Statistics, DANE; 2011.
42. Center for International Earth Science Information Network (CIESIN)/ Columbia University, and Information Technology Outreach Services (ITOS)/ University of Georgia. 2013. Global Roads Open Access Data Set, Version 1 (gROADSv1). Palisades, NY: NASA Socioeconomic Data and Applications Center (SEDAC). Downloaded fromhttp://sedac.ciesin.columbia.edu/data/ set/groads-global-roads-open-access-v1.
43. Hosmer DW, Lemeshow S. Applied Logistic Regression. 2nd ed. New York, USA: John Wiley & Sons; 2004.
44. Alto BW, Juliano SA. Precipitation and temperature effects on populations ofAedes albopictus(Diptera: Culicidae): Implications for range expansion. J Med Entomol. 2001;38:646–56.
46. Suárez MF, Nelson MJ. Registro de altitud del aedes aegypti en Colombia. Biomédica. 1981;1:225.
47. Choi Y, Tang CS, McIver L, Hashizume M, Chan V, Abeyasinghe RR, et al. Effects of weather factors on dengue fever incidence and implications for interventions in Cambodia. BMC Public Health. BMC Public Health. 2016;16:241.
48. Althouse BM, Hanley KA, Diallo M, Sall AA, Ba Y, Faye O, et al. Impact of climate and mosquito vector abundance on sylvatic arbovirus circulation dynamics in senegal. Am J Trop Med Hyg. 2015;92:88–97.
49. Morrison AC, Gray K, Getis A, Astete H, Sihuincha M, Focks D, et al. Temporal and geographic patterns ofAedes aegypti(Diptera: Culicidae) production in Iquitos, Peru. J Med Entomol. 2004;41:1123–42.
50. Barrera R, Amador M, MacKay AJ. Population dynamics ofAedes aegyptiand dengue as influenced by weather and human behavior in San Juan, Puerto Rico. PLoS Negl Trop Dis. 2011;5:e1378.
51. Pontes RJS, Freeman J, Oliveira-Lima JW, Hodgson JC, Spielman A. Vector densities that potentiate dengue outbreaks in a Brazilian city. Am J Trop Med Hyg. 2000;62:378–83.
52. Koenraadt CJM, Harrington LC. Flushing effect of rain on container-inhabiting mosquitoesAedes aegyptiandCulex pipiens(Diptera: Culicidae). J Med Entomol. 2008;45:28–35.
53. Mulligan K, Dixon J, Joanna Sinn C-L, Elliott SJ. Is dengue a disease of poverty? A systematic review. Pathog Glob Health. 2015;109:10–8. 54. Hotez PJ. America’s most distressed areas and their neglected infections:
the United States gulf coast and the district of Columbia. PLoS Negl Trop Dis. 2011;5:e843.
55. Stoddard ST, Forshey BM, Morrison AC, Paz-Soldan VA, Vazquez-Prokopec GM, Astete H, et al. House-to-house human movement drives dengue virus transmission. Proc Natl Acad Sci USA. 2013;110:994–9.
56. Calvo EP, Sánchez-Quete F, Durán S, Sandoval I, Castellanos JE. Easy and inexpensive molecular detection of dengue, chikungunya and zika viruses in febrile patients. Acta Trop. 2016;163:32–7.
57. Villamil-Gómez WE, Rodríguez-Morales AJ, Uribe-García AM, González-Arismendy E, Castellanos JE, Calvo EP, et al. Zika, dengue, and chikungunya co-infection in a pregnant woman from Colombia. Int J Infect Dis. 2016;51:135–8.
58. McGough SF, Brownstein JS, Hawkins JB, Santillana M. Forecasting Zika incidence in the 2016 Latin America outbreak combining traditional disease surveillance with search, social media, and news report data. PLoS Negl Trop Dis. 2017;11:e0005295.
59. Rasmussen SA, Jamieson DJ, Honein MA, Petersen LR. Zika virus and birth defects - reviewing the evidence for causality. N Engl J Med. 2016;374:1981–7. 60. Rojas DP, Dean NE, Yang Y, Kenah E, Quintero J, Tomasi S, et al. The
epidemiology and transmissibility of Zika virus in Girardot and San Andres Island, Colombia, September 2015 to January 2016. Eurosurveillance. 2016;21https://doi.org/10.2807/1560-7917.ES.2016.21.28.30283. 61. Tri-council (Canadian Institutes of Health Research, Natural. Sciences and