Description of Seedless Grape Drying and
Determination of Drying Rate
Wilton Pereira da Silva (Corresponding author)
Federal University of Campina Grande, Paraiba, Brazil
Tel: 55-833-333-2962 E-mail: [email protected]
Pedro Luiz do Nascimento
Federal University of Campina Grande, Paraiba, Brazil
E-mail: [email protected]
Cleide Maria Diniz Pereira da Silva e Silva
Federal University of Campina Grande, Paraiba, Brazil
E-mail: [email protected]
Josivanda Palmeira Gomes
Federal University of Campina Grande, Paraiba, Brazil
Ihsan Hamawand
National Centre for Engineering in Agriculture, University of Southern, Australia
E-mail: [email protected]
Received: February 27, 2014 Accepted: March 19, 2014
Abstract
This article compares some empirical models, with one or two parameters, used to describe seedless grape drying at low temperature. Chosen models have, as a common characteristic, an analytical expression for the derivative of dimensionless moisture content with respect to time. Comparison of the results for the simulations of drying kinetics indicates that, despite Page and Silva et alli models well represent the process, the best model is Peleg. For this model, the statistical indicators of the simulation can be considered excellent (the determination coefficient is R2 = 0.99944 and the chi-square is χ2 = 1.2335 x 10⁻³).
Keywords: Drying rate, Process time, Mathematical model, Raisins, Drying kinetics.
1. Introduction
Grapes are fruits among the most perishable foods, compared with other agricultural products. They are very susceptible to microbial decay and moisture loss. To prolong the consuming time of grapes, the drying mechanism is usually applied. This process results in a food very appreciated in several parts of the world: raisins. To increase the drying rate, a pretreatment is usually accomplished. According to Silva et al. (2012a), several pretreatment techniques involving the use of chemical additives are described in the literature (Pangavhane et al., 1999; Doymaz and Pala, 2002; Doymaz, 2006; Esmaiili et al., 2007). However, several authors observe that the demand for natural foods is increasing in many parts of the world. Thus, alternatives to chemical additives are used as pretreatment for the production of raisins, such as abrasion (Di Matteo et al., 2000) and dipping in hot water (Esmaiili et al., 2007; Ramos et al., 2010). For example, Esmaiili et al. (2007) studied drying of seedless grapes submitted to two types of pretreatments, as is described in the following. The grapes were dipped in an alkaline emulsion of ethyl oleate (EO) and also in hot water (HW) before drying. According to the authors, the EO solution was prepared at room temperature by adding 2% ethyl oleate to a 5% solution of potassium carbonate. For HW, tap water was heated to approximately 95 °C. Dipping times in EO and HW were 60 and 15 s, respectively.
empirical equations in drying simulations is emphasized.
The main objective of this article was to describe the thin-layer drying kinetics of seedless grapes, using empirical models. Hence, several models were selected and the selection obeyed the following criterion: for each selected model, mathematical expressions were obtained to calculate the drying rate and also the process time.
2. Material and methods
2.1 Experimental Data of Seedless Grape Drying
Experimental data obtained by Esmaiili et al. (2007) for the drying of seedless sultana grapes (Vitis vinifera L.) with hot air are explored in the present paper. In order to increase the skin’s permeability to moisture, a pretreatment was applied. The grapes were dipped for 15 s in hot water at 95 °C. The temperature of the drying air was 50 °C, its relative humidity was 10%, and its velocity was kept at 1.5 m s-1. The initial moisture content, Xi, was 3.25 (db), and the
equilibrium moisture content, Xeq, was 0.17 (db).
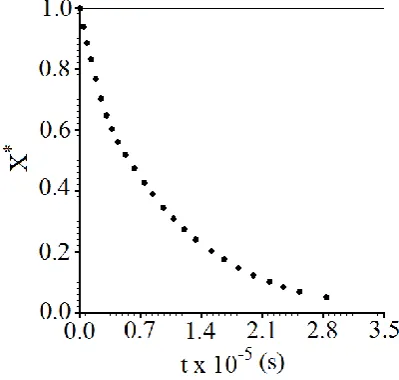
[image:3.595.196.396.375.565.2]The dimensionless moisture content data, X*, were digitized by using xyExtract Digitizer (http://zeus.df.ufcg.edu.br/labfit/index_xyExtract.htm) and they are presented through Fig. 1.
Figure 1. Experimental dataset of seedless grape drying.
2.2 Mathematical Models
Hawlader, 2005; Mariani et al., 2008), and normally an empirical model is used to determine this rate. In this context, in order to describe the drying kinetics of seedless grapes using empirical equations, the following assumptions were established:
1) The number of parameters of each model should be only one or two;
2) A mathematical expression for the drying rate as a function of the time should be obtained from each model;
3) A mathematical expression for the drying time as a function of the moisture content must be obtained from each model.
From the first assumption, the moisture content X at time t should be given by an expression of the type:
) , , ( )
(X X f t a b
X
X eq i eq (1)
in which f(t,a,b) is a function with one or two parameters (a and/or b), and this function
must satisfy all the established assumptions. On the other hand, Eq. (1) can be modified to express dimensionless moisture content at time t, as follows:
) , , ( * b a t f
X (2)
where eq i eq X X X X X * (3)
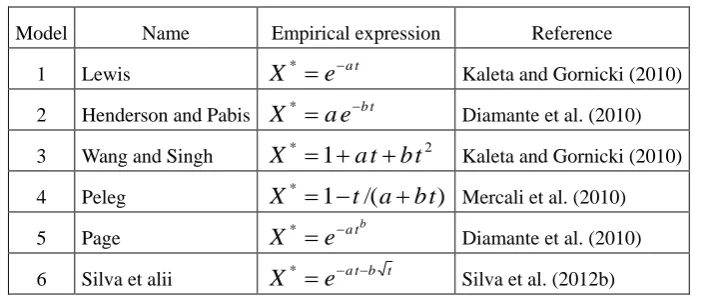
[image:4.595.123.474.551.699.2]The selected models are given in Table 1.
Table 1. Empirical models to describe drying kinetics.
Model Name Empirical expression Reference
1 Lewis X* eat Kaleta and Gornicki (2010)
2 Henderson and Pabis X* aebt Diamante et al. (2010)
3 Wang and Singh X* 1atbt2 Kaleta and Gornicki (2010)
4 Peleg X* 1t/(abt) Mercali et al. (2010)
5 Page
b t a
e
X* Diamante et al. (2010)
6 Silva et alii X* eatb t Silva et al. (2012b)
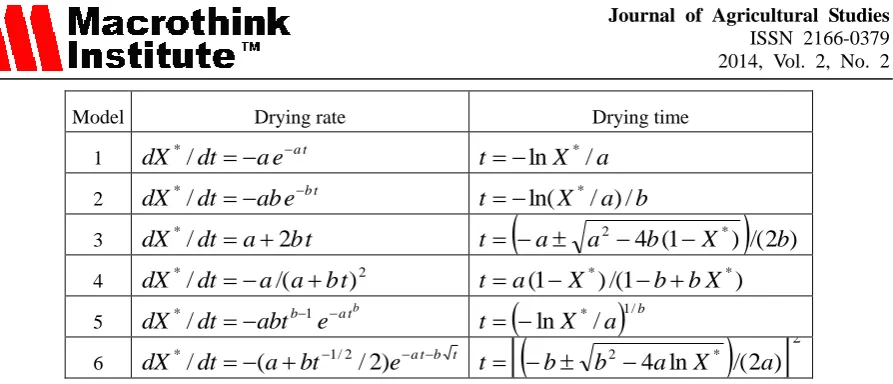
From Table 1, the mathematical expressions for the drying rate as a function of the time are expressed as is shown in Table 2.
Model Drying rate Drying time
1 dX*/dt aeat tlnX*/a
2 dX*/dt abebt tln(X*/a)/b
3 dX*/dt a2bt t
a a2 4b(1X*)
/(2b)4 dX*/dt a/(abt)2 t a(1X*)/(1bbX*)
5 b t a b e abt dt
dX*/ 1 t
lnX*/a
1/b6 dX*/dt (abt1/2/2)eatb t
2 ) 2 /( ln 4 * 2 a X a b b
t
This table also shows the expressions to determine the drying time for given dimensionless moisture content. Models were fitted to the experimental dataset, using nonlinear regression through LAB Fit Curve Fitting Software (Da Silva et al., 2004), and the results were evaluated through the statistical indicators chi-square and determination coefficient (Taylor, 1997).
3. Results and Discussion
It is worth mention that similar studies with other fruits have been investigated and published in the literature using empirical models (Ganesapillai et al., 2008; Diamante et al., 2010; Kaleta and Gornicki, 2010; Kumar et al., 2010; Mercali et al., 2010; Tunde-Akintunde and Ogunlakin, 2011). However, the main focus of these studies is only to describe the thin-layer drying kinetics. In the present article, attention is given to the determination of the drying rate, enabling the use of the obtained results to study the heat penetration and/or deep bed drying.
[image:5.595.78.525.41.233.2]The obtained results for selected models are presented in Table 3.
Table 3. Results for the drying kinetics described by empirical models.
Model a b χ2 R2
1 1.157x10⁻⁵ - 1.8898x10⁻² 0.99651
2 0.95315 1.0821x10⁻⁵ 9.7518x10⁻³ 0.99564 3 -8.7232x10⁻⁶ 2.0262x10⁻¹¹ 9.4024x10⁻² 0.97713 4 6.6096x10⁴ 0.81605 1.2335x10⁻³ 0.99944 5 5.4682x10⁻⁵ 0.86327 1.9501x10⁻³ 0.99910 6 8.7465x10⁻⁶ 7.8429x10⁻⁴ 2.5226x10⁻³ 0.99884
An inspection of the statistical indicators provided by Table 3 makes it possible to conclude that worse model is 3 (Wang and Singh). Models 1 (Lewis), 2 (Henderson and Pabis) and 6 (Silva et alli) are reasonable, but best ones were model 4 (Peleg), with a determination coefficient of 0.99944 and chi square of 1.2335 x 10⁻³; and model 5 (Page), with a determination coefficient of 0.99910 and chi square of 1.9501 x 10⁻³.
Figure 2. Description of the drying kinetics through model 4 (Peleg).
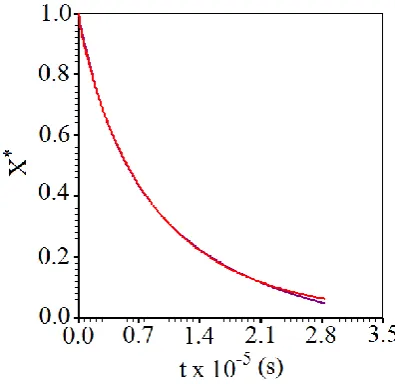
To observe the coherence between models 4 and 5 during the whole process, Fig. 3 shows the drying kinetics simulations using models 4 and 5, and it is possible to observe in this figure the compatibility between two models, with a little disagreement just at the final part of drying. Even so, Fig. 3 shows that it is difficult to distinguish between the curves generated from models 4 and 5, which means that the models can be considered equivalent.
Figure 3. Drying kinetics simulations using models 4 (Peleg) and 5 (Page).
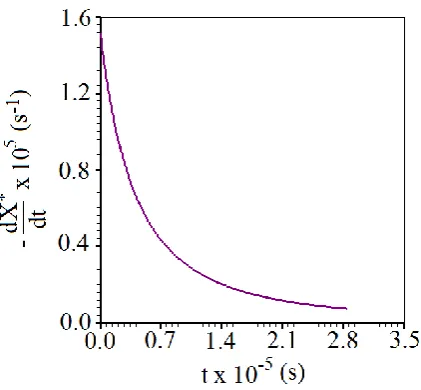
[image:6.595.196.394.411.603.2]Figure 4. Drying rate calculated using the expression obtained through the model 4.
This figure shows that the drying rate decreases during the whole process, and this behavior also occurs with several other agricultural products (Roberts et al., 2008; Diamante et al., 2010; Kaleta and Gornicki, 2010; Kumar et al., 2010; Mercali et al., 2010; Silva et al., 2012b).
4. Conclusion
The experimental dataset makes it possible to conclude that thin-layer drying of seedless grapes took place exclusively in the falling rate period. Among empirical models investigated in this study, the worst result was obtained with Wang and Singh. On the other hand, Lewis, Henderson and Pabis and also Silva et alli are reasonably models to describe the process. According to the statistical indicators, Peleg and Page models well describe the thin-layer drying kinetics of seedless grapes at low temperature. In addition, these two models enable to write mathematical expressions for the drying rate and the process time, and these expressions produce results that can be considered equivalent.
Acknowledgment
The first author thanks CNPq (Conselho Nacional de Desenvolvimento Científico e Tecnológico) for the support given to this research and for his research grant, Process Number 301697/2012-4.
References
Aregba AW, Sebastian P, & Nadeau JP. (2006). Stationary deep-bed drying: A comparative study between a logarithmic model and a non-equilibrium model. Journal of Food Engineering. 77(1), 27–40. http://dx.doi.org/10.1016/j.jfoodeng.2005.06.020
Dantas LA, Mata MERMC, & Duarte MEM. (2011). Dynamic software for simulation drying of seeds and grains corn (In Portuguese). Revista Brasileira de Produtos Agroindustriais, 13(3), 309-318. http://www.deag.ufcg.edu.br/rbpa/rev133/Art13311.pdf
CDPS. (2004). LAB Fit Curve Fitting: A software in Portuguese for treatment of experimental data. Revista Brasileira de Ensino de Física, 26(4), 419-427.
http://www.sbfisica.org.br/rbef/pdf/031102.pdf
Da Silva WP, Silva CMDPS, Farias VSO, Gomes JP. (2012a). Diffusion models to describe the drying process of peeled bananas: optimization and simulation. Drying Technology 30(2), 164-174. http://dx.doi.org/10.1080/07373937.2011.628554
Da Silva CMDPS, Silva WP, Farias VSO, Gomes JP. (2012b). Effective diffusivity and convective mass transfer coefficient during the drying of bananas. Engenharia Agrícola 32(2), 342-353. http://dx.doi.org/10.1590/S0100-69162012000200014
Da Silva, W. P., Farias, V. S. O., Neves, G. A., & Lima, A. G. B.. (2012c). Modeling of water transport in roof tiles by removal of moisture at isothermal conditions. Heat and Mass Transfer 48(5), 809-821. http://dx.doi.org/10.1007/s00231-011-0931-4
Diamante LM, Ihns R, Savage GP, & Vanhanen L. (2010). A new mathematical model for thin layer drying of fruits. International Journal of Food Science and Technology, 45(9), 1956-1962. http://dx.doi.org/10.1111/j.1365-2621.2010.02345.x
Di Matteo M, Cinquanta L, Galiero G, & Crescitelli S. (2000). Effect of a novel physical pretreatment process on the drying kinetics of seedless grapes. Journal of Food Engineering, 46(2), 83-89. http://dx.doi.org/10.1016/S0260-8774(00)00071-6
Doymaz I, Pala M. (2002). The effects of dipping pretreatments on air-drying rates of the seedless grapes. Journal of Food Engineering, 52(4), 413-417.
Doymaz I. (2006). Drying kinetics of black grapes treated with different solutions. Journal of Food Engineering, 76(2), 212-217. http://dx.doi.org/10.1016/S0260-8774(01)00133-9
Esmaiili M, Rezazadeh G, Sotudeh-Gharebagh R, & Tahmasebi A. (2007). Modeling of the Seedless Grape Drying Process using the Generalized Differential Quadrature Method.
Chemical Engineering and Technology. 30(2), 168-175. http://dx.doi.org/10.1002/ceat.200600151
Ganesapillai M, Regupathi I, & Murugesan T. (2008). An empirical model for the estimation of moisture ratio during microwave drying of plaster of Paris. Drying Technology 26(7), 963-978.
Kaleta A, Górnicki K. (2010). Evaluation of drying models of apple (var. McIntosh) dried in a convective dryer. International Journal of Food Science and Technology, 45(5), 891-898. http://dx.doi.org/10.1111/j.1365-2621.2010.02230.x
Karim MA, Hawlader MNA. (2005). Drying characteristics of banana: Theoretical modelling and experimental validation. Journal of Food Engineering, 70(1), 35-45. http://dx.doi.org/10.1016/j.jfoodeng.2004.09.010
Kumar R, Jain S, Garg MK. (2010). Drying behaviour of rapeseed under thin layer conditions.
Mabellini A, Ohaco E, Márquez C, Lozano JE, & De Michelis A. (2013). Calculation of the effective diffusion coefficients in drying of chemical and mechanical pretreated rosehip fruits (Rosa eglanteria L.) with selected mass transfer models. International Journal of Food Engineering, 9(4), 481-486. http://dx.doi.org/10.1515/ijfe-2012-0001
Malekjani N, Jafari SM, Rahmati MH, Zadeh EE, & Mirzaee H. (2013). Evaluation of thin-layer drying models and artificial neural networks for describing drying kinetics of canola seed in a heat pump assisted fluidized bed dryer. International Journal of Food Engineering 9(4), 375-384. http://dx.doi.org/10.1515/ijfe-2012-0136
Mariani VC, Lima AGB, Coelho LS. (2008). Apparent thermal diffusivity estimation of the banana during drying using inverse method. Journal of Food Engineering 85(4), 569-579. http://dx.doi.org/10.1016/j.jfoodeng.2007.08.018
Mercali GD, Tessaro IC, Norena CPZ, & Marczak LDF. (2010). Mass transfer kinetics during osmotic dehydration of bananas (Musa sapientum, shum.). International Journal of Food
Science and Technology, 45(11), 2281-2289.
http://dx.doi.org/10.1111/j.1365-2621.2010.02418.x
Pangavhane DR, Sawhney RL, & Sarsavadia PN. (1999). Effect of various dipping pretreatment on drying kinetics of Thompson seedless grapes. Journal of Food Engineering 39(2), 211-216. http://dx.doi.org/10.1016/S0260-8774(98)00168-X
Ramos I.N, Miranda JMR, Brandão TRS, Silva CLM. (2010). Estimation of water diffusivity parameters on grape dynamic drying. Journal of Food Engineering 97(4), 519-525.
Roberts JS, Kidd DR, Padilla-Zakour O. (2008). Drying kinetics of grape seeds. Journal of Food Engineering 89(4), 460-465. http://dx.doi.org/10.1016/j.jfoodeng.2008.05.030
Sahoo, N. R., Pal, U. S., Dasha, S. K., Khan, MD. K.. (2012) Drying kinetics and quality aspects during heat pump drying of onion (Allium cepa L.). International Journal of Food Studies, 1, 159-167. http://dx.doi.org/10.7455/ijfs/1.2.2012.a6
Silva WP, Silva CMDPS, Precker JW, Gomes JP, Nascimento PL, Silva LD. (2012a). Diffusion models for the description of seedless grape drying using analytical and numerical solutions.
Agricultural Sciences, 3(4), 545-556. http://dx.doi.org/10.4236/as.2012.34065
Silva WP, Silva CMDPS, Sousa JAR, & Farias VSO. (2012b). Empirical and diffusion models to describe water transport into chickpea (Cicer arietinum L.). International Journal of Food Science and Technology, 48(2), 267-273. http://dx.doi.org/10.1111/j.1365-2621.2012.03183.x
Silva WP, Silva CMDPS, Gama FJA, Gomes JP. (2013). Mathematical models to describe thin-layer drying and to determine drying rate of whole bananas. Journal of the Saudi Society of Agricultural Sciences, 13(1), 67-74. http://dx.doi.org/10.1016/j.jssas.2013.01.003
Taylor JR. (1997). An Introduction to Error Analysis. Second ed. University Science Books, Sausalito, California.
and untreated pumpkin. Journal of Food Science and Technology, 50(4), 705-713. http://dx.doi.org/10.1007/s13197-011-0392-2
Turhan M, Sayar S, Gunasekaran S. (2002). Application of Peleg model to study water absorption in chickpea during soaking. Journal of Food Engineering, 53(2), 153-159. http://dx.doi.org/10.1016/S0260-8774(01)00152-2
Copyright Disclaimer
Copyright reserved by the author(s).