This is the
Accepted Version
of a paper published in the
Journal Quaternary Science Reviews:
Williams, Alan N., Veth, Peter, Steffen, Will, Ulm, Sean, Turney, Chris S.M.,
Reeves, Jessica M., Phipps, Steven J., and Smith, Mike (2015)
A continental
narrative: human settlement patterns and Australian climate change over the
last 35,000 years.
Quaternary Science Reviews, 123. pp. 91-112.
http://dx.doi.org/10.1016/j.quascirev.2015.06.018
1
A Continental Narrative: Human Settlement Patterns and Australian Climate Change over the Last 35,000 Years
Alan N Williamsa,b, Peter Vethc, Will Steffena, Sean Ulmd, Chris SM Turneye, Jessica M Reevesf, Steven J
Phippse,g, Mike Smitha,h
a Fenner School of Environment and Society, The Australian National University, Canberra, ACT 0200,
Australia. Email: [email protected]
b Archaeological and Heritage Management Solutions Pty Ltd, 2/729 Elizabeth Road, Waterloo, NSW 2017,
Australia.
c School of Social Sciences, The University of Western Australia, Crawley, WA 6009, Australia.
d College of Arts, Society and Education, James Cook University, PO Box 6811, Cairns, QLD 4870,
Australia.
e Climate Change Research Centre and School of Biological, Earth and Environmental Sciences, The
University of New South Wales, NSW 2052, Australia.
f School of Applied and Biomedical Sciences, Federation University Australia, PO Box 663, Ballarat, VIC
3353, Australia.
g ARC Centre of Excellence for Climate System Science, The University of New South Wales, NSW 2052,
Australia.
2
Abstract
Drawing on the recent synthesis of Australian palaeoclimate by the OZ-INTIMATE group (Reeves et al. 2013a), we consider the effects of climate systems on past human settlement patterns and inferred demography. We use 5,044 radiocarbon dates from ~1,750 archaeological sites to develop regional time-series curves for different regions defined in the OZ-INTIMATE compilation as the temperate, tropics, interior and Southern Ocean sectors to explore human-climate relationships in Australia over the last 35,000 years. Correlations undertaken with improved palaeoclimatic data and archaeological records indicate that the regional time-series curves are robust, and can be used as a proxy for human behaviour. However, interrogation of the datasets is essential with artificial peaks and taphonomic over-correction being critical considerations. The time-series curves are interpreted as reflecting population growth, stasis and even decline in phase with terminal Pleistocene/early Holocene climatic fluctuations. This coupling, however, decreases during the last 5,000 years, most likely due to increased population levels, greater territoriality, technological solutions to stress, and social and ideational innovation. Curves from all sectors show exponential population growth over the last 5,000 years. We identify future research priorities, highlighting the paucity of archaeological records across several parts of Australia (<1 dated site/4,000km2), especially around the
fringes of the arid zone, and the need for improved taphonomic correction techniques. Finally, we discuss how these time-series curves represent a first-order framework, not dissimilar to global climate models, which researchers can continue to test and refine with local, regional and continental records.
Keywords
Time-series analysis, archaeological radiocarbon data, hunter-gatherer behaviour, Aus-INTIMATE, OZ-INTIMATE, human-environment interaction, palaeoenvironment
Highlights
Comparison of radiocarbon time-series techniques with other archaeological indices
We demonstrate robust relationship between radiocarbon data and demographic change
Our results suggest past demography was coupled with climate until mid-Holocene
Mid-Holocene social/technological innovation effected a de-coupling of relationship
3
1. Introduction
1.1. Archaeology and Palaeoclimate in Australia
The emergence of modern archaeological science in Australia over the last 60 years has resulted in robust regional archaeologies underpinned by hundreds of age determinations. To study human-environment interactions, there is a critical need for proximal palaeoclimatic data. Yet for many (bio)regions, there is a lack of high quality climate datasets. Consequently, archaeologists often assume stable teleconnections and use climate indices that may be hundreds or thousands of kilometres away, such as the use of South American lake records as a proxy for the expression of El Niño Southern Oscillation (ENSO) (Rodbell et al., 1999; Moy et al., 2002) in Australia (e.g. Turney and Hobbs, 2006). In some instances, the relative dearth of palaeoclimate data has meant that the behaviour of hunter-gatherers themselves has been used to inform climate change– for example, Williams et al. (2010) identified the Medieval Climatic Anomaly (MCA) solely through changes in archaeological data; it was several years later that sufficient palaeoclimatic work was undertaken to confirm and characterise the MCA in Australia (Colhoun and Shimeld, 2012; PAGES 2k Consortium, 2013). In a review of the human-megafauna debate, Bird et al. (2013) considered that there were insufficient records to determine how humans had modified vegetation over the last 50,000 years in northern Australia.
This lack of a continental perspective has not gone unnoticed and a number of syntheses have been attempted in the last few years (e.g. Mooney et al., 2011; Williams et al., 2015). This has culminated in a series of publications by Aus-INTIMATE that provide an agreement on the nature of palaeoclimates across Australasia over the last 35,000 years (Barrows et al., 2013; Bostock et al., 2013; Fitzsimmons et al., 2013; Petherick et al., 2013; Reeves et al., 2013a, 2013b).
1.2 Aus-INTIMATE and OZ-INTIMATE
The Aus-INTIMATE (Australasian INTegration of Ice core, MArine and TErrestial records) project is the culmination of 10 years of research (Barrows et al., 2013). It represents the Australian and New Zealand contribution to the larger INTIMATE project, a programme developed in 1995 at the XIVth INQUA Congress (Berlin) to develop more detailed knowledge of regional and global climatic change through the Last Glacial Maximum (LGM). While various Australasian palaeoclimatic syntheses have been attempted since the 1980s (most notably CLIMAP and CLIMANZ), Aus-INTIMATE, which formed in 2003 at the XVIth INQUA Congress (Reno), arguably reflects the largest participation of Australasian palaeoclimatic researchers (~70), and most significant outcomes to date in the form of a special issue of Quaternary Science Reviews. The Australian aspect of the project (OZ-INTIMATE) provides the first regional and continental-scale climate syntheses for the Australian region through the last 35,000 years that have broad agreement from the wider Australian palaeoclimatic community (Turney et al., 2006; Barrows et al., 2013; Reeves et al., 2013a). Until these works, there has been little consensus on the spatial and temporal nature of past changes in Australia’s climate, as well as a lack of information entirely in some areas.
Given the acknowledged complexity of the Australian climate, and the large number of palaeoclimatic researchers involved, the project divided the continent into a series of sectors, each managed by a primary researcher. The Australian region was considered to span from 10oN to 60oS and 110oE to 160oE to
encompass the entire Sahul shelf, much of the Sunda shelf and the Australian section of the Southern Ocean, as these regions have direct influence on the climate of the Australian continent (Reeves et al., 2013a). This region was then divided into the Tropical region (north of 20oS) (Reeves et al., 2013b), the Southern Ocean
region (south of 40oS) (Bostock et al., 2013), the Arid Interior, arbitrarily defined as 20o to ~33oS and 110o to
145oE, to broadly reflect the extent of the modern arid zone (Fitzsimmons et al., 2013) and the remaining
4
1.3 Radiocarbon Data as a Proxy
Despite the data limitations outlined in Section 1.1, archaeologists regularly correlate past human activities with climate events, using a range of indices such as artefact discard rates (Attenbrow et al., 2009), the emergence of new stone artefact technologies (Veth et al., 2011), changes in midden composition and frequency (Beaton, 1983; Nunn et al., 2007), sedimentation rates (Smith and Ross, 2008), ethnographic records (Keen, 2004), and changes in rock art phases (McDonald, 2008). One of the most recent and effective techniques for such correlations is the use of radiocarbon data as a proxy for human activity, generally in the form of sum probability or time-series analyses. The approach was first explored in the 1980s (Rick, 1987), but has grown exponentially in recent years as the number of radiocarbon determinations increase and access to radiocarbon calibration programs (such as Oxcal or CALIB) has become readily available (e.g. Gamble et al., 2005; González-Sampériz et al., 2009; Peros et al., 2010; Smith et al., 2008).
In Australia, the first use of the technique was explored by Bird and Frankel (1991a, 1991b), Holdaway and Porch (1995) and Ulm and Hall (1996), but only in recent years has the approach become commonplace (e.g. Turney and Hobbs, 2006; Smith et al., 2008; Holdaway et al., 2008; Williams et al., 2008, 2010, 2013; Marwick, 2009; Williams, 2012, 2013). Through these analyses, a comprehensive database of archaeological radiocarbon dates is now available for Australia (Williams et al., 2014a). As with all new techniques, limitations of the ‘dates as data’ approach are evident (see Williams, 2012 for detailed critique) and have been systematically addressed (Section 4) (e.g. Surovell et al., 2009; Armit et al., 2012; Bamforth and Grund, 2012; Williams, 2012; Naudinot et al., 2014; Brown, 2015).
1.4 Aims
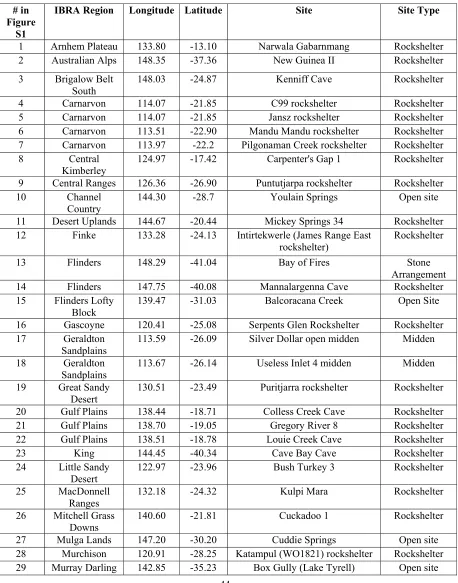
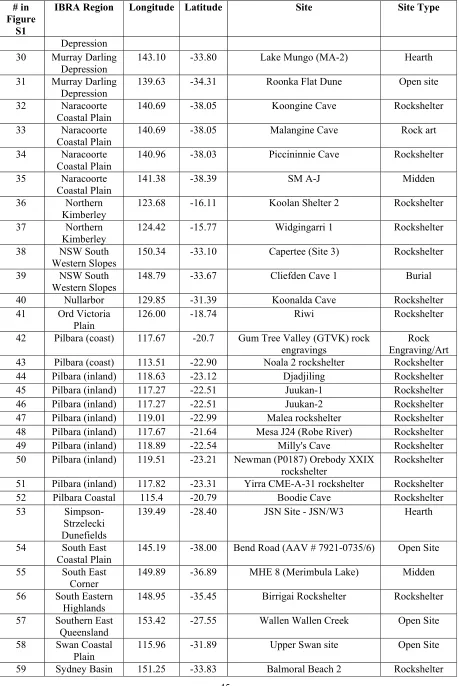
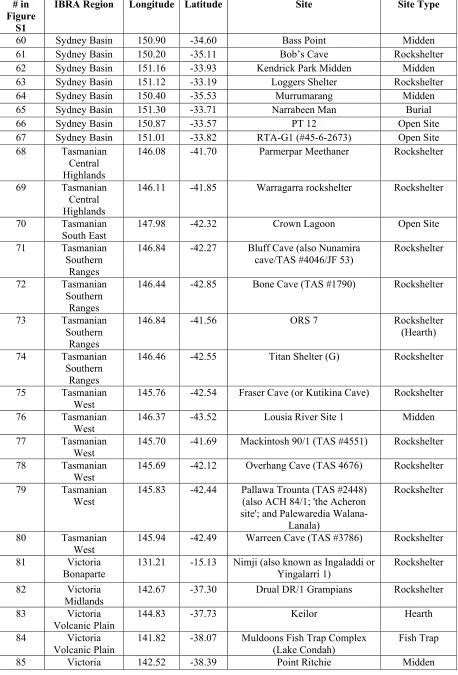
This paper uses the OZ-INTIMATE palaeoclimate synthesis in combination with a continental archaeological radiocarbon dataset from Australia to explore Aboriginal hunter-gatherer behaviour over the last 35,000 years. In addition to exploring this relationship, improvements in our understanding of past climate change in the Australian sector provide an opportunity to further evaluate the use and reliability of radiocarbon ‘dates as data’ approaches. We also contrast the approach with a wide review of other archaeological information and indices (e.g. artefact numbers, sedimentation rates, faunal remains, excavator’s interpretation, and stratigraphic changes) from over 90 sites across Australia to identify its robustness. Finally, we use the findings to identify future directions for Australian archaeological research.
2. The Modern Australian Climate System
The Australian continental landmass is vast, covering ~40° of longitude (113-153°E) and ~33° of latitude (11-44°S), and the modern climate system is understandably complex. Here, we present a brief overview of the major climate systems and features that have the most impact on rainfall and water availability (a key factor for past human activity) across the continent, to assist readers in understanding discussions in Section 6. We direct readers to Sturman and Tapper (1996), Risbey et al. (2009) and CSIRO (2015) for more detailed review; the following information has been summarised from these studies.
5
In winter, the ITCZ moves north, and rainfall comes primarily from the westerlies. While the westerlies usually track south of the continent, their storm fronts extend north and provide significant rainfall to the southern fringes. This is especially the case in southeastern Australia, where these fronts are often turned northwards or even back onto themselves by a blocking high pressure system that is frequently situated within the Tasman Sea. Similarly, such rainfall is then re-distributed indirectly to the interior through major river systems, such as the Murray-Darling and Murrumbidgee Rivers.
In addition to these regular climate systems, a number of longer quasi-cyclical phenomena (often known as patterns of interannual variability) also influence the extent and distribution of rainfall across Australia. The best known of these is the El Niño Southern Oscillation (ENSO), a feature of natural climate variability which originates from the strong interaction between tropical atmosphere and the Pacific Ocean. ENSO has a significant impact on the intensity of the monsoons and results, on inter-annual timeframes, in (i) increased aridity (El Niño), primarily across eastern and northern Australia (~135-153°E) or (ii) increased rainfall (La Niña), primarily across northern, central and eastern Australia. The Indian Ocean Dipole (IOD) is an inter-annual ENSO-like phenomenon in the equatorial Indian Ocean that results in increased rainfall over western, central and southern Australia (-IOD) or aridity over most of the continent (+IOD). Recent research has shown that ENSO and IOD can occur concurrently and reinforce their respective climatic states (i.e. La Niña/-IOD sees significant rainfall over much of the continent, especially the eastern fringe, while El Niño/+IOD results in strong aridity in the same areas).
The Southern Annular Mode (SAM) represents changes in the location of the Southern Hemisphere mid-latitude westerly winds, which influences the climate along the southern fringe of the continent. The positive phase of the SAM results in the westerlies shifting pole-ward, and a reduction in rainfall to the Australian mainland. Conversely, negative SAM sees the westerlies moving equator-ward, and results in rainfall across the southern portions of Australia, and as far north as ~25°S. It should be noted that, with the possible exception of ENSO, our understanding of these climate states, especially in the past, is still fairly limited.
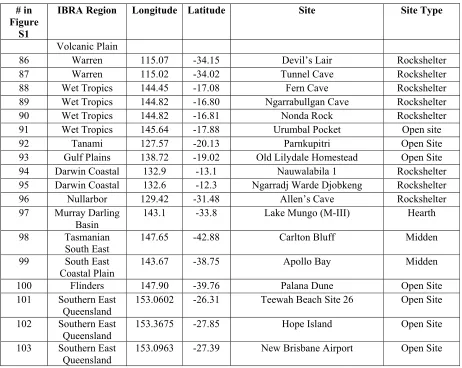
These climatic systems have resulted in a continent that is dominated by savanna, semi-arid and desert landscapes (~65%), which are characterised by inconsistent and episodic rainfall (Figure 1). These areas expand and contract depending on seasons and the climatic states which dominate, leaving a wide band of savanna or grassland environments between the arid core and outlining temperate or tropical regions. The remaining parts of Australia can be characterised as a tropical region in the north, with regular summer monsoons and cyclones; and a temperate southern and eastern fringe, which receives regular winter rainfall to varying extents from the westerly storm fronts.
6
[image:7.612.91.522.49.492.2]
Figure 1. Map of the main climatic classifications and systems influencing the modern, and probably Holocene, Australian landmass (after Sturman and Tapper 1996; Risbey et al. 2009; CSIRO 2015). The width of major rivers has been exaggerated for visibility.
3. The Continental Record
7
Archaeologically, we use the most comprehensive radiocarbon dataset for the Australian continent (Williams et al., 2014a), comprising 5,044 radiocarbon dates from ~1,750 archaeological sites (Figure 2). Here we combine the records to explore changing human-climate interactions in Australia at broad regional scales over the last 35,000 years. Of the 5,044 dates, 4,576 are used in this analysis: 468 are excluded as they lack full information or are regarded as anomalous by their authors (see Williams et al., 2014a for discussion). The dataset encompass the entire continent and all four sectors as defined by the OZ-INTIMATE works: tropics (mainland Australia only and near-shore islands) (n=1,269, ΔT1=125), temperate (n=2,261, ΔT=163),
interior (n=782, ΔT=124) and Southern Ocean (n=264, ΔT=252). This division per sector conforms to the minimum number requirements for analysis (n=500) as defined in Williams (2012) with the exception of the Southern Ocean. The Southern Ocean sector only encompasses a small number of excavations in Tasmania (which is also considered to fall within the temperate sector by OZ-INTIMATE), and for this reason results from this sector must be considered as preliminary. The continental data come from a range of archaeological site types, including rockshelters, open sites, middens, fish traps, and burials, and includes both terrestrial and marine samples. As a result the radiocarbon dataset provides a strong representation of the spatial and temporal range of activities of hunter-gatherers across Australia. More dates come from the Holocene (n=3,657), thought to be due both to lower population numbers prior to 12ka (Williams, 2013) and loss of older archaeological deposits (cf. Ulm, 2013); this is discussed further in Section 4.
4. Assumptions and Limitations
Time-series analyses of radiocarbon data have been widely used both as proxies for human activity and prehistoric population (Surovell et al., 2009; Williams et al., 2010; Armit et al., 2012; Williams, 2012, 2013; Shennan et al., 2013; Naudinot et al., 2014; Brown, 2015). Analysis and interpretation of this form of data is complex and has several limitations (Williams, 2012). In Australia the three main cautions raised with the technique include: 1) how detrital charcoal in archaeological sites (i.e. samples not recovered from features directly attributable to anthropogenic origins such as hearths, burials, etc) relates to past behaviours; 2) whether the radiocarbon data directly reflect demographic change, or other processes such as changing behaviour in hunter-gatherer societies (i.e. more dates equals greater mobility, rather than more people); and 3) the extent to which the radiocarbon data are simply an artefact of sampling protocols. Recent work by Williams (2012, 2013) has explicitly addressed these issues, and demonstrated that detrital charcoal correlates well with other radiocarbon data directly attributable to human activity within archaeological sites. Similarly radiocarbon data correlate well with other archaeological indices (such as artefact discard rates), thereby providing greater confidence they reflect demographic change (cf. Naudinot et al. 2014). Here, we assume that the data can be attributed to demographic change, but we further evaluate this proposition in subsequent sections of the paper (Section 7.1). Regardless of the above, large sample sizes (n=>500) appear to override issues relating to sampling methods (Williams 2012).
It should be noted that this paper deals only with the modern landmass of Australia and Tasmania. Prehistoric Sahul, of course, also included the island of New Guinea and the extensive, now flooded, continental shelfs between Australia and New Guinea and land-bridge to Tasmania. A working assumption of this paper is that these will have separate demographic histories.
1ΔT – average of radiocarbon laboratory errors for the dataset used. This value is critical in determining minimum
8
Figure 2. Location of Australian archaeological radiocarbon data (black dots) used in this analysis (Williams et al. 2014a). The data were divided into four sectors after Reeves et al. (2013a): tropics, interior, temperate, and Southern Ocean.
There remain, however, limitations in the spread and distribution of the data available for the Australian continent (Williams et al., 2014a). Currently, there are ~1,750 documented archaeological sites, which equates to fewer than 1 site per 4,000km2 on average, with a range of between ~1/100km2 in areas of greater
research (such as the southeast) to ~1/10,000km2 in less intensively investigated regions. The loss of
archaeological data through sea-level inundation of the continental shelves, especially in the late Pleistocene, also contributes to data availability. While the results produced here appear robust, and correlate well with other archaeological evidence, the influence of these broad sampling biases is unknown.
[image:9.612.121.488.49.409.2]9
5. Methods
The methods employed here have been extensively used (e.g. Smith et al., 2008; Williams et al., 2008; Surovell et al., 2009; Peros et al., 2010) and tested (Williams, 2012, 2013) in a range of studies, with specific reference to time-series analysis, calibration effects and taphonomic correction. For further information on the merits and limitations of the methods, we direct readers to these publications.
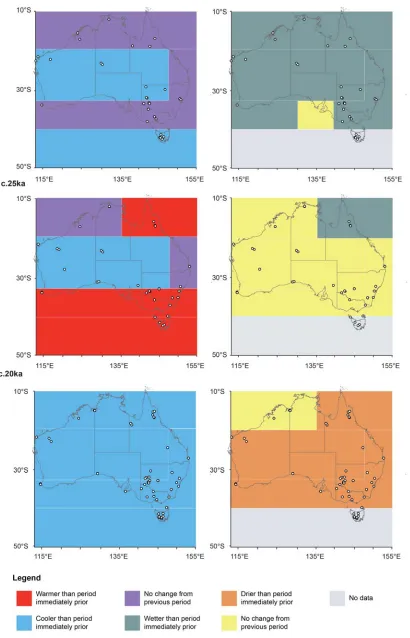
Comparison of the archaeological data with the palaeoclimatic record was undertaken both temporally (Figures 3 and 4) and spatially (Figure 5). To develop the archaeological time-series curves in Figures 3 and 4, the archaeological radiocarbon ages – consisting of determinations on charcoal, marine and other materials - was first calibrated into calendar years using OxCal (version 4.1) (Bronk Ramsey 2009). Terrestrial dates were calibrated using INTCAL13 and marine dates using MARINE13 (Reimer et al., 2013) with ΔR values after Ulm (2006). OxCal was used to both obtain a median value for each radiocarbon date (95.4% confidence) and to create sum probabilities. To remove some of the calibration anomalies and allow subsequent analysis, each calibrated date was then ‘data binned’ into 200-year intervals based on its median value. Taphonomic correction procedures were also undertaken. In this study, correction for taphonomic loss followed procedures in Williams (2012, 2013), which involves correction of the actual number of dates per 200-year bin using a decay curve created from a volcanic radiocarbon dataset (see Surovell et al., 2009 for details). The correction equation is:
nc = na/(2.107 x 107(t +2754)-1.526) (1)
where nc = taphonomically corrected number of radiocarbon dates for the dataset of interest, and na is the actual number of radiocarbon dates present at a specific time (t). Williams (2013) ran a series of tests using the same dataset, which indicated that while it was necessary to correct open site data, those from rockshelters were best used without such corrections, which tend to artificially flatten trends (by over-inflation of earlier time periods, leading to an overall flatter curve throughout the last 35,000 years). Conversely, Ulm (2013) considered that rockshelter deposits may be prone to taphonomic impacts owing to their restricted area and often intense periods of use (see also Walthall, 1998). We therefore present both the final time-series curve with all data corrected, as well as the more widely accepted combination of corrected open site data and uncorrected data from rockshelters. Both of these approaches provide largely comparable results.
For the spatial analysis in Figure 5, all archaeological dates were calibrated, and then those within each 2,000 year period centred on the time slice (as defined by Reeves et al., 2013a) were plotted. This broad temporal window across each time slice accounts for calibration effects and allows sufficient data per time slice to provide robust results.
10
11
12
13
14
[image:15.612.104.514.66.704.2]
15
[image:16.612.102.513.63.682.2]16
[image:17.612.99.516.60.489.2]
17
6. Synthesis 6.1 Tropics
Between 35-20ka, the tropics see increasingly cool and more arid conditions with sparse archaeological evidence of human activity (Figures 3a, 4a and 5). The archaeological record for the tropics is dominated by sandstone and limestone rockshelters in the Kimberley, Ord Victoria Plain, Arnhem Land Plateau and Wet Tropics and due to the low proportion of open sites, taphonomic correction methods are largely ineffective. Large areas of the Gulf of Carpentaria, Cape York Peninsula and Northern Territory savannah are not represented in the archaeological dataset owing to a lack of research in these zones. Elevated values are observed through the late Pleistocene when correcting both open and closed site data, but systematic error is evident before ~25ka making any interpretations for this period dubious. For this reason, we have not considered the taphonomic correction data in the tropics until the terminal Pleistocene (<15ka).
Despite generally increasing aridity, cooler and cooling conditions, the data are spatially widespread and indicate maintenance of widespread human populations across the top end of the continent prior to, or during, the 35-20ka period, with evidence of use of the margins of the Great Sandy Desert (Carpenter’s Gap 1 and Riwi rockshelters (Balme, 2000; O’Connor, 1995)); the southern fringes of Arnhem Plateau (Narwala Gabarnmang rockshelter (David et al., 2011)); the limestone gorges of the Gulf Upland Plains (Colless Creek Cave and Gregory River 8 rockshelters (Hiscock, 1988; Slack, 2007)); and across the Wet Tropics (Ngarrabullagan and Nonda Rock rockshelters (David and Wilson, 1999; David et al., 2007)) (Figure 5). Williams (2013) has suggested that populations were too low at this time to have formed extensive regional populations, and these sites are likely to reflect low numbers of highly mobile groups – a necklace of marine (Conus sp.) shell beads found in 34ka deposits at the inland site of Riwi suggests movement of over 300km (from the current coastline, and likely further with sea-level change) was not uncommon (Balme, 2000). Ethnographically these types of distances have been observed (Gould, 1977). The repeated visitation of many of these sites, however, may indicate that small groups were constrained to defined areas, and were not necessarily free-roaming (Smith, 2013).
A peak in the data at 22-23ka primarily reflects multiple dating of the same deposits at Nonda Rock by David et al. (2007), and shows one of the limitations of the technique (see Section 7.1 for discussion). The time-series shows little change through the Last Glacial Maximum (LGM) (~21-18ka) (Figures 3a and 4a), though site numbers for this period are low. These sites are mostly focussed on the margins of the continent, within proposed refugia, such as the limestone gorges of the Kimberley, Gulf Upland Plains and Einsleigh Uplands (Hiscock, 1988; Veth, 1993; Williams et al., 2013) (Figure 5). Frequently, sites appear to have been effectively abandoned during this period, and not re-occupied until the Pleistocene/Holocene transition (~11ka), such as at Koolan 2 and Widgingarri 2 rockshelters (O’Connor, 1989, 1999; Ward, 2003). Where present, archaeological records indicate a reduction in population size, along with changes in mobility patterns usually towards a smaller and circumscribed range than previously or subsequently observed, with a focus on key resources (e.g. reliable water, raw materials for stone tool production, and large game). For example, at Colless Creek Cave and Louie Creek in the Gulf Plains gorges, data indicates that small groups of people were tethered to the riparian gorge system focussing on local food and stone resources, and abandoning the surrounding plains within which previously used resources were less than 30km away (Hiscock, 1988). A shift from exotic quartzite (11km away) to nearby chert stone materials is evident at Fern Cave in the Chillagoe region of Einasleigh Uplands, and similarly suggests contraction of foraging areas (David, 1991; Lamb, 1996).
18
as Mickey Springs 34 (Desert Uplands) show increasing stone artefact production rates from 8ka (Morwood, 1990); Urumbal Pocket (Wet Tropics) is first occupied in tandem with rainforest establishment (Cosgrove et al., 2007); and sites in the Chillagoe region become occupied (David, 2002). Rising sea-level also played a role, with a large number of data coming from the establishment or re-occupation of coastal sites in Wet Tropics, Darwin Coastal, Arnhem Plateau, and Cape York Peninsula (Figure 5). However, we do not detect expected packing of populations as the last marine transgression flooded the extensive Sahul continental shelf (Lambeck and Chappell, 2001). While marine resources were being exploited by 10ka, as shown at Koolan 2 rockshelter, most sites date to <7ka following the establishment of mangrove systems proximal to the modern coastline (Woodroffe et al., 1985) - a highly productive resource associated with thick midden deposits in the upper parts of many sites through the mid-Holocene (e.g. Nauwalabila 1 and Ngarradj Warde Djobkeng (Schrire, 1982; Jones and Negerevich, 1985; Bird et al., 2002)). The general absence of data in the Kimberley region, however, does not lend support to large-scale migration of populations from the flooding continental shelf – a likely productive area of ~1 million km2 - through this period, as is often suggested
(Smith, 2013; Williams, 2013). The region remains generally under-studied and this picture may change with future research.
The last 6,000 years exhibit increasing population growth in the time-series records, despite the onset of highly variable climatic conditions, including the gradual intensification of ENSO (Moy et al., 2002). Of the 1,269 dates recorded in this region, 980 (77%) occur within the last 5ka (even taphonomically corrected, it remains ~25% of all data). Based on the data, exploitation of coastal resources intensified with the vast majority of occupation still occurring along the northern and eastern coastlines, the Gulf of Carpentaria and Torres Strait, and being primarily comprised of shell mounds or middens (Ulm, 2011). Of the 980 dates representing the last 5ka, 520 (53%) were from these types of site, with many of the remaining dates coming from midden strata within the top of rockshelter sites. Brockwell et al. (2009) demonstrated that a proliferation of shell mound building occurred between ~4ka to 0.5ka as sedimentation filled in coastal embayments and propagated shellfish species; while the re-establishment of occupation on previously abandoned off-shore islands, such as the Sir Edward Pellew and Wellesley Groups, also occurred (Sim and Wallis, 2008; Rosendahl et al., 2014). While coastal exploitation in the north and east Tropics provided a reliable dietary foundation through periods of climatic variability, McGowan et al. (2012) suggested that significant drought occurred at ~6ka and ~2.5-1.5ka in the northwest. This may have prompted shifts in rock art repertoires, including the establishment of the Wandjina motifs associated with rain-making activities. Other archaeological sites also suggest limited occupation, such as Nimji rockshelter (Victoria Bonaparte) where after a period marked by an increase in artefacts between ~4-3ka, a significant collapse occurred immediately after 3ka (Cundy, 1990).
19
6.2 Interior
The interior encompasses much of the arid region of Australia (Figures 1 and 2). During Marine Isotope Stage (MIS) 3 (~60-25ka) (Figures 3b and 4b), climate conditions were highly variable (Fitzsimmons et al., 2013). The predominantly cool and arid conditions were punctuated by periods of increased moisture, activating mega-lakes across large parts of the interior (Bowler, 1998; Miller et al., 2005). Mega-lakes were particularly common prior to 48ka, after which most records suggest they entered a sustained drying phase that culminated in contemporary playa conditions with limited input from river systems (Cohen et al., 2015). In parallel to these changes, hunter-gatherers had spread across all parts of the interior by 35ka (Figure 5), with archaeological sites documented in the Pilbara (Juukan-1 and Djadjiling rockshelter) (Slack et al., 2009; Law et al., 2010), Great Sandy Desert (Puritjarra rockshelter, Parnkupirti) (Smith, 2006, 2013; Veth et al., 2009), MacDonnell Ranges (Kulpi Mara rockshelter) (Thorley, 1998), Nullarbor (Koonalda Cave) (Wright, 1971), Carnarvon/Geraldton Sand Plains (Mandu Mandu, C99 and Jansz rockshelters) (Morse, 1993; Przywolnik, 2005) and the Swan Coastal Plain (Upper Swan Site) (Pearce and Barbetti, 1981).
Occupation prior to the LGM (~35-23ka) was generally sparse, e.g. 22 artefacts recovered from the lower unit (2d) of Puritjarra rockshelter (compared with 12,677 from the Holocene deposits) (Smith, 2006); 50 artefacts and a handful of bone and marine shell from the base of Mandu Mandu rockshelter (Morse, 1993); and a single artefact from basal spits in Juukan-1 rockshelter (Slack et al., 2009). Smith (2013) suggests that these groups were highly mobile, travelling >200km annually, evident through the lack of retouched, resharpened or recycled flaked stone, and absence of any corporate relationship (site ownership) with the sites in question. However, many of these sites show repeated use over time (usually through stratigraphically discrete artefact layers evident) perhaps reflecting the fact that people ranged over circumscribed areas. McDonald and Veth (2013) have also proposed a multi-phase rock art model which sees regional repertoires emerging during this period after a phase of only light Pleistocene occupation. Our results support this pattern with numerous sites first used during MIS 3 and the early glacial, but does not provide support for earlier arguments (O'Connor et al. 1993) that late Pleistocene populations were as high as those in the mid-Holocene at a continent scale. O'Conner et al. (1993) was, however, focussed on the Kimberley, were our radiocarbon dataset is weak, and localised populations during this period may have been higher than the rest of the continent. The Pilbara, for example, has a large number of sites along a 300km stretch of the Hamersley Plateau and all appear during this time in addition to those listed above, including Malea rockshelter (Edwards and Murphy, 2003), Mesa J24 rockshelter (Hughes and Quartermaine, 1992), Newman (P0187) Orebody XXIX rockshelter (Maynard, 1980; Smith, 2013), Juukan-2 (Slack et al., 2009), Yirra CME-A-31 rockshelter (Veitch et al., 2005), and Milly’s Cave (Marwick, 2002). Along the western coast where marine resources would have persisted throughout the terminal Pleistocene (Manne and Veth, in press), additional sites were established. These included Silver Dollar midden (Bowdler 1999), Pilgonaman Creek rockshelter (Morse 1993), and Boodie Cave (Veth et al. 2014) and Noala 2 rockshelter (Veth 1995) further north on Barrow and Montebello Islands.
20
abandonment of Serpent’s Glen rockshelter (Gascoyne), which has a sterile layer (a priori hiatus in occupation) between ~28 and 5ka illustrates the interpretive difficulties, as our data suggest the desert was otherwise occupied by 5ka. Despite this, many of the sites in the Carnarvon bioregion have hiatuses between ~20-13ka (O’Connor et al., 1998; Smith, 2013).
Warmer and wetter conditions during the deglacial period (~19-14ka) (Fitzsimmons et al., 2013) are seen to have resulted in populations rebounding (Figures 3b and 4b). Our results suggest population increased slightly preceding climatic change, but both archaeological and climatic data are still relatively sparse through this period. Along with activity at sites in the Pilbara, Great Sandy Desert and MacDonnell Ranges, visitation of the semi-arid regions along the eastern fringe of the interior also occurs, e.g. a series of hearths identified as the JSN site (Simpson-Strzelecki Dunefields) (Smith et al., 1991), Youlain Springs open site (Channel Country) (Robins, 1998), Balcoracana Creek open site (Flinders Lofty Block) (Gardner et al., 1987), Cuckadoo 1 rockshelter (Mitchell Grass Downs) (Davidson et al., 1993) and the ‘hard lands’ west of Lake Torrens (Hughes et al., 2014) (Figure 5). This activity may suggest local expansion of populations from regional Pleistocene refugia into the margins of the desert interior as conditions became wetter and warmer and major river systems were re-activated through increasing monsoonal rain in the northern catchments (Wyrwoll and Miller, 2001). However, hunter-gatherer resurgence was short-lived, and the timing of onset of the Antarctic Cold Reversal (14-12ka) (ACR) again saw a reduction in populations, and likely contraction of settlement, or archaeologically undetectable visitation, of portions of the interior. These conditions remained unchanged until after 10ka. The ACR was, however, more prevalent in the south than north (Reeves et al., 2013a), and any causation here must be treated with caution.
From 10ka, populations appear to have increased and expanded across the interior (Figures 3b, 4b and 5). This growth initially began slowly, followed by a pulse of occupation, coeval with the Holocene climatic optimum (~8-6ka). Populations remained relatively stable until ~2ka, with only minor declines at ~7ka and 3ka. The early Holocene sees the widespread occupation of the interior, including much of the coast, semi-arid and desert core previously abandoned and/or only lightly occupied in the Pleistocene (Williams, 2013; Williams et al., in press) (Figure 5). Activity is now also evident in the Murchison (e.g. Katampul (WO1821) rockshelter) (O’Connor and Veth, 1996, 2006), Little Sandy Desert (e.g. Bush Turkey 3 rockshelter) (Veth et al., 2008), Finke (e.g. Intirtekwerle rockshelter) (Smith, 1986a), Central Ranges (Puntutjarpa rockshelter) (Gould, 1977), Desert Uplands (e.g. Mickey Springs 34) (Morwood, 1990) and Geraldton Sandplains (e.g. Useless Inlet 4 midden) (Przywolnik, 2005). Rockshelters such as Puntutjarpa and Allen’s Cave for example, both show dense organic-rich deposits, with numerous hearths, ash, charcoal, stone artefacts and bone material, all indicative of repeated and focussed use of these sites (Gould, 1977; McDonald and Veth, 2013; Smith, 2013). The spread of habitation sites and regional establishment across the interior coincides with the hypothesised spread of Pama-Nyungan languages and has been argued to indicate the beginnings of a more dense, territorial occupation, and socially connected people with new levels of corporate identity (McConvell, 1996; Smith, 2013).
21
Turkey 3 rockshelter in the Little Sandy Desert (spits 14-19) (Thorley, 1998; Smith, 2006; Veth et al., 2008). This period saw the introduction of numerous technological innovations, most likely resulting from a combination of demographic packing (in-filling of the landscape through population density increases) and long use-life implements such as the Tula adze during the early-to mid-Holocene, restricting residential mobility patterns employed previously in the Pleistocene. Some responses probably include greater use of thermoplastic resins for hafting composite, more elaborate (and possibly efficient) hunting toolkits, an increasingly diverse suite of wooden implements associated with logistical mobility, and a broadening of diet to accommodate lower calorific foods most evident through the proliferation of ground-stone assemblages for plant and seed processing (Veth, 1993; Veth et al., 2011, Smith, 1986b, 2013; Zeanah et al., 2015; cf. Gorecki et al., 1997).
The last 1,500 years shows increasing use and occupation of the interior, with 41% of the data occurring during this time (Figures 3b, 4b and 5). Whether corrected or uncorrected, the data indicate that this period saw significant population growth above anything previously observed in the past. Regional studies by Smith (1988), Smith and Ross (2008) and Veth (1993, 1996, 2006) also show that this trend is evident within archaeological records at local scales across the arid interior. While climate amelioration probably played a role, and especially increasing and intensified La Niña conditions at ~1.2ka (Williams et al., 2010; Veth et al., 2011; Goodwin et al., 2014), new organisational strategies and technological changes in the mid-to-late Holocene (6-2ka) may have facilitated stability in resource and food procurement. This behaviour may have contributed to sustainable populations in periods of higher stress for hunter-gatherers, and growth when resources were plentiful. Such strategies would also have allowed for longer occupation at key ecological and hydrological locales, and led to increased territorialism, most evident in the new levels of regionalisation of rock art (Ross, 2013).
6.3 Temperate
The overall dataset is dominated by values from the temperate region (~49%), which most likely reflects a historical focus of archaeological research in areas (such as the Murray-Darling Depression, Sydney Basin and Southeast Queensland) of a well-resourced environment able to sustain greater populations.
Amongst the earliest evidence for occupation of this region is currently the dating of a burial (M-III) at Lake Mungo to ~43ka (Bowler et al., 2003) in the southeast, and represents the earliest skeletal evidence for people on the continent. The lower deposits at Devil’s Lair date to ~>40ka, reflecting occupation of the southwest corner of the continent by this time (Turney et al., 2001; cf. Balme, 2014). A range of other sites contain basal ages >30ka when climatic conditions were cool, but wet, including Cuddie Springs open site (Mulga Lands) (Field et al., 2013), PT 12 (Williams et al., 2014b) and RTA-G1 open sites (McDonald, 2008) (Sydney Basin); Keilor river terraces (Victoria Volcanic Plain) (Gallus, 1976); and Point Ritchie midden (South East Coastal Plains) (Godfrey et al., 1996). Further north, dates prior to the LGM are scarce (Figure 5), with only the basal deposits of Wallen Wallen Creek open site (Neal and Stock, 1986) being relevant.
22
31ka (Gallus, 1976). Only the Willandra Lakes system2, and more recently dense artefact deposits at PT 12
show more intensive occupation (e.g. Balme and Hope, 1990; Webb et al., 2006; Smith et al., 2008; Williams et al., 2014b).
Between 30-20ka, with the initial onset of arid conditions noted in some of the temperate records (Petherick et al., 2013), we find a steady decline in human activity, before a significant peak at the height of the LGM (Figures 3c, 4c and 5). This peak is comprised almost exclusively of Murray-Darling Depression data (n=83/72%), reflecting Aboriginal populations focussed on the lake full conditions of the Willandra and Darling Lake systems (e.g. Balme and Hope, 1990; Webb et al., 2006). The Willandra lakes remained full during much of this period, as the catchment source in the Eastern Highlands continued to provide both rainfall and snowmelt (Fitzsimmons et al., in press), along with increased delivery of surface runoff by major river systems from the north and east, in combination with reduced evapo-transpiration (Reinfelds et al., 2013; Williams et al., 2013; Cohen et al., 2015). One explanation of this peak is that the Willandra and Darling Lake systems have good preservation of a Pleistocene landscape and have been a focus of research, and as such may represent an over-inflation of these data (contra Surovell et al.’s (2009) assumption of time-decay); removing the Murray-Darling Depression dataset and running the time-series curve provides a more common picture of declining populations through the LGM (see Williams 2013: Figure S13 and associated discussion). However, the high density of dates also probably represent a real response by hunter-gatherers falling back to well-watered littoral resources of the Willandra and Darling Lake systems during a period of general climatic deterioration across the temperate sector. Other areas surrounding the mountainous region of southeast Australia also register repeated occupations, including the Australian Alps (e.g. New Guinea II rockshelter) (Ossa et al., 1995), Victorian Midlands (e.g. Drual DR/1) (Bird et al., 1998), Southeastern Highlands (e.g. Birrigai rockshelter) (Flood, 1980), and Sydney Basin (e.g. PT 12) (Williams et al., 2014b) (Figure 5). Activity at Tunnel Cave and Devil’s Lair (Warren) is less easy to explain, with a lack of on-shore westerlies (a priori rainfall) at this time, but may reflect the persistence of groundwater in the large limestone karst systems in this region (Dortch 1996; Dortch and Dortch 1996).
Petherick et al. (2013) do not provide uniform detail of climate during the terminal Pleistocene (18-12ka), but reference to rapid ice melt in the Snowy Mountains suggests increased warming throughout the temperate sector. Generally, for hunter-gatherers, conditions would have been initially more challenging with increasing temperatures outpacing effective precipitation, and thereby initially increasing aridity (Markgraf et al., 1992; Kershaw and Nanson, 1993). Between 17.8-16.6ka (and possibly as late as 15ka – Fitzsimmons et al., 2014), even the Willandra and Darling lake systems had dried up both as a response to climate and possible neotectonic shifts (J. Magee, pers. comm.) impacting Willandra Creek, and only nine dates have been recorded (0.3%), indicating a population nadir for the sector. Similarly, during the ACR only 29 dates (1.2%) have been documented, the majority of which came from Murray-Darling Depression (n=6) and nearby Riverina (n=4), Warren (n=4), and Naracoorte Coastal Plain (n=3) - another limestone karst system (suggesting the persistence of subterranean freshwater). The intervening period sees re-occupation of previously utilised regions (Sydney Basin, Murray-Darling Depression, Victorian Midlands, Warren), as well as expansion into coastal regions (Naracoorte Coastal Plain, Esperance Plains, South Eastern Queensland) as sea-level rises, and Brigalow Belt South, containing the headwaters of part of the Murray-Darling river system (Figure 5).
Climatic amelioration and coastal inundation in the early Holocene correlates with widespread expansion and growth of populations (Figures 3c, 4c and 5), with all but four of the 26 bioregions in this sector registering new activity. 20% of the corrected temperate data occur between 12-6ka, which compares closely with the
2Archaeologically the Willandra Lakes system is perhaps better suited in the interior sector outlined in Section 6.2.
However the OZ-INTIMATE group situated the area within the temperate sector, due to the source waters of the system originating in the Great Dividing Range and hence more climatically linked with the eastern coast of Australia.
23
17% during the late Holocene and suggests that population growth remained constant. Our results indicate a diversification of resource exploitation, and the utilisation of previously unproductive areas - most evident through the establishment of a large number of seasonal middens (SM #A-J) and rockshelters (Koongine, Piccininnie, and Malangine) along the Naracoorte Coastal Plain as sea-level stabilises (Bird and Frankel, 1991a; Richards, 2012), and the occupation of regions such as the NSW Southwestern Slopes, in which Capertee 3 rockshelter (the type-site for the Capertian assemblage) was first occupied at ~8.1ka (Johnson, 1979). A burial at Cliefden Cave 1 is also dated to this period (Pardoe and Webb, 1986). The formation of the Muldoons Fish Trap complex at Lake Condah before ~6.6ka suggests the development of more complex procurement strategies associated with increasing, and perhaps more sedentary populations (McNiven et al., 2012; see also Williams et al., in press). 10-7ka was probably the wettest period in the post-glacial (Wilkins et al., 2013). A cemetery with several burials dated to ~10-7ka at Roonka Flat may also indicate permanent habitation and the emergence of more complex societies (Pate et al. 1998). Attenbrow (2004) in her study of Upper Mangrove Creek (a marginal lake hinterland), showed a change during this time, with the catchment beginning to include base camps for the first time to allow longer occupation and greater local exploitation; Loggers Shelter, one of the main sites was estimated to contain 51,600 artefacts between 10-8ka, and compared closely with 56,250 artefacts dating to the last 3,000 years (Attenbrow 2004: Table 6.13).
Relatively high numbers of dates continue through the mid-Holocene, although there is a tapering off at ~6-4ka, and this coincides with alternating periods of extreme wet and dry climate (Rodbell et al., 1999; Moy et al., 2002; Petherick et al., 2013). Loggers Shelter shows a decrease in estimated artefact numbers to <4,000/millennium during this period, the lowest in the Holocene epoch (Attenbrow, 2004). However, Williams et al. (2014b) identified a hiatus in occupation during the mid-Holocene at PT 12, an open site that had been continuously occupied for over 20,000 years up to this point. A wider study by Bird and Frankel (1991a) of Victorian archaeological records also found a general decline. We highlight, however, that the decline was relatively short-lived and appeared to be centred on the climate transition at 6ka, rather than following a shift towards increased aridity. Ulm and Hall (1996) note that 6ka marks the start of continuous increases in the estimated number of dated sites occupied, including sites on the coastal margin at Teewah Beach Site 26 (McNiven, 1991), Hope Island (Walters et al., 1987) and the New Brisbane Airport site (Hall and Lilley, 1987).
24
The last 2,000 years sees significant increases in archaeological data, containing 45% of all radiocarbon data recorded in this sector. Radiocarbon data are recorded in all bioregions along the eastern seaboard during this time, and contain a wide range of archaeological sites, although rockshelters and middens still dominate. As with other regions, the archaeological picture is indicative of increasing populations utilising and occupying a larger spatial footprint than during previous periods.
6.4 Southern Ocean
The southern sector contains some 264 radiocarbon dates, many of which were collected from a handful of key excavations in southwest and central Tasmania. As this sample is too small for time-series analysis (min=500), any interpretation must therefore be considered preliminary. The Southern Ocean sector of the OZ-INTIMATE composite was constrained to off-shore records, which showed the movement of marine currents and strong influence of the westerly wind system (Bostock et al., 2013). Terrestrial records from Tasmania, particularly on the West Coast, show a comparable influence of the westerlies through time (Fletcher and Thomas, 2010a; Petherick et al., 2013). Since the archaeological record of Tasmania is unique and quite different from the temperate sector, due in large part to the island’s separation from the mainland, we have included it here in the Southern Ocean sector. Further, we consider that the archaeological record is more likely responding to changes in the westerlies than other climatic systems more common to the temperate sector (see Section 2).
There are a limited number of dates throughout the late Pleistocene (Figures 3d, 4d and 5), suggesting small populations visited the region prior to the LGM, even though a land-bridge was in existence (Lambeck and Chappell, 2001). Several rockshelter sites show basal ages >30ka, including Warreen Cave (Allen, 1996a), Pallawa Trounta rockshelter (Stern and Allen, 1996), Parmerpar Meethaner rockshelter (Cosgrove, 1995), Bluff Cave (Cosgrove, 1996a), Bone Cave (Allen, 1996b) and ORS 7 rockshelter (Cosgrove, 1996b), but for the most part, the lower archaeological deposits at these sites are suggestive of more ephemeral and intermittent visitation by small bands of hunter-gatherers (for analyses of seasonality and mobility at Pleistocene-aged sites see Burch (2007), Cosgrove and Allen (2001), Cosgrove and Pike-Tay (2004), Ditchfield (2011), Garvey (2006, 2007, 2010, 2011), Gilligan (2007), Holdaway (2004), McNiven (1994), Pike-Tay and Cosgrove (2002), Pike-Tay et al. (2008)). The notable exception is Bluff Cave located on the Weld River, in which the lower unit (SU 3) contained some 12,000 stone artefacts, along with high concentrations of bird bone and charcoal (Cosgrove, 1996a). This stratigraphic unit extends over ~20,000 years of occupation (36-16ka), however, and may simply reflect ongoing use of the site over a long period, rather than necessarily large populations in the late Pleistocene.
25
Between 16-13ka, there is evidence of climatic amelioration concurrent with rising sea-levels that ultimately separated Tasmania from the mainland (Lambeck and Chappell, 2001), and replacement of glacial grasslands with thick, temperate forest (Cosgrove, 1995; Stern and Allen, 1996; Colhoun and Shimeld, 2012), although cooler conditions are evident during the ACR (Bostock et al., 2013). Figures 3d and 4d show only small numbers through this period, with only seven dates registered. This significant decline in dated occupation may reflect either widespread abandonment of the region, or perhaps more likely the reorganisation of regional land use (dominated by rockshelter site types) across the sector, combined with a lack of terminal Pleistocene open sites being discovered and excavated to date. In the archaeological site assemblages, there is some correlation of these trends, with several sites occupied through the LGM and showing a decline or abandonment through this period, including Mackintosh 90/1 rockshelter (Stern and Marshall, 1993), Mannalargenna Cave (Brown, 1993), Warreen Cave (Allen, 1996a) and Fraser (Kutikina) Cave (Kiernan et al., 1983). However, there are a handful of sites in which occupation is initiated, or persisted, including Parmerpar Meethaner and Pallawa Trounta rockshelter, which suggests that a more complicated settlement pattern may exist (Cosgrove, 1995; Stern and Allen, 1996). Further work through this temporal period is needed to resolve this disparity.
Despite climate information being sparse through the Southern Ocean sector in the OZ-INTIMATE publications during the Holocene (Bostock et al., 2013), there is other evidence of initially warmer and wetter conditions (e.g. Hopf et al., 2000; Anker et al., 2001; Fletcher and Thomas, 2007, 2010b). Archaeological records mirror these trends, specifically, following the ACR, there is a pulse in data that reaches its peak during the Holocene climatic optimum (~8-6ka) (Figure 5). This trend is dominated by a diversification of sites, most notably open sites adjacent to freshwater lagoons and middens, as the sea-level stabilises, e.g. Carlton Bluff midden, Apollo Bay midden and Palana Dune open site (Orchiston and Glenie, 1978; Bird and Frankel, 1991a; Attenbrow, 1999). All but one of the 79 dates from midden and open sites were recovered from Holocene deposits, while at the same time only 42 (23%) rockshelter dates were documented. The initial, albeit brief, visitation at ~10ka to Warragarra rockshelter near Mt Ossa suggests expansion and exploration into previously glaciated areas also occurred during this period (Allen and Porch, 1996; Barrows et al., 2002). For the most part, however, inland areas became less productive as rainforest was re-established (Hopf et al., 2000; Anker et al., 2001; Cosgrove, 1995; Stern and Allen, 1996; Colhoun and Shimeld, 2012; Williams et al., 2013), impacting mobility and hunting returns, and prompting re-settlement of coastal areas.
There appears to have been an initial decline between the early- to late Holocene relative to the terminal Pleistocene with a subdued resurgence in the last 2ka (Figures 3d and 4d). Climatic records all suggest increasing aridity and peak fire-conditions after ~4ka (Hopf et al., 2000; Anker et al., 2001; Fletcher and Thomas, 2007, 2010b; Moss et al., 2007; Fletcher et al., 2014), and strongly suggest ENSO intensification played a role. It must be acknowledged, however, that in tandem with ENSO, changes in Southern Annular Mode (SAM) at this time may have also had significant influence on Tasmanian climate. Archaeologically, there is some suggestion of reorganisation of settlement, with several sites abandoned during this period (e.g. Cave Bay Cave (Bowdler, 1984), Crown Lagoon open site (Lourandos, 1977)), and with a number of LGM refuges re-colonised (e.g. Parmerpar Meethaner rockshelter (Cosgrove, 1995), Mackintosh 90/1 rockshelter (Stern and Marshall, 1993)). Technology also appears to shift, with a change in raw materials from quartz to hornfels at Parmerpar Meethaner rockshelter, for example (Cosgrove, 1995).
26
press). Vanderwal and Horton’s (1984) comprehensive study of sites along Louisa River, for example, demonstrates a complex winter and summer economy exploiting shellfish, rock-resting seals, birds, wallabies and wombats, which was still expanding at 0.5ka. The only ritualistic site currently dated in this sector, a stone arrangement at the Bay of Fires (Jones cit. Stockton, 1981), is also dated to 0.7ka, and may reflect increasing corporate identity/territorialism.
7. Discussion
7.1 Evaluating the Time-Series Approach
In this paper, we explore the time-series trends against detailed palaeoclimatic records, and investigate archaeological records from a wide range of time periods and environmental contexts. For the most part, the two indices show highly comparable results, with dense archaeological deposits reflected as peaks in the time-series data, and evidence of abandonment or sterile deposits as gaps. This is particularly evident in the climatic aridity registered through the LGM and ACR, which resulted in a decline in both numbers of radiocarbon and evidence of human occupation/activity across most sectors. The exception is the Murray-Darling Basin, a known refuge (Veth, 1993; Smith, 2013; Williams et al., 2013), in which both datasets show a significant peak as would be predicted. Correlation between radiocarbon and archaeological evidence can similarly be observed in the early Holocene with a strong growing trend in the time-series correlating well with the increasing appearance of technological and social innovation at this time (e.g. McNiven et al., 2012; Ulm, 2013; Williams, 2013). There is even a noticeable correlation between the relatively modest increase in archaeological deposits in Tasmania during the late Holocene (in contrast to other sectors where strong growth occurs), and their respective radiocarbon peak (Figures 3d and 4d).
This first-attempted continental synthesis also serves to highlight a number of limitations with the technique, the most significant of which is methodological and concerns the artificial data peaks created by researchers focusing on a specific location or stratigraphic unit (Langley, 2009; Langley et al., 2011). Such an artificial trend is most evident in the Murray-Darling Basin, a known Pleistocene landscape, in which extensive dating of the LGM archaeological features has resulted in a large peak at ~21-19ka, which while corroborated by archaeological data is likely over-inflated, and in contrast to the more subdued archaeological record for much of the temperate sector. The converse – artificial gaps – may also apply (e.g. radiocarbon plateaus), but these are harder to identify, and we find no evidence of them in the data (perhaps due to the large size of the datasets applied). The application of the taphonomic correction factors also results in anomalous results, most notably the likely over-correction of data >25ka resulting in unrealistically large peaks in pre-LGM periods (see Williams, 2012 for further discussion). In these earlier parts of the record, we recommend that the trends, but not necessarily their magnitude, are used for interpretations. A more recent taphonomic approach developed by Shennan et al. (2013) explores deviations from a mean to reflect human change and may be a better option for late Pleistocene interpretations into the future. Taphonomic correction approaches remain to be developed and tested in Australian contexts (Section 7.3).
27
driving variability in settlement, mobility and demography at the regional level will always require unique appraisal.
7.2. Key Findings
This synthesis provides the current state of knowledge of archaeological data across Australia over the last 35,000 years. While having several aims, this paper is intended to provide the human narrative currently absent in the OZ-INTIMATE compilation of Australian palaeoclimate. We build on earlier work by Smith et al. (2008) and others to present a series of models of the timing and extent of changing hunter-gatherer behaviours across the Australian continent by which to compare local and regional archaeological and palaeoenvironmental records.
From a regional perspective, our results indicate that the temperate sector contained the majority of dates currently documented (~49%), reflecting both an archaeological research bias, but also likely real hunter-gatherer behaviour, with more highly ranked and abundant resources able to support larger populations than elsewhere. Typically, tropical regions would be expected to provide significant exploitable resources, and the low density of data in this region is almost certainly due to a lack of dedicated research, especially in the northwest and Gulf of Carpentaria regions (as well as a potential loss of data through sea-level inundation during MIS3 and the LGM). The interior sector shows limited records throughout the Pleistocene, with pulses of occupation (most notably in the terminal Pleistocene) and abandonment. Significant population growth in the interior sector is only registered in the Holocene. The southern sector can only provide a preliminary curve due to gaps in the data, and shows low activity throughout the last 35,000 years, with localised peaks through the LGM. Despite magnitudinal differences in the curves, all sectors show broadly similar changes through time. Of note is the growth in all sectors during the early Holocene, regardless of taphonomic correction procedures applied.
During the terminal Pleistocene, our results suggest that changes in regional occupation patterns and inferred population levels were directly linked with climatic change. The data show increasing populations as climate ameliorates (i.e. increased temperatures and rainfall), and the reverse with the onset of aridity. These fluctuations are evident in several time periods and across all sectors, including increasing number of data as a response to wetter and warmer conditions in the tropical sector at 14-12ka and 11-5ka, in the arid sector at 18-14ka and 9-4ka, and in the temperate sector at 35-30ka and 12-8ka. These positive trends decline with cooler, more arid conditions in the tropics sector at 28-14ka, in the arid sector at 30-18ka, 15-9ka, and 4-2ka, and in the temperate sector at 28-18ka (when excluding Murray-Darling Basin data). This pattern is strongly indicative of an ideal free distribution model (as derived from optimal foraging theory (Kennett et al. 2006)). The theorem notes that as climate ameliorates, populations expand and move into new resource areas (patches). Where patches contain dense, high-yielding, predation-resistant resources, longer residence time, more sedentary occupation and population growth will occur. As climate deteriorates, populations decline and/or abandon marginal patches for more reliable resources, the result of which is a decline in numbers and spatial spread of data. These behaviours would likely have resulted in an overall small continental population strongly constrained by climatic change, most evident in the peak and aftermath of the LGM in which a few refugia show intense occupation (e.g. Murray-Darling Basin, southwest Tasmania), while much of the rest of the continent has more patchy settlement or was largely abandoned.
28
suggest increasingly large, and perhaps semi-sedentary, populations, and are representative of a ‘golden-age’ for hunter-gatherers in Australia (see Williams et al., in press for discussion). Many of these technological innovations can be considered to reflect ‘low-level food production’ (Smith, 2001) - the early stages of domestication - which has recently been shown to develop in other parts of the world when a surplus of resources is available (see the ‘Broad Spectrum Revolution’ for further discussion) (Flannery, 1969; Price and Gebauer, 1995; Stiner, 2001).
Following the early-to-mid-Holocene period, the behavioural-climatic coupling begins to diverge in all sectors. Rather than a decline with the gradual onset of ENSO in the late Holocene (e.g. Rodbell et al., 1999; Moy et al., 2002), and subsequent variability during the last 2,000 years, data increases exponentially until European contact. One interpretation has been that mobility increased as a response to increased climate variability (Attenbrow, 2004). However the archaeological evidence instead shows a general proliferation of technological investment, increasing territorialism and regional differentiation, and greater use of marginal patches (David and Cole, 1990; David, 1991; McNiven, 1999; Cosgrove et al., 2007; Veth et al., 2011; Ross, 2013; Smith, 2013; Williams et al., in press). All of these behaviours are seen to be a response to demographic packing, which would have constrained mobility (but may have increased the cycling of people through sites) and resulted in broadening of the diet and greater control over resources (Bird and O’Connell, 2006; Chabot-Hanowell and Smith, 2013). We therefore propose that the population growth and technological innovation initiated in the early Holocene led to hunter-gatherers having the ability to sustain themselves during later climate variability, and break from a predominantly environmentally structured cycle (see Lourandos and David, 2002). As noted by David (2002), Veth (2006) and Smith (2013), a product of demographic packing and these shifting behaviours through time was the emergence of the social and religious systems observed at European contact.
7.3. Future Research
This synthesis has identified a number of gaps in our archaeological knowledge and potential directions for future research.
Targeted archaeological investigations at the local and regional levels need to be at the core of any future work. Of the 89 bioregions dividing the continent, 64 of them contain fewer than 50 radiocarbon dates, and several (n=12) have no chronological information at all (Williams et al., 2014a). Currently, there are ~1,750 archaeological sites documented, which equates to less than 1 site per 4,000km2. Even in areas where
archaeological research has been intensive and multi-decadal, the data demonstrate that only one dated site per ~100km2 has been recorded; areas of lesser focus may have only 1 site per 10,000km2. This does not take
into account the extensive grey literature, however, with the possible exception of the Pilbara region where cultural resource management has been prolific in recent years, it is unlikely to alter these statistics significantly.
There are several areas where such investigation is desirable, including the Kimberley and Gulf of Carpentaria, where terminal Pleistocene sea-level inundation of ~1 million km2 should have resulted in
29
From a chronological perspective, archaeological research has historically focussed primarily on the LGM and the late Holocene (e.g. Veth, 1993; Lourandos, 1997). The results here suggest that two other periods are worthy of more detailed investigation, namely the terminal Pleistocene (18-10ka) and the early-to-mid-Holocene (9-6ka), as foreshadowed in the special issue of Antiquity (volume 69) exploring the Pleistocene/Holocene transition (e.g. Allen and O’Connell, 1995; Veth, 1995). The terminal Pleistocene was a period of significant climatic change, and the time-series curves all show large fluctuations in the demographic record. Further characterisation of hunter-gatherer behaviour through this period is needed to allow greater understanding of the situation at the onset of the Holocene, and where we see many shifts in social organisation. In relation to the early-to-mid-Holocene, recent archaeological work demonstrates that a number of behaviours previously assigned to the late Holocene actually occurred much earlier (e.g. fish traps, backed artefacts, etc) (Ulm, 2013; Williams, 2013). Further the results here indicate that population also began to increase at this time.
Other avenues of future research include the further exploration and testing of the time-series curves presented here. From a methodological perspective, there are three main limitations with the taphonomic correction procedures: 1) the correction factor was developed using a global dataset, and may not reflect the loss of site data in Australia, which is generally understood as having ancient and more stable landscapes; 2) the correction curve becomes increasingly unreliable prior to the LGM; and 3) correction does not account for punctuated (rather than gradual) environmental change, nor the loss of sites through inundation of the coastal shelf. Therefore, while this approach is one of the first to attempt to correct an archaeological dataset for taphonomic loss, it still requires exploration and refinement along these three lines of enquiry. As outlined above, recent approaches by Shennan et al. (2013) exploring the deviations of data from an exponential decay mean may provide improved resolution to (1) and (2). An answer to (3) currently remains elusive, although one direction may be to focus on areas where the coastal shelf has remained fairly constant through time (such as Carnarvon and Naracoorte Coastal Plain) and explore the time-series-archaeological record relationship. If the level of disparity between the two records can be quantified, a taphonomic correction procedure for the loss of sites through sea-level inundation may be possible.
8. Conclusions
The analysis undertaken here demonstrates the importance and validity of the ‘dates as data’ approach. We have used a range of archaeological records to explore the time-series plots produced by radiocarbon data and found them to provide a robust picture of changing human behaviour through time. With this knowledge, we have been able to develop regional models of human behaviour and explore their relationship with recent palaeoclimatic syntheses for Australia. We find that hunter-gatherers were highly responsive to climatic change through much of the last 35,000 years, only de-coupling this relationship in the Holocene through new and perhaps unheralded social and technological innovations. While this model is not new to Australian archaeological literature, the data here provide empirical and observable support for this hypothesis for the first time.