Social determinants of the exploitation and management of coral reef resources in Solomon Islands
235
0
0
Full text
(2) SOCIAL DETERMINANTS OF THE EXPLOITATION AND MANAGEMENT OF CORAL REEF RESOURCES IN SOLOMON ISLANDS. Thesis submitted by Tom David Brewer B.Sc. (Hons) University of Queensland. in 2013 for the degree of Doctor of Philosophy at the Australian Research Council Centre of Excellence for Coral Reef Studies James Cook University.
(3) ii.
(4) STATEMENT OF ACCESS I, the undersigned author of this work, understand that James Cook University will make this thesis available for use within the University Library, via the Australian Theses Network, or by other means allow access to users in other approved libraries.. I understand that as an unpublished work, a thesis has significant protection under the Copyright Act but beyond this protection, I do not wish to place any access restrictions to this thesis.. 16th January, 2013 Tom David Brewer. Date of submission. iii.
(5) iv.
(6) STATEMENT OF SOURCES DECLARATION I declare that this thesis is my own work and has not been submitted in any form for another degree or diploma at any university or other institution of tertiary education. Information derived from the published or unpublished work of others has been duly acknowledged in the text and a list of references is given.. ______________________. 16th January, 2013. Tom David Brewer. Date of submission. v.
(7) vi.
(8) STATEMENT OF CONTRIBUTION OF OTHERS Research funding: Australian Research Council Centre of Excellence for Coral Reef Studies Stipend: Australian Postgraduate Award Supervisory Committee: Principle supervisor: Assoc. Prof. Joshua Cinner, ARC Centre of Excellence for Coral Reef Studies, James Cook University Associate supervisors: Distinguished Prof. Bob Pressey, ARC Centre of Excellence for Coral Reef Studies, James Cook University Distinguished Prof. Terry Hughes, ARC Centre of Excellence for Coral Reef Studies, James Cook University Dr Simon Foale, ARC Centre of Excellence for Coral Reef Studies, James Cook University. Survey design and data collection: Assoc. Prof. Joshua Cinner assisted with survey design (chapter 4) Dr Simon Foale assisted with survey design (chapter 4) Freda Paiva assisted with survey translation (chapter 4) Joe Gynegele assisted with the field surveys (chapter 4) Statistical and analytical support: Assoc. Prof. Joshua Cinner (whole thesis) Dr Johnathan Kool (chapter 3) Dr M. Aaron MacNeil (chapter 2A) Dr Nick Graham (chapter 2B). vii.
(9) Dr Rebecca Fisher (chapter 2B) Editorial assistance: Assoc. Prof. Joshua Cinner (whole thesis) Distinguished Prof. Bob Pressey (chapter 2A, Introduction, Discussion) Distinguished Prof. Terry Hughes (chapters 2A, 2B) Dr Simon Foale (chapters 3, 4) Dr Katie Moon (whole thesis) Christina Hicks (chapters 2A, 2B) Dr Alison Green (chapters 2A, 2B) Dr Shaun Wilson (chapter 2B) Dr Rebecca Fisher (chapter 2B) Permits Field work for this thesis complies with the current laws of Australia, and permits necessary for the project were obtained from James Cook University Human Ethics under ethics code H3596. Preferred citation: Brewer, T.D. 2013. Social determinants of the exploitation and management of coral reef resources in Solomon Islands. Ph.D. thesis.. viii.
(10) For Molly, my future.. ix.
(11) x.
(12) ACKNOWLEDGEMENTS First and foremost, thank you to my supervisors. This thesis began as a literature review of a problem that was too expansive for me to articulate; identifying traits of human societies that explain variation in the state of natural resources. My supervisors provided me with support, some tough love, and backed my capacity to engage with the challenge. For this, I thank them all. In particular, Josh, for his patience, sharing of similar experience, giving me many opportunities, supporting my work, and keeping me focused on the core tasks. Thank you to Terry, for his sage advice, lessons in critical thinking and education on the workings of the scientific institution. Thank you to Bob, for his relaxed nature, willingness to let me explore, open-mindedness, and inspiring dedication to the conservation of biodiversity. Thank you to Simon, for his honest appraisal of my work and the work of others, and for long discussions on scientific debate of the functioning of human societies and their interaction with the natural world.. Second, thank you to the academic staff and students at the Australian Research Council Centre of Excellence for Coral Reef Studies for; the many friendships, the many esoteric discussions on the future state of the planet and for the sometimes fierce debates on all things social and ecological. Particular gratitude to my friends who most changed the way I interpret the world; Toby Elmhirst, Johnathan Kool, Piero Visconti, Duan Biggs, Christina Graham, Sylvain Foret.. Third, thank you to the support staff at the Australian Research Council Centre of Excellence for Coral Reef Studies; David Yellowlees, Jenny Lappin, Olga Bazaka, Janet Swanson, Rose-Marie Vasiljuk and Louise Lennon for your friendship, endless patience with my often-convoluted paperwork and your realism.. Fourth, thank you to Chris Fulton of Australian National University for hosting me as a visiting fellow, and to Deborah Blackman of University of Canberra for providing me with desk space for the writing phase of the thesis. xi.
(13) Fifth, thank you to the people and government of, and my friends in, Solomon Islands, for being so welcoming, for supporting me in my research, and for teaching me so much.. Sixth, thank you to those that shared their data with me to ensure the aims of this thesis could be realised. Particularly, thank you to Nick Gagahe of the Solomon Islands statistics office for providing me with the necessary social data, and thank you to The Nature Conservancy for allowing me access to your exceptional ecological database.. Seventh, thank you to my family: Jeannie, David, Sam and Farley, for unquestioning support of my passion, for enduring my often nonsensical rants about my research, and for putting on a brave face when I ask you to read my papers. Particular thanks to Mum and Dad for teaching me to pursue what I believe in, and Mum for caring for Molly whilst I wrote.. Last, thank you to Katie, my love. Over the course of writing this thesis she has taught me so much about the English language; about brevity, clarity, and argument construction. She has given me unwavering support and without her this thesis might never have seen the light of day.. I acknowledge openly, that from the outset of this thesis I have had an agenda beyond knowledge for knowledge sake. That agenda was, and remains, to better understand the interaction between people and natural resources for improved human welfare. I do not, however, believe that this agenda generated a priori bias within the thesis, but rather enhanced the accuracy of the content.. xii.
(14) ABSTRACT Globally, natural resources are declining due primarily to unsustainable human consumption. Resource scarcity and associated problems therefore arise fundamentally from social processes. This thesis compares and contrasts the relative merit of the three dominant environmental sociology perspectives for their respective ability to explain the effect of human societies on natural resources. First is the perspective of population pressure driving resource scarcity; a perspective commonly known, and referred to herein, as ‘Malthusian overpopulation’. Second is the perspective of free market capitalism and associated market expansion driving resource scarcity; a perspective commonly cited as the ‘treadmill of production’ in environmental sociology (herein referred to as ‘market expansion’). Third is the perspective of modernization driving resource scarcity at low levels of modernization and resource abundance at high levels of modernization; a perspective commonly known as ‘ecological modernization’ in environmental sociology and the ‘environmental Kuznets curve’ in ecological economics (herein referred to as ‘modernization’). Each perspective is supported by many scholars, and has a significant literature to substantiate the respective claims of the key social processes that cause change in the state of natural resource. Critical comparison of the three perspectives will likely offer greater insight into interactions between societies and natural resources than examining one perspective alone, and may therefore offer more appropriate solutions to the challenges posed by resource scarcity.. There are gaps in our understanding of society’s effects on natural resources that are apparent from a review of comparative studies on the three dominant perspectives. First, most studies that compare and contrast the relative merit of the three perspectives correlate proxy variables for each of the perspectives [e.g. human population density (for ‘Malthusian overpopulation’), and Gross Domestic Product (for ‘market expansion’)] with environmental indicators (e.g. fishery biomass) without explicitly considering mechanisms such as resource exploitation intensity or resource management institution efficacy. Second, few of the comparative analyses that have been undertaken to date, explicitly compare and contrast the three perspectives at the local-level. Most studies have instead focused on the national-level. Yet interactions xiii.
(15) between societies and resources vary significantly across social-political levels, and one could argue that most decisions to exploit and manage resources do occur at the locallevel, particularly in less affluent societies where there is comparatively limited centralised management and vast reserves of natural resources. Third, there is inadequate attention paid to the developing country context. Most studies that compare the perspectives are either global or focused on affluent nations. Few studies have focused analyses on poorer, economically peripheral nations where much of the world’s biodiversity and other natural resources exist. This is critical for two reasons; first, affluent and poor societies represent very different social contexts so conclusions drawn from global or affluent-nation analyses are unlikely to be transferrable to developing countries; second world systems theory suggests that affluent societies import resources and export pollutants to poorer societies and vice-versa, and therefore opportunities to modernize as per the modernization perspective might be difficult to realize. Fourth, no comparative analyses of the perspectives have included research on local perceptions of society’s effects on natural resources. Understanding local perceptions, however, is useful to confirm (or refute) hypothesis-driven research and potentially useful to increase the likelihood of implementation of research recommendations in applied research.. The aim of this thesis is to fill these research gaps by 1) explaining society’s effects on natural resources, at the local-level in an economically peripheral nation, using dominant environmental sociology perspectives (research gaps 1-3), and to 2) determine whether local perceptions, support or refute the scientific explanation (research gap 4). These broad aims are achieved by completing the following research objectives: 1. Determine which dominant environmental sociology perspectives, of societies effects on natural resources, best explains the effects of exploitation on; a) Coral reef fish that are vulnerable to extinction by overfishing; b) Function and diversity of coral reef fish; 2. Determine which of the perspectives explain the occurrence of coral reef resource management institutions; and xiv.
(16) 3. Determine whether local perceptions support, or refute, the findings, as identified in objectives 1 and 2, of society’s effects on the exploitation and management of coral reef fish.. To achieve research objective 1, I collected secondary social (census) and ecological (survey) data from 25 local-level sites spanning Solomon Islands. I then analysed the data using structural equation models to explain how proxy variables, which represent each of the dominant perspectives, affect fishing pressure to, in turn, affect the distributions of a) biomass of coral reef fish that are vulnerable to overfishing and b) coral reef fish functional group biomass and diversity. The key aspects of fish distributions I examined were explained by fishing pressure. Specifically, there was lower biomass of coral reef fish that are vulnerable to overfishing, lower biomass of key functional groups of fishes, and lower fish species diversity where there was higher fishing pressure. The key finding, which addresses research objective 1 is that fishing pressure was, in turn, driven by high human population density and greater access to markets; proxy variables for the Malthusian overpopulation and market expansion perspectives, respectively. Modernization had no discernable effect on fishing pressure.. To achieve research objective 2, I collected data for proxy variables of each of the dominant perspectives and on coral reef resource management institutions (gear restrictions, species restrictions, and spatial closures) from ≥723 local-level sites spanning Solomon Islands (I developed some of the survey instrument on management institutions but the data were collected by the national government and other agencies). I then tested the effects of each set of proxy variables, which represent each of the perspectives, on the occurrence of management institutions using a range of statistical analyses. I found that the presence of management institutions was negatively correlated with human population density and positively correlated with modernization and the presence of fish markets, lending support to the Malthusian overpopulation perspective, and simultaneously detracting from the market expansion perspective. The results neither clearly supported nor refuted the modernization perspective.. xv.
(17) To achieve research objective 3, I conducted interviews, using a survey instrument, with 119 fishers and fish traders in the major urban centres of Solomon Islands to identify which factors they perceive can increase and decrease coral reef fish stocks. The qualitative responses were coded, and analysed using Principal Components Analysis to derive the dominant perceptions. The interviewed fishers and middlemen perceived an extensive range of factors to be causing fish decline, and also stated a diverse range of management interventions that they perceived would increase fish stocks. Respondents identified fishing as a major cause of fish decline driven by income-related needs, among other factors, which is concordant with the findings of objectives 1 and 2.. In this thesis I compared the three dominant perspectives of society’s effects on natural resources using a novel model in an economically peripheral nation at the local-level. In doing so, I found greatest support for both the Malthusian overpopulation and market expansion perspectives. This finding was concordant with local perceptions, adding further weight of evidence. Given these findings, it can be expected that, with predicted population growth and continued resource commoditization and aspirations of affluence, coral reef resources will likely continue to be depleted in Solomon Islands, and other locations with comparable context (economically peripheral). Policy prescriptions that aim to slow this depletion must consider local population pressure and markets as dominant driving forces.. xvi.
(18) TABLE OF CONTENTS STATEMENT OF ACCESS .......................................................................................................................... III STATEMENT OF SOURCES DECLARATION .................................................................................................. V STATEMENT OF CONTRIBUTION OF OTHERS............................................................................................VII ACKNOWLEDGEMENTS ....................................................................................................................XI ABSTRACT...........................................................................................................................................XIII TABLE OF CONTENTS ................................................................................................................... XVII LIST OF TABLES ................................................................................................................................ XXI LIST OF FIGURES ...........................................................................................................................XXIII CHAPTER 1: INTRODUCTION ............................................................................................................. 1 1.1 DECLINING NATURAL RESOURCES...................................................................................................... 1 1.2 SOCIAL CAUSES OF NATURAL RESOURCE DECLINE ............................................................................. 2 1.2.1 Dominant perspectives .............................................................................................................. 3 1.2.2 Synthesis of the dominant perspectives ................................................................................... 16 1.2.3 General conclusion about perspectives from the literature review ......................................... 20 1.3 RESEARCH GAPS ............................................................................................................................... 21 1.4 RESEARCH OBJECTIVES .................................................................................................................... 31 1.5 THESIS OUTLINE .............................................................................................................................. 31 1.6 SUMMARY OF THESIS CHAPTERS: ..................................................................................................... 32 CHAPTER 2: SOCIAL DETERMINANTS OF CORAL REEF RESOURCE DISTRIBUTIONS . 37 CHAPTER 2A: SOCIAL DETERMINANTS OF THE EXPLOITATION OF CORAL REEF FISHES THAT ARE VULNERABLE TO FISHING .......................................................................... 39 ABSTRACT ............................................................................................................................................. 39 2A.1 INTRODUCTION.............................................................................................................................. 40 2A.1.1 Dominant perspectives .......................................................................................................... 40 2A.2 METHODS ...................................................................................................................................... 43 2A.2.1 Fish Biomass and Vulnerability ............................................................................................ 43 2A.2.2 Social and Economic Data .................................................................................................... 46 2A.2.3 Linking Fish Data to Social and Economic Data ................................................................. 49 2A.2.4 Analysis ................................................................................................................................. 50 2A.3 RESULTS ....................................................................................................................................... 51 2A.3.1 Data Reduction ..................................................................................................................... 51 2A.3.2 Effects of distal drivers on proximate drivers and habitat .................................................... 52 2A.3.3 Distal and proximate drivers of total fish biomass ............................................................... 53 2A.3.4 Distal and proximate drivers of fish biomass in vulnerability categories ............................. 53 2A.4 DISCUSSION .................................................................................................................................. 55 CHAPTER 2B: SOCIAL DETERMINANTS OF THE DIVERSITY AND FUNCTION OF CORAL REEF FISH ASSEMBLAGES................................................................................................................ 59 ABSTRACT ............................................................................................................................................. 59 2B.1 INTRODUCTION .............................................................................................................................. 60 2B.2 METHODS ...................................................................................................................................... 63 2B.2.1 Site Selection and Delineation .............................................................................................. 63 2B.2.2 Ecological Response Variables ............................................................................................. 64 2B.2.3 Proximate Drivers ................................................................................................................. 65 2B.2.4 Distal Drivers ....................................................................................................................... 65. xvii.
(19) 2B.2.5 Model Construction ............................................................................................................... 65 2B.3 RESULTS ........................................................................................................................................ 66 2B.3.1 Effects of Proximate Drivers on Fish Function and Diversity .............................................. 66 2B.3.2 Effects of Distal Drivers on Fish Function and Diversity ..................................................... 68 2B.4 DISCUSSION ................................................................................................................................... 68 2B.4.1 Explaining the effects of Proximate Drivers on Fish Function and Diversity....................... 69 2B.4.2 Explaining the effects of distal drivers on fish function and diversity ................................... 70 2B.4.3 Future model extensions ....................................................................................................... 71 2B.5 CONCLUSION ................................................................................................................................. 72 CHAPTER 3: SOCIAL DETERMINANTS OF CORAL REEF RESOURCE MANAGEMENT INSTITUTION OCCURRENCE ........................................................................................................... 73 ABSTRACT ............................................................................................................................................. 73 3.1 INTRODUCTION ................................................................................................................................. 74 3.2 METHODS ......................................................................................................................................... 76 3.2.1 Data sources and reduction ..................................................................................................... 76 3.2.2 Social and economic drivers .................................................................................................... 77 3.2.3 Resource management institutions .......................................................................................... 78 3.2.4 Analysis ................................................................................................................................... 79 3.3 RESULTS AND DISCUSSION ............................................................................................................... 80 3.4 LIMITATIONS .................................................................................................................................... 86 3.5 CONCLUSIONS .................................................................................................................................. 87 CHAPTER 4: FISHER AND MIDDLEMEN PERCEPTIONS OF CORAL REEF FISH DECLINE AND INCREASE ..................................................................................................................................... 89 ABSTRACT ............................................................................................................................................. 89 4.1 INTRODUCTION ................................................................................................................................. 91 4.2 METHODS ......................................................................................................................................... 94 4.2.1 Field interviews ....................................................................................................................... 94 4.2.2 Data Analysis........................................................................................................................... 99 4.3 RESULTS......................................................................................................................................... 100 4.3.1 Fish decline ........................................................................................................................... 100 4.3.2 Fish increase ......................................................................................................................... 104 4.3.3 Socio-demographic attributes................................................................................................ 108 4.4 DISCUSSION.................................................................................................................................... 110 4.4.1 Scientific and local explanations of coral reef fish distributions........................................... 110 4.4.2 Dominant discourses ............................................................................................................. 111 4.4.3 Socio-demographic attributes................................................................................................ 113 4.4.4 Limitations ............................................................................................................................. 114 4.5 CONCLUSIONS ................................................................................................................................ 115 CHAPTER 5: GENERAL DISCUSSION AND CONCLUSIONS .................................................... 117 5.1 REVIEW OF THE RESEARCH GAPS ADDRESSED IN THIS THESIS INCLUDING THEORETICAL CONTRIBUTIONS ................................................................................................................................... 117 5.2 THE BROAD THEORETICAL CONTRIBUTION OF THIS THESIS: A UNIFIED NARRATIVE OF SOCIETY’S EFFECTS ON CORAL REEF FISHERY RESOURCES IN SOLOMON ISLANDS. ................................................ 124 5.3 LIMITATIONS TO THE THESIS AND CONSEQUENT FUTURE RESEARCH .............................................. 129 5.3.1 The wrong method or missing variables in the general model? ............................................ 130 5.3.2 A missing link in the model .................................................................................................... 131 5.3.3 A modeled system of flows and feedbacks ............................................................................. 133 5.3.4 Linkages among and between levels in the social-political scale .......................................... 135 5.4 GENERAL CONCLUSIONS ................................................................................................................ 139. xviii.
(20) REFERENCES ...................................................................................................................................... 145 CHAPTER 6: APPENDICES ............................................................................................................... 173 APPENDIX 1: RESEARCH CONDUCTED, AND SYMPOSIA/CONFERENCES ATTENDED DURING DISSERTATION PERIOD NOT INCLUDED WITHIN THE THESIS .......................................................................................... 174 Peer-reviewed Publications: ....................................................................................................................... 174 Other Publications (reports, book chapters, other): .................................................................................... 174 Symposia / Conference Presentations / Workshops / Guest lectures .......................................................... 175. APPENDIX 2: FISH SURVEY METHODS AND BIOMASS ESTIMATION ........................................................ 177 Fish survey methods................................................................................................................................... 177 Biomass Calculation .................................................................................................................................. 179 References .................................................................................................................................................. 179. APPENDIX 3: LIST OF FISH INCLUDING VULNERABILITY CATEGORY AND SCORE USED FOR CHAPTER 2A ............................................................................................................................................................ 180 APPENDIX 4: LIST OF FISH INCLUDING FUNCTIONAL GROUPING, AND WHETHER THEY ARE FISHERIES SPECIES, USED IN CHAPTER 2B ............................................................................................................. 189 APPENDIX 5: X, Y PLOTS OF STANDARDISED A) PROXIMATE DRIVERS AND DIVERSITY AND FUNCTION, AND B) DISTAL AND PROXIMATE DRIVERS ............................................................................................ 195 APPENDIX 6: SURVEY USED TO ELICIT FISHER AND MIDDLEMEN PERCEPTIONS .................................... 200. xix.
(21) xx.
(22) LIST OF TABLES Table 1.1 Studies that quantitatively test the relative merit of all three dominant perspectives. .................................................................................................................... 18 Table 1.2 Dominant perspective attributes of Countries and Territories in the Asia Pacific region, including coral triangle initiative member countries. ............................. 29 Table 2A.1 Potential distal and proximate drivers, habitat, and resource state variables used in models, including raw data, data sources, and pre-model transformations. ....... 44 Table 2B.1 Key environmental and human factors that explain in situ coral reef fish diversity and functional group distributions at biogeographic scales relevant to this study. ............................................................................................................................... 62 Table 3.1 Principal components analysis of modernization variables ........................... 78 Table 3.2 Effects of social and economic drivers, including components of modernization, on community-level management institutions. ...................................... 82 Table 4.1 Distribution of respondent socio-demographic attributes across study sites. 98 Table 4.2 Proximate causes of fish decline as perceived by respondents across sites..101 Table 4.3 Principal Components Analysis of key proximate factors (P) and associated distal factors (D), for fish stock decline.. ...................................................................... 103 Table 4.4 Proximate causes of fish stock increase as perceived by respondents across sites. .............................................................................................................................. 105 Table 4.5 Principal Components Analysis of key proximate factors (P) and associated distal factors (D), for increasing fish stocks.. ............................................................... 107 Table 4.6 Spearman’s Rank correlations between candidate socio-demographic explanatory variables .................................................................................................... 108 Table 4.7 Effect of socio-demographic attributes on the dominant discourses (PC’s) of both fish stock decline and fish stock increase ............................................................. 109. xxi.
(23) xxii.
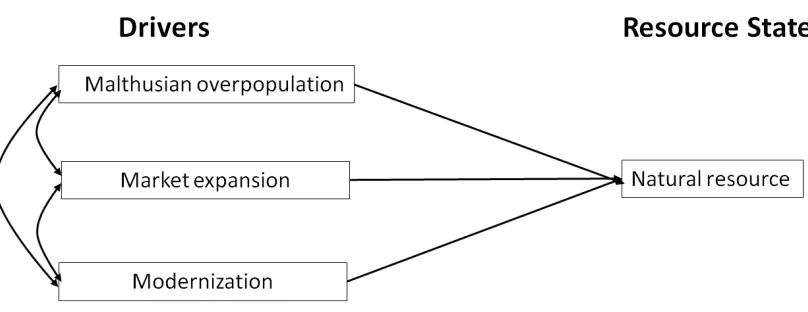
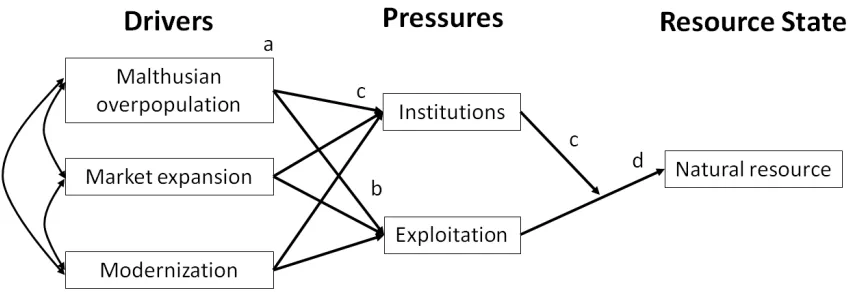
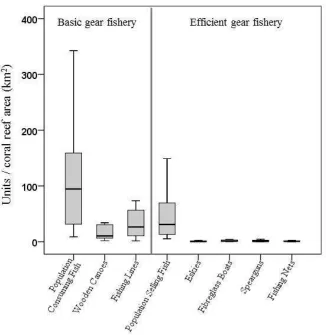
(24) LIST OF FIGURES Figure 1.1 Theorized effect of modernization (expressed as economic development here) on environmental impact in affluent nations showing that, when externalities are considered, environmental impacts do not diminish at high levels of modernization. ... 15 Figure 1.2 Model framework commonly used to test the merit of the three perspectives in explaining the effect of ‘drivers’ (D) on the ‘state’ (S) of natural resources. ............ 22 Figure 1.3 Model framework, derived from Driver, Pressure, State theory. ................ 25 Figure 1.4 Thesis chapter outline ................................................................................... 32 Figure 1.5 Generalised model used in this thesis to test the relative merit of each of the three dominant perspectives for explaining natural resource state. ................................ 33 Figure 2A.1 a The main islands of Solomon Islands showing study site locations, and b. a generalized image of a study site including marine site boundary, ecological sampling location, coral reef area, and villages. ............................................................................ 42 Figure 2A.2 Schematic structural equation model of the social and economic determinants of coral reef fish biomass distributions. .................................................... 51 Figure 2A.3 Density of variables comprising basic gear fishing and efficient gear fishing, across sites. ........................................................................................................ 52 Figure 2A.4 Structural equation modeling results (SEM) of the total effect size (determined by multiplication of path coefficients (β) along each distinct path, prior to summing of distinct paths) for the different distal and proximate drivers for each of the resource state variables based on the general model (Fig. 2A.2). .................................. 54 Fig. 2B.1 Structural equation modeling results (SEM) showing (a) general model used including distal and proximate drivers and (b-i) the total effect size (determined by multiplication of β coefficients along each distinct path, prior to summing of distinct paths) of the different distal and proximate drivers for each of the ecological response variables. ......................................................................................................................... 67 Figure 3.1 Effect of (A) human population size, (B) human population density, (C) modernization, and (D) market access, on the probability of management institution occurrence (± 95% C.I. for A, B, C). .............................................................................. 83 Figure 4.1 Main island chain of Solomon Islands with provinces denoted in uppercase, and survey sites denoted in lower case. .......................................................................... 95 Figure 5.1 Local-level process-based model (which could also be considered a narrative) of society’s effects on coral reef resources in Solomon Islands derived from chapters 2 and 3 of this thesis.+/- = direction (slope) of effects; a-f = see text above and below. ............................................................................................................................ 125 Figure 5.2 A heuristic model of the effect of world systems trade on modernization trajectories for core and peripheral nations................................................................... 129 xxiii.
(25) Figure 5.3 Generalised model used in this thesis. ....................................................... 132 Figure 5.4 Proposed generalised model of the dominant sociological perspectives of society’s effects on natural resources at the local-level embedded within a socialecological framework. .................................................................................................. 134 Figure 5.5 Heuristic model showing hypothetical lag effects between model variables, driven by increasing population density....................................................................... 134 Figure 5.6 Nested social-political levels that interact to effect the local-level exploitation and management (institutions) of coral reef resources in Solomon Islands. ...................................................................................................................................... 138. xxiv.
(26) LIST OF PHOTOS Photo 2A.1 Fishers in traditional wooden paddle canoes in Roviana lagoon, heading out to the reef edge for fishing at dusk. ................................................................................ 48 Photo 2A.2 A typical fibreglass boat used for fishing and transport throughout Solomon Islands ............................................................................................................................. 48 Photo 2A.3 A very kind fish seller, ‘Buss’, who introduced me to fish sellers at the Honiara market. .............................................................................................................. 49 Photo 2A.4 The fish section in the Honiara fish market. ............................................... 57 Photo 4.1 Fera island with Buala township in the background. ..................................... 96 Photo 4.2 A typical catch from a night spearfishing trip in Roviana lagoon, Western Province. ....................................................................................................................... 100 Photo 4.3 The provincial market in Gizo, Western Province, with local fishers selling their catch, primarily caught by night spearfishing using torches and sling spears ...... 104. xxv.
(27)
(28) CHAPTER 1: INTRODUCTION 1.1 DECLINING NATURAL RESOURCES The interaction between people, as individuals and societies, and the natural environment has attracted increasing attention from both the public and scientific community in recent years. Increased attention is likely attributable to our growing acknowledgement of the role of human agency in the depletion of finite natural resources (Frank 1925; Brueckheimer 1956; Machlis 1992; Grossman & Krueger 1995; Ehrlich & Ehrlich 2013), and the resulting decrease in biological diversity and collapse of ecological systems (e.g. Hughes 1994; Scheffer et al. 2001; Sanderson et al. 2002; Rockstrom et al. 2009; Barnosky et al. 2012; Nyström et al. 2012; Ehrlich & Ehrlich 2013). More importantly for humanity, however, is our increasing awareness that humans are dependent on functioning natural systems for our well-being (e.g. Catton Jr & Dunlap 1978; Fuller et al. 2007; Cardinale et al. 2012) and probably for our survival (for examples of localised collapse of societies see Diamond 2006).. Human understanding of both our dependency on the natural environment for our welfare, and the clear negative effect we are having on natural systems, has catalyzed a scientific effort to understand the causes of natural resource decline, particularly the social causes, and prescribe means of changing individual and social behaviour to enable a more sustainable environmental future (Schnaiberg 1980; York et al. 2003a; Mol et al. 2010). The applied aspect of this research assumes that the better we understand the social causes of resource decline, the more effectively we can prescribe policy to improve the condition of natural resources.. 1.
(29) 1.2 SOCIAL CAUSES OF NATURAL RESOURCE DECLINE Identifying the social causes1 of natural resource2 decline is somewhat challenging due to the inherent dynamic complexity and contextual heterogeneity of social-ecological systems 3. Both social and ecological systems are complex and dynamic, and processes within each system operate across multiple scales (Cash et al. 2006). This dynamic complexity is likely becoming more pronounced as societies become more globally connected with ever-increasing flows of information, resources, and people (e.g. Kramer et al. 2009). Both social and ecological systems also possess context-specific traits (Luck 2007), such as localized ecosystem processes and societal customs. Therefore, generalized theory cannot explain all ecological degradation or offer approaches for addressing all ecological degradation (Ostrom 2007).. Out of the complexity of understanding the social causes of natural resource decline, three dominant (i.e. pervasive in the literature) environmental sociology perspectives have emerged that relate to the social causes of natural resource decline. These form the theoretical foundation for this thesis. Each perspective arose at different periods in history, in different contexts, by observation of changing social processes that resulted in changing rates of resource exploitation. Such processes centre on for example, population growth, economic production, institutional adaptation, and technological innovation. Each perspective maintains a unique ideology of our relationship with natural resources, and offers substantively different solutions to halting natural resource decline. It is these differences between the perspectives, I think, that offer divergent insights into the key structural properties of society that cause natural resource decline. Therefore, they offer a fruitful set of perspectives to compare and contrast in this thesis. In short, the perspectives are: 1. “Malthusian overpopulation”: Human population growth drives natural resource scarcity. 1. Herein the term ‘social cause’ refers to any human characteristic, be it economic, demographic, cultural etc., which explains the state of natural resources, correlative or causative. 2 Herein the term ‘natural resources’ refers to any ecological quality that has recognized human utility. 3 A social-ecological system is a system that acknowledges the interdependencies and feedbacks between social and ecological systems – a relatively new paradigm in environmental sociology (Catton Jr & Dunlap 1980).. 2.
(30) 2. “Market expansion”: Economic growth, by natural resource exploitation, drives natural resource scarcity. 3. “Modernization”: Development and associated affluence and institutional reform drive resource scarcity at low levels of modernization, and drive resource abundance at high levels of modernization.. I proceed with a brief summary of the three perspectives; including the thesis (theoretical foundation, narrative, and evidence) and the antithesis (limitations) of each.. 1.2.1 DOMINANT PERSPECTIVES Perspective 1: Malthusian overpopulation: Human population growth drives natural resource scarcity (broadly considered a demographic theory).. Theoretical foundation The most publicly and academically prominent perspective on human-environment interactions is that human population growth and the associated pressure on natural resources is responsible for declining resource conditions (Ehrlich & Holdren 1971; Ehrlich et al. 1971; Pauly 1988; Cropper & Griffiths 1994; McKee et al. 2004). The rationale of this perspective is that resources are finite and so continued increase of human populations will inevitably lead to resource decline, potential species extinctions and ecological collapse. The foundation of this work dates to Rev. Thomas Malthus (1798), who proposed that increased productivity, enabled through linear increase of technological innovation, would temporarily buffer people from resource scarcity, but that human populations would eventually exceed innovation, due to geometric growth, leading to resource scarcity and human suffering. Consequently, proponents of this perspective argue that human population growth must be limited to avoid ‘Malthusian overpopulation’ and human suffering.. 3.
(31) Narrative Human societies, as with populations of other species’, increase their total population to environmental carrying capacity4. Assuming there is environmental variability (e.g. droughts and floods), and inter-specific competition, there will be periods when the total population increases, and times when the population decreases. The ability of humans to increase their environmental carrying capacity through technological innovation (as has occurred in agricultural (and aquaculture/fisheries revolutions during the 20th Century) enables populations to grow. There are limits to innovation, however, and therefore limits to human-modified environmental carrying capacity, and so human populations are ultimately limited. Therefore, it is necessary to limit human populations to within environmental carrying capacity to avoid significant natural resource decline and consequent human suffering.. Evidence There is no doubt that Malthusian overpopulation (frequently measured as population/potential resources) will explain some of the variance of the state of natural resources, including those resources that have direct utility such as fishes and forests, and broader measures of resources, such as biological diversity and the condition of functional groups (see Luck 2007 for a review). For example, there is substantial support in the coral reef literature of the negative effect of human population density on coral reef resources (Jennings & Polunin 1996, 1997; Dulvy et al. 2004a; Dulvy et al. 2004b; Newton et al. 2007; Mora 2008; Sandin et al. 2008; Williams et al. 2008; Cinner et al. 2009b; Mora et al. 2011; Williams et al. 2011; Bellwood et al. 2012). Indeed a popular term for overfishing caused by human population growth is ‘Malthusian overfishing’ (Pauly 1988).. Population density and size are also likely to affect the efficacy of natural resource management institutions5. When populations are adequately high that exploitation exceeds rates of ecological replenishment, it is possible that resource management 4. ‘Environmental carrying capacity’ is defined here as the maximum number of people an environment can sustain indefinitely. 5 Herein the term ‘management institutions’ refers to any set of rules relating to the exploitation of natural resources.. 4.
(32) institutions, which are believed to mediate the effects of Malthusian overpopulation on natural resource exploitation (Agrawal & Yadama 1997), will fail, particularly in the context of common-pool resources (sensu Hardin 1968). There is also evidence that an optimum community population size (neither too small nor too large) might lead to the successful collective action such as natural resource management (Agrawal & Golyal 2001).. Limitations There are five key limitations to the perspective that Malthusian overpopulation alone can explain declining resources. First is a debate on causality. Malthusian perspective proponents argue that increased means of production enables population growth, rather than population growth as the driver of increased production, as argued by Boserup (2005). The central tenet of Boserup’s argument is that necessity (i.e. inadequate food supply) drives innovation as the means of production to prevent suffering and death, and therefore human populations will not outpace the means of production. Boserups thesis has given rise to the idea that rapid population growth, even in areas of marginal productivity, might generate economies of scale in production, and more sophisticated management institutions that ultimately reduce environmental footprints whilst improving quality of life (e.g. Malakoff 2011). Indeed, early research in the Pacific by Johannes (1978) suggests that resource management institutions emerge and evolve, as required, as human population pressure increases and decreased, assuming negative external influence, such as abolition of underlying access rights, is avoided. Second, proponents of Malthusian overpopulation tend to assume that all people interact with the natural environment in the same manner, and consume the same volume and types of natural resource (however Malthus himself acknowledged differences in consumption between individuals of different social class within societies) (see York & Gossard 2004 for an example of context variability in resource consumption). Therefore, human population size per potential available resources cannot accurately predict the state of natural resources. Third, the role of technology tends to be ignored (see Commoner 1972 for early debate on the relative importance of technology in explaining environmental impacts) in explaining natural resource exploitation rates. Yet technologies affect rates of exploitation and consumption, and different societies have access to different technologies. Fourth, local human population size/density does 5.
(33) not account for trade of resources between social-ecological systems– relatively wealthier societies are able to import goods and services and export pollutants, such as those produced by heavy industry, and consequently maintain a population beyond local carrying capacity (Ehrlich & Holdren 1971; Wallerstein 1976). Therefore, it is not possible to conclude that any two societies, equal in population size and equal in net primary productivity (e.g. fisheries or forestry) will have resources of equal condition (e.g. number of trees, fishery biomass). Fifth, it has been observed that high population density (measured as number of fishers per length of coastline) can correlate positively with higher fish biomass (Pollnac et al. 2000). This result was explained by the mobility of fishers, enabling them to migrate to areas of higher resource density. Therefore, the relationship between density of people, and resource condition, should be considered critically, and particularly where human populations are mobile, including nomadic people. Further, a recent study by Pollnac et al. (2010) found stark differences in correlations between human population density and differencess in fish biomass inside and outside spatial closures among three regions; the Caribbean, the Philippines, and the Western Indian Ocean. Specifically, only the Caribbean exhibited a negative correlation between population density and differences in fish biomass, whilst the Western Indian Ocean exhibited a positive correlation among the same variables. The authors explained this as possible high exploitation outside spatial closures. Therefore, adherence to spatial closure rules had a possible over-riding effect on fish biomass in this instance. In essence, this perspective is crude and eco-centric, and does not take adequate account of the modern complex social matrix of human societies6. And so, to explain the human causes of resource decline it is necessary to explore beyond the simplistic narrative of human population size and/or density.. 6. While this perspective is ecologically centric, Malthus makes clear distinction between people and other species with respect to limits to growth and the response to resource scarcity. Subsequently, scholars have frequently ‘ecologised’ and consequently simplified Malthus’ work on the Principles of Population to suggest that individuals within a human society will respond similarly to individuals within a population of, for example, plant or other animal species. This simplification leads to a morally and ethically fraught position of the need to limit human population size to ensure sustainable natural resource use for human well-being.. 6.
(34) Perspective 2: Market expansion: Economic growth, by natural resource exploitation, drives natural resource scarcity (based on the political-economic theory ’neoMarxism’, and more recently the environmental sociology theory of the ‘treadmill of production’).. Theoretical foundation The underlying principle of this perspective, which is rooted in Marxist philosophy (Marx 1887)7, is that of the social perception of the need for economic growth for improved personal and social welfare, enabled through ‘free market’ innovation and exploitation of natural resources. Proponents of this perspective argue that economic growth, rather than environmental sustainability, dominates social and political decision-making. Fundamentally, proponents of this perspective argue that problems related to natural resource scarcity cannot be solved as long as the ideology of dependence on economic growth persists, and that a radical restructuring of the political economy and the elimination of the growth-dependent ideology is required to ensure a sustainable future (Schnaiberg 1980). As stated by a proponent of this perspective ‘..economic growth remains the foundation of decision making with regards to the design, performance and evaluation of production and consumption, dwarfing any ecological concerns’(Schnaiberg et al. 2002, p1.).. The dominant thesis of this perspective is the treadmill of production (Schnaiberg 1980), which has been hailed ‘the single most influential framework of analysis within environmental sociology in the United States’ (Foster 2005). The treadmill of production thesis represents an addition to Marxist philosophy, by describing the process of natural resource degradation by capitalist production (Kovel 2011). However, as Foster states, the thesis is from the United States of America, and despite making reference to market expansion and capitalism, generally, the focus is on the. 7. The philosophy of Karl Marx; particularly in his work on the accumulation of Capital (Marx 1887), relates more to the social effects of resource privatisation, rather than the effect of economic production on natural resources discussed by Allan Schnaiberg as the treadmill of production. However, both theses suggest that the accumulation of capital from natural resources through the ‘free market’ ideology (sensu Smith 1843), is detrimental to human welfare (particularly equality of welfare distribution) and the natural environment. Fundamentally, therefore, this thesis loosely examines the effects of social adherence to the dominant western political philosophies of socialism and capitalism, on the state of natural resources.. 7.
(35) post-WWII United States of America model of production expansion. That is, the purpose of Schnaiberg’s work was to explain monopolistic production – the type of political-economic system promoted in the writings of Ayn Rand (2005), which was based on industrial nations extracting natural resources both domestically and from economically peripheral nations with cheap labour and limited environmental regulation (Gould et al. 2004). Therefore, the treadmill of production is fraught when it is applied to production systems owned and operated in economically peripheral nation contexts void of significant industry, a well-functioning civil service, and a stable society conducive to the development of a significant labour force. Yet, such nations, which are economically marginalised, and peripheral to the global economy (Wallerstein 1976), are prone to significant environmental degradation by natural resource extraction for local consumption, and for export to affluent nations (Singer 1975; FischerKowalski & Amann 2001; Gould et al. 2004). Hence, there is a need to adapt the treadmill of production narrative to suit such contexts or to consider alternative perspectives (see Bunker 2005 for further rationale of the need to consider global position in treadmill of production analysis). Therefore, whilst acknowledging the treadmill of production, and the many subsequent publications reviewing and analysing it, the following narrative is generalised to suit broader contexts including less formal production systems that are common in peripheral nations such as Solomon Islands, which is context for this thesis.. Narrative8 Natural resources are exploited by producers (e.g. logging companies, fishers) to satisfy market demand. Production is supported by governments and other public administration entities because increases in production result in economic growth, employment and material affluence. Producers aim to increase net production and production efficiency to maximise profits (assuming the ideology of constant growth). Production efficiency is increased by the use of technology rather than by an expanded labour force. In the context of small-scale fisheries, fishers would be expected to maximise harvest to maximise income. The use of increasingly efficient gears would 8. Note that this is a significantly simplified narrative to suit broader contexts than discussed by Schnaiberg (1980). The purpose of the simplification is to maintain relevance to the production system analysed in this thesis; a small-scale fishery in a peripheral nation. The next sections continue to refer to the treadmill of production because it has had significant influence in the literature.. 8.
(36) make fishers more competitive by increasing catch, and reducing labour expenses (e.g. boat crew). Key to maximising profits is access to consumer markets (including proximity). Desire for maximised profits drives the use of technology which results in resource depletion. Thus, in the context of local-level social-ecological systems, this perspective differs from the Malthusian overpopulation perspective primarily in that resources are extracted for capital accumulation by exportation from the local socialecological system, rather than for consumption and/or barter within the socialecological system.. Evidence There is a growing literature that supports the perspective that the economic growth ideology, manifest as capitalism and presented as the treadmill of production, is driving resource scarcity. Evidence exists in descriptive works and case studies such as a suite of papers by Gould on industry pollution on the Great Lakes of the United States of America (Gould 1991; Gould 1992, 1994), post-consumer recycling in the United States of America (Weinberg et al. 2000), rainforest eco-tourism in Belize (Gould 1999), and environmental injustice in electronic industries (Pellow & Park 2002; Pellow 2004), to name a few. More recently, scholars have conducted quantitative comparative analysis, using proxy, or manifest, variables [e.g. economic freedom, gross domestic product, urbanization (York et al. 2003a; Özler & Obach 2009)], to amass a significant body of evidence in support of treadmill of production perspective (e.g. Naidoo & Adamowicz 2001; York et al. 2003a; Hoffmann 2004; Clausen & York 2008b, a; Özler & Obach 2009; Bradshaw et al. 2010). In a coral reef context, distance to markets, which can be considered a manifestation of market expansion, explains the condition of harvested fish (Cinner & McClanahan 2006) and in situ fish stocks (Brewer et al. 2009; Cinner et al. 2012a; Cinner et al. 2012b). There is also substantial evidence to suggest that market access erodes fishery management institutions which exist, by and large, to constrain exploitation (e.g. Cinner 2005; McClanahan et al. 2006; Cinner et al. 2007).. Limitations There are three clear limitations to the treadmill of production as a general theory for explaining socially driven resource scarcity. First, as stated above, Schnaiberg derived 9.
(37) the treadmill of production from observations of the rapid rise of industry and corporate enterprise in post-WWII America. Second, the treadmill of production assumes that the producer privately owns natural resources, yet natural resources are often shared my means of common property institutions, with all community members acting as producers, the state (via institutions that set natural resource exploitation rules), and consumers (Weitzman 1974; Wade 1987; Ostrom et al. 1994). That is, in many societies, the members of society possess collective use-rights to resources, such as fisheries or forestry (Gordon 1954; McKean & Ostrom 1995). Third, the complexity of the treadmill of production narrative, which involves dynamic interaction of the state (governance), the production system and the labour force as consumers and workers(see Schnaiberg 1980) makes challenging, any attempts to comparatively and quantitatively test the relevance of the perspective. Consequently, research has focused on contextual descriptions or the use of proxy metrics such as gross domestic product (GDP), to test the occurrence of the treadmill of production, resulting in, what I perceive, to be a failure to produce substantive evidence to support this perspective. For example, quantitative studies often correlate production proxies (e.g. GDP, urbanization) with ecological indicators (e.g. fishery biomass), without considering how such proxies alter production (exploitation) and natural resource management institutions (e.g. Naidoo & Adamowicz 2001; York et al. 2003a; Hoffmann 2004; Clausen & York 2008b, a; Özler & Obach 2009; Bradshaw et al. 2010). A better understanding of how such proxies affect exploitation and management behaviours would improve understanding of the treadmill of production as a social process that causes resource decline. Therefore, while there is significant support for this perspective, there is a need to consider peripheral nation contexts, collective ownership of resources, and behavioural changes including resource exploitation and resource management.. Perspective 3: Modernization: Development and associated affluence and institutional reform drive resource scarcity at low levels of modernization, and drive resource abundance at high levels of modernization (referred to as ‘ecological modernization’ in environmental sociology and the ‘environmental Kuznets curve’ in ecological economics).. 10.
(38) Theoretical foundation The third and final perspective investigated in this thesis is that of ecological modernization and the related environmental Kuznets curve theory. Ecological modernization proponents believe there is a growing emancipation of politics and economy from the environment (Mol 1996), and therefore directly challenge the treadmill of production thesis - that deindustrialization and dramatic economic reform is required to ensure future environmental sustainability (Mol & Spaargaren 2000). Rather, ecological modernization proponents champion both increased efficiency by technological innovation and public and private institutional reform as mechanisms for ensuring a sustainable future (Fisher & Freudenburg 2001) without the need for dramatic economic restructuring of the global economy. They argue that the process of ecological modernization is an essential pre-condition to further development - a part of which is taking inspiration from ecological systems in the design of social and economic systems, to make them more compatible. In the words of a leading proponent of ecological modernization theory: “..the basic premise of the Ecological Modernization Theory is the centripetal movement of ecological interests, ideas and considerations involved in social practices and institution developments, which results in the constant ecological restructuring of modern societies. Ecological restructuring refers to the ecologically-inspired and environment induced processes of transformation and reform going on in the central institutions of modern society.”. (Mol 2003, p59.). The allied environmental Kuznets curve theory is an adaptation of the theory developed by Simon Kuznets of non-linear (inverse U-shaped curve) income inequality with increasing economic growth/production (Kuznets 1955; Grossman & Krueger 1991). The theory is rooted in economics, rather than sociology, and therefore, provides an economically rational explanation for the proposed improvement in natural resource state with increasing affluence (York et al. 2003a).. 11.
(39) Narrative At low levels of modernization, societies exploit natural resources for improved shared and personal welfare. Consequently, natural resources become scarce and pollution levels increase. Once a certain level of modernization, and associated affluence, is attained, societies have the luxury of being able to prioritize natural resource considerations in decision-making. Consequently, at the given level of modernization (which varies across different natural resources and pollutants), natural resources replenish and pollutants diminish as modernization progresses. Ecological modernization proponents suggest that this shift in the social-ecological trajectory is primarily a consequence of institutional reform and technological innovation that is driven by an awareness (largely in post-Industrial nations) of the limits to production and consumption combined with an environmental consciousness and consideration of the welfare of future generations (Mol 2003). Some environmental Kuznets curve scholars suggest that increased modernization and associated affluence allow for import of resources and export of pollutants ( a ‘scale effect’), transition from a primary industry to a service-based economy and, through research and development (a ‘composition effect’), the application of technologies that have a reduced environmental impact (a ‘technique effect’) (see Grossman & Krueger 1991 for theory development; see Cinner et al. 2009b for testing of these effects).. Evidence The modernization perspective is an attractive proposition: that institutions and technology are transforming to ensure sustainable social-ecological systems in the future. Consequently, there is a significant literature discussing the merits of, and providing evidence for, the theory. Evidence of ecological modernization is often based on case studies (e.g. Mol 1995; Mol & Sonnenfeld 2000). A classic example of ecological modernization is the chemical industry in Europe. The industry was the cause of severe environmental deterioration from prior to the Industrial Revolution until the 1980s, when widespread public concern triggered restructuring of the industry. The restructuring included environmental management systems in chemical companies, including environmental accounting, and the production of relatively environmentally products, driven by consumer demand. The industry is now far more aligned with environmental sustainability, and has a greatly diminished negative effect on ecological 12.
(40) systems (Mol 1995). Further, proponents also provide more general regional and global evidence such as the proliferation of environmental non-government organizations (Mol 2000). The majority of quantitative research testing the merit of this perspective has been labelled as the environmental Kuznets curve. The environmental Kuznets curve has been observed in fish catch (Clausen & York 2008a), in situ fishery biomass (Cinner et al. 2009b), the number of threatened bird species (Naidoo & Adamowicz 2001), CO2 emissions (Rosa et al. 2004), city air pollution and water quality (Grossman & Krueger 1995), and deforestation (Ehrhardt-Martinez et al. 2002), to name a few.. Limitations Despite the accumulation of supporting comparative and case study evidence, the modernization perspective has received significant criticism from within the sociology (particularly York & Rosa 2003) and ecological economics (Arrow et al. 1995; Stern et al. 1996) fraternities. Criticisms of the perspective are numerous, so for brevity, I will elaborate on those that have relevance to this thesis only.. York & Rosa (2003) identified four key challenges to the claims of ecological modernization; 1) there is inadequate evidence that institutional modifications lead to ecological improvements; 2) there is inadequate evidence of changes in production and consumption patterns in the latter stages of modernity; 3) that ecological modernization does not adequately show that decreased ecological impact by some entities (e.g. firms, corporations, nations) does not result in increased negative ecological impact by other entities (i.e. ecological modernization does not adequately account for externalities); and 4) there is a need for ecological modernization to show, not only that economies are becoming more resource-efficient, but also that increased efficiency exceeds the pace of total production. Three of these apparent limitations are particularly relevant to this thesis, and therefore elaborated on here.. The second limitation identified by York and Rosa (2003), and elaborated by York et al. (2004), is one of evidence derived from variance (increased variability in context) rather than central tendency (mean trend). That is, in later stages of modernity there exists 13.
(41) increased variability in environmental performance due to increased diversity in production forms (e.g. processes, products and institution types), and therefore, it is possible that outliers that support ecological modernization and the environmental Kuznets curve are being over-reported whilst the mean trend remains one of declining resources with increased affluence. Evidence of this limitation is that ecological modernization and the environmental Kuznets curve are infrequently identified in general cases, such as global analyses of the effects of modernization on environmental footprints (York et al. 2003a; Bradshaw et al. 2010) (Table 1.1), but are more common in context-specific cases in post-industrial nations (e.g. Mol 1995).. The third limitation identified by York and Rosa (2003) suggests that ecological modernization and the environmental Kuznets curve might only apply in affluent societies, such as post-industrial Europe (Fisher & Freudenburg 2001). Variability within nation states is still largely unknown(but see Grossman & Krueger 1995; M'henni et al. 2011), and whether this theory applies to any degree in economically peripheral nations is still unknown. Arthur Mol, a leading author of ecological modernization, acknowledges that a major shortcoming of the theory is that of its Europe-centric nature, and poorer nations and societies might not be undergoing ecological modernization (Mol 2003). This acknowledged limitation fits with world systems theory and dependency theory, whereby the wealthier (core) nations (e.g. United Kingdom, France, Germany, Japan, United States of America) maintain a healthy natural environment by importing goods from, and exporting pollutants to, poor (peripheral) nations (Wallerstein 1974; Singer 1975; Bruckner et al. 2012), and therefore ecological modernization/environmental Kuznets curve trends in core nations are spurious (Figure 1.1). If Wallerstein (1974) and Singer (1975) are correct, then natural resources in relatively poor social-political areas (nations, regions, communities) are being exploited, and consequently degraded, to support consumption by people in relatively affluent social-political areas. Ultimately, there is a distinct need for a better understanding of modernization theories as they apply to any potential development policies in peripheral nations (Frank 1966; but see Hoffmann 2004; Shandra et al. 2009 for evidence of the effect of world system position on natural resources; McKinney et al. 2010). Both of these limitations (2 & 3) suggest there is a. 14.
(42) need for comparative (as opposed to case-based) evidence in a peripheral nation context to determine whether the critique offered by York and Rosa (2003) has merit.. Figure 1.1 Theorized effect of modernization (expressed as economic development here) on environmental impact in affluent nations showing that, when externalities are considered, environmental impacts do not diminish at high levels of modernization. Source: York et al. (2003a).. A final important limitation, which exists across perspectives, is one of causality. The shared narrative of ecological modernization and the environmental Kuznets curve is one of changing social behaviour, including reduced resource exploitation, at a given level of modernization and associated affluence. Yet, there is scant evidence to suggest that modernization causes changing behaviour that, in turn, explains improvements in the state of natural resources. T hat is, the majority of studies correlate modernization (using proxy variables such as GDP and urbanization) with natural resource indicators (e.g. air pollution, species diversity, resource biomass), without explaining the mechanisms by which the non-linear relationship occurs (Grossman & Krueger 1995; York et al. 2003b). Such mechanisms include the scale, technique, and composition effects outlined by Grossman & Krueger (1991). One recent exception is a local-level multi-nation study by Cinner et al. (2009b) that explained increased coral reef fish biomass, with increased modernization, to be caused by differing levels of engagement in fishing (composition effect), differing fishing gears (technique effect), and better transportation (scale effect). Therefore there is a distinct need to understand causality, and in particular, how modernization drives improved resource management institutions and decreased exploitation (Mills & Waite 2009). 15.
(43) 1.2.2 SYNTHESIS OF THE DOMINANT PERSPECTIVES Each of these three perspectives (Malthusian overpopulation, market expansion, and modernization) has a vast literature of supporting evidence in different forms, including qualitative and quantitative evidence from both case studies and comparative analyses. Attempts to compare and contrast the different perspectives have taken different forms, with the general trend of analysis type from descriptive case studies and basic modeling, through to more recent comparative analyses using a combination of social and ecological data.. Early attempts to understand human effects on natural resources began with models that incorporated aspects of each perspective, without explicitly making reference to all three perspectives. The most notable and enduring such model, developed by Barry Commoner, Paul Ehrlich and John Holdren is the I PAT model (Impact = Population * Affluence * Technology) that aimed to explain human impacts on the environment as the effect of population, affluence and technology, such that the effect of all three independent variables is greater than the sum of each in isolation (Ehrlich & Holdren 1971; Commoner 1972). The I PAT model was not an attempt to synthesise the three perspectives, but inadvertently incorporated some of the different variables contained within the three perspectives. Since this time, a number of refinements on this model have been developed (see Chertow 2000 for a review; see York et al. 2003c for a comparison of dominant models). This general model, and its refinements, is useful because it accounts for interaction between dominant independent variables. Conclusions from empirical investigations using I PAT based models vary, but generally, population (P) and technology (T) have frequently explained impact (I), whilst affluence (A) has mixed effects, depending on which indicator variables are used (e.g. gross domestic product), but each variable is context-dependent (York et al. 2002). This approach has generally lent weight to both the Malthusian overpopulation and market expansion perspectives (likely due to the dominant role that technology plays in market expansion) (e.g. York et al. 2003a; York et al. 2003c; Dietz et al. 2007). Recently, with increased availability of large social and ecological data sets, and a more nuanced understanding of the aforementioned perspectives, research has focused on specifically comparing and contrasting the merit of the three perspectives, within single 16.
Figure


+7


Related documents
Flood tides were the dominant environmental driver underlying the formation of aggregations by 10 large coral reef fishes on an outer slope adjacent to the seaward side of a
Maynard, Willis, Marshall and Heron all reviewed and Signature: Authority, Great Barrier Reef Marine Park 2013b, Coral Disease Risk and provided editorial comments to the
The results of this thesis suggest that both fishing and protection from fishing can have significant effects on the behaviour of some coral reef fishes Chapter 3, which not
This study investigated the independent and inter- acting effects of water temperature and food availabil- ity on reproductive output and body condition of the coral reef
LIST OF TABLES Chapter 2: Spatial and temporal patterns in the effects of farmers on benthic communities on a coastal coral reef Table 1.. Categorization of
Here we explore the direct and indirect effects of exploita- tion on the size structure of coral reef fish communities along a spatial gradient of subsistence fishing intensity across
Understanding this variation will be important for predicting the effects of climate change on coral reef fish communities, because for some species elevated CO 2 levels may
The dynamic of target fish resources in coral reef fisheries at the coastal area of Ternate Island based on the growth parameters indicated that the growth pattern of
