This is the
Accepted Version
of a paper published in the
journal Water Science and Technology:
Schneider, Philip A., Wallace, James W., and Tickle, Julian
C. (2013)
Modelling and dynamic simulation of struvite
precipitation from source-separated urine.
Water Science
and Technology, 67 (12). pp. 2724-2732.
http://dx.doi.org/10.2166/wst.2013.184
Modelling and Dynamic Simulation of Struvite Precipitation from Source Separated Urine
Philip A. Schneider*, James W. Wallace and Julian C. Tickle
School of Engineering and Physical Sciences, James Cook University, Townsville, Queensland, 4811, Australia *Corresponding author ([email protected])
Abstract
A model of a mixed-mode nutrient recovery reactor is developed for a urine feed, incorporating complex solution thermodynamics, dynamic conservation relations and a power-law kinetic expression for crystal growth from seed crystals. Simulations at nominal operating conditions predict phosphorus recoveries greater than 99%, based on existing process kinetic parameters and operating conditions employed in previously published studies. The overall rate of nutrient recovery depends on Saturation Index of the precipitating solid, the available surface area for mass transfer and the feed rate of the limiting constituent ion. Under the conditions considered, the nutrient feed rate appears to be the limiting factor for precipitation. Simulations demonstrate that diurnal feed flow variations of have a small effect on the rate of nutrient recovery. Overall, the study shows that valuable insights are gained in relation to process performance predictions, which should lead to more confident process design, operation and control.
Keywords
Nutrient removal and recovery, source-separated urine; struvite; process modelling; kinetics; thermodynamics.
INTRODUCTION
Phosphorous is an essential nutrient for all living things. The human population consumes approximately 40 million tons of phosphate rock per year and, with annual demand increasing by 1.5%, it is estimated that approximately 100 years of phosphate rock reserves (Shu, Schneider, Jegatheesan, & Johnson, 2006). Therefore, alternative phosphorous sources are becoming increasingly important. Source-separated urine is one such potential feedstock (Etter, Tilley, Khadka, & Udert, 2011).
Crystallisation/precipitation is an established recovery technique giving high removal rates, effective process control and stability of the resultant mineral phosphate, such as struvite (magnesium ammonium phosphate) (Bhuiyan, Mavinic, & Beckie, 2008). Nutrient recovery from source-separated urine has the potential to provide benefit to low socio-economic communities, which is ideal for distributed treatment systems.
Struvite formation occurs when magnesium, phosphate and ammonia react, according to the following stoichiometry.
( ) ( ) ( ) ( )
A key challenge in the development of nutrient removal and recovery process is to manage the risks associated with process design. Since risk is inversely proportional to knowledge, it follows that the more we know about a proposed design, the better we can manage risk, lowering costs and mitigating unintended process design failures.
METHODS
concentration and flow rate, acid/base flow rates, etc.). Owing to its complexity, the model must be solved numerically. Once the equations can be solved to an acceptable error tolerance, a range of scenarios is considered to determine cause-and-effect behaviour and performance of the system. Model Development
A mixed-mode reactor, shown in Figure 1, is considered wherein the nutrient-rich urine flows through the reactor (i.e. continuous mode) and the precipitated solid phase is retained (i.e. batch mode) and then periodically harvested. The model for this system describes the solution thermodynamics, used to predict the driving force for crystal precipitation/growth, the dynamic mass conservation of all elements present in the liquid and solid phases, and a dynamic population balance that describes changes in the crystal population (Randolph & Larson, 1988).
Figure 1: Schematic diagram of mixed-mode nutrient recovery reactor
Solution thermodynamics
The solution within the nutrient recovery reactor can be fully specified with a series of algebraic relations. Solution is defined by
( )
where represents the activity of the hydride ion in solution.
Urine consists of a number of elements, including magnesium, chlorine, sodium, nitrogen, phosphorous, potassium, sulphur and carbon, distributed across a range of species (see Table 1), and must be accounted for. All equilibria are represented by an algebraic equation of the form
∏ ∏
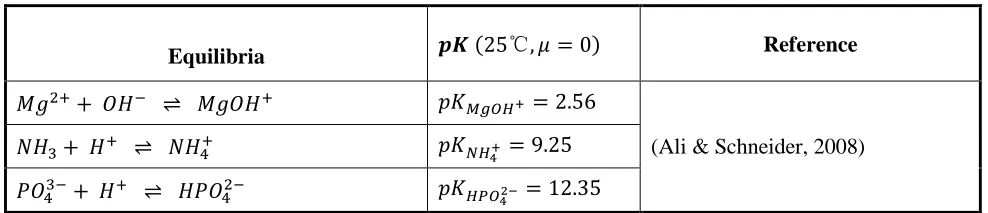
[image:3.596.49.543.658.765.2]where is the activity of the products and reactants involved in the equilibrium relation. Table 1: Chemical equilibria considered in this study
Equilibria ( ) Reference
(Ali & Schneider, 2008)
Equilibria ( ) Reference
(Doyle & Parsons, 2002)
(Ronteltap, Maurer, & Gujer, 2007)
( )
(Stumm & Morgan, 1996)
( )
(K.M. Udert, Larsen, & Gujer, 2003)
( )
( ) ( )
( )
( )
( )
Solution is determined by the inclusion of the electroneutrality condition (i.e. charge balance), which is
∑
where is the analytic concentration of ionic species, , and its charge, either ,
or .
Owing to real solution effects, the activity of each ion, , is employed instead of its concentration
where is the activity coefficient for the species in question and takes a value of either , or , depending on its charge. Owing to the high ionic strength of urine, values were based on the DeBye-Hückel equation (Ronteltap et al., 2007) with Davies approximation
( ) ( √
√ )
where A is a temperature-dependent constant ( ) and is the ionic strength of the solution, given by
∑
A key thermodynamic variable is the saturation index, or , which, for struvite, is
(( ) ( ) ( )
)
where is the equilibrium solubility product of struvite, and the numerator is the ion activity product of struvite’s constituent ions. The numeric value of determines its thermodynamic state: positive, the solution is supersaturated in struvite; negative, the solution is undersaturated; and zero, saturated. The of solution will be used as the driving force for the molar precipitation rate of struvite.
Conservation of elements
The total liquid-phase concentration for each element, , is the sum of concentration of those complexes, , that contain element , taking into account the stoichiometric proportion of the element in complex , .
∑
Each of the seven elements in the system must be conserved. The following differential equation describes each element's molar inventory in a well-mixed solution.
( )
( )
In the above relation is the liquid volume in the reactor, and , are the flows (in and out) of the reactor and is the concentration of element in the combined feed stream. The far right hand term accounts for the rate loss of elements from liquid to solid phase, where is the molar formation rate of struvite and is the stoichiometric proportion of the elements found in struvite (i.e. magnesium, nitrogen or phosphorus).
The liquid volume in the reactor is subject to change, depending on the in and out flows, and will be reduced as the volume of retained precipitant typically increases.
Struvite formation rate
While previous workers (Nelson, Mikkelsen, & Hesterberg, 2003; Quintana et al., 2005; Turker & Celen, 2007) modelled the rate of desupersaturation of the solution, the approach taken in this work considers the formation rate of solid struvite. This rate depends on characteristics of the particles, such as their number, geometry and the thermodynamic state of the solution.
While struvite crystals/particles are clearly non-spherical, it is convenient to track the number-average diameter of spheres of the same volume as the struvite crystal in question. As such, the variable ̅ is the average spherical-volume-equivalent diameter, which can be used to determine the volume of the crystal
̅
and thus its rate of change with time is
̅ ̅
The rate of change of the spherical volume-equivalent diameter of a struvite crystal, ̅, is assumed to have a power-law dependency on the saturation index, , of struvite.
̅
The power law dependency (i.e. ) is expected to lie between 1st to 2nd order (Bouropoulos & Koutsoukos, 2000; Kofina & Koutsoukos, 2005), while the rate coefficient, , must be determined by experiment (Ali & Schneider, 2008). This approach is similar to that of (Bhuiyan et al., 2008), except that it does not include a diffusion effect in the growth model, since the system is well mixed and therefore diffusion effects are not considered important.
The rate of change of the total volume of crystal present requires knowledge of the total number of crystals present, , which is assumed to be constant, implying that no nucleation takes place. Clearly this is not the case, but was assumed to radically simplify the problem.
It follows that the molar rate of change of struvite, , is
where the density of the crystal is represented by and the molecular weight of struvite is
.
The recovery of phosphorus is a key performance measure of any nutrient recovery system. Its recovery is based on the thermodynamic efficiency, which accepts the fact that not all of the phosphorus can be removed (since it remains, unattainable, in the saturated solution). As such, phosphorus recovery was defined as
(
)
(
)
Simulation
With appropriate initial conditions for the differential equations, inlet flows and concentrations, and kinetic and operational parameter values, the set of DAEs was solved using Engineering Equation Solver1 (EES), predicting the time-varying (i.e. dynamic) behaviour of the system.
Initial conditions and process specifications
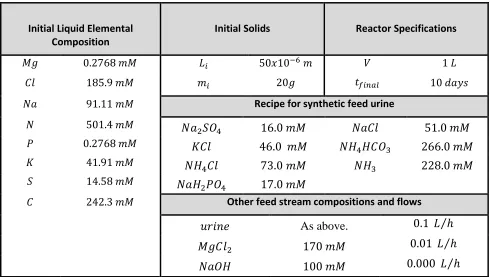
[image:7.596.51.541.352.629.2]Table 2 specifies the reactor initial conditions, feed compositions and flows and reactor specifications. The liquid phase initial conditions was specified to be urine, saturated in struvite. A 1-litre reactor volume was chosen as a matter of convenience, and could be scaled to larger volumes (assuming that the system remains well mixed with increasing size). It was arbitrarily decided that the system would operate on a repeating 10-day cycle, at which time the system is allowed to equilibrate and then the accumulated struvite is harvested, returning the system to its initial conditions. The urine feed was modelled as though the compounds listed in the same table had been blended and the urea was fully hydrolysed. The nominal flow and concentration of the urine, magnesium source and sodium hydroxide streams are also detailed. The hydraulic retention time of 10 hours is similar to the system operated by Ronteltap (Ronteltap, Maurer, Hausherr, & Gujer, 2010). The feed condition was formulated such that the molar supply rate of magnesium was equivalent to that of phosphorus.
Table 2: Initial conditions, reactor specifications, feed compositions and flows to the reactor
Initial Liquid Elemental Composition
Initial Solids Reactor Specifications
Recipe for synthetic feed urine
Other feed stream compositions and flows
As above. ⁄
⁄
⁄
Thermodynamic and kinetic parameters
The values, given in Table 1, define the chemical equilibria.
The solubility product for struvite was (Ohlinger, Young, & Schroeder, 1998). Of course other values could be used to assess the importance of this parameter.
The kinetic parameters chosen for the crystal growth rate expression were reported earlier (Ali & Schneider, 2008). The rate coefficient was ⁄ , and the order of the linear growth rate was .
The set of DAEs was composed of 252 equations, 12 of which were differential and 240 algebraic. EES, as with any numeric solver, requires valid initial guesses (not to be confused with initial conditions for the differential equations!) for all unknown variables. As such, the EES input file must be interactively built, updating these guess values along the way.
The EES input file was formulated so that the system was fed a constant flow of urine and solutions. An EES procedure was created such that both inlet flows changed to zero once the process had completed 90% of the - ( ) operational cycle or campaign. This was done to simulate the exhaustion of struvite from solution, after which the solid struvite material is harvested. This leaves a saturated solution, ready to be seeded with solid struvite for the next operational cycle.
RESULTS AND DISCUSSION
Results
Owing to the release of ammonium by urea hydrolysis, the urine feed solution was calculated by the model to have an equilibrium value of . This was encouraging, since other workers observed similar behaviour for real urine (Ronteltap et al., 2007; K. M. Udert, Larsen, Biebow, & Gujer, 2003). As a result, no sodium hydroxide was required to generate a positive , and, thus, its flow was set to zero in all simulations.
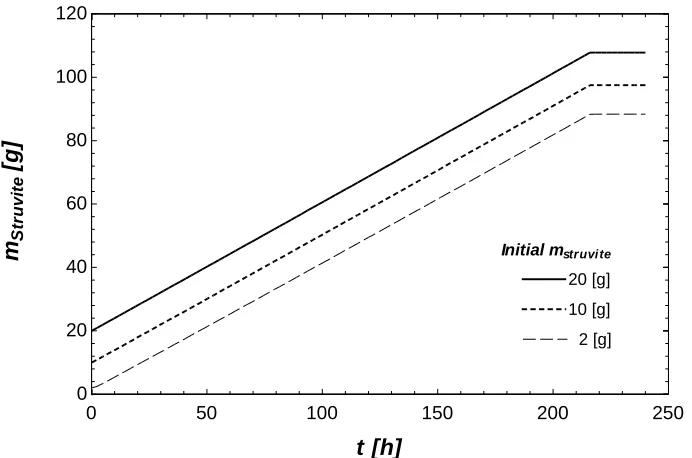
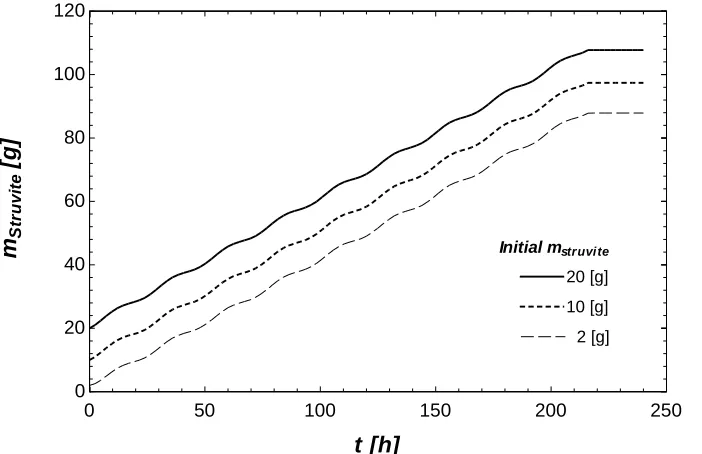
The formation, and subsequent retention, of struvite in the reactor are shown in Figure 2 for a range of initial seed mass, ( , and ). All cases show strikingly similar rates of struvite accumulation, as seen by the parallel slopes, despite the tenfold range in the initial mass. This suggests that offers adequate surface area (i.e. buffering) to accommodate the necessary mass transfer.
During the last 10% of the campaign, when the urine and magnesium inlet flows were set to zero, it is interesting to note that solution desupersaturation offers very little additional increase in struvite mass, illustrating the highly non-linear (and highly sensitive) dependency of changes in the saturation index to changes in the solution mass balance.
Figure 3 shows the temporal trajectories of struvite , again for the same range of starting seed quantities. At the start of each cycle, the , owing to the use of the saturated urine from the previous cycle. However, rises rapidly upon commencement of urine and magnesium feeding, then declines slowly throughout the remainder of the operational campaign. It is of interest to note that larger values for lead to reduced struvite peaks. This is due to the larger initial, and subsequent, surface area for mass transfer, which requires a lower thermodynamic driving force for the same recovery rate. This is an extremely important feature and suggests that retaining more solids should lead to enhanced nutrient recoveries.
[image:9.596.65.427.329.555.2]
Figure 2: Mass of struvite produced and retained in 10-day operation of nutrient recovery reactor with varying initial amounts of struvite
Figure 3: Struvite saturation index in 10-day operation of nutrient recovery reactor with varying initial amounts of struvite
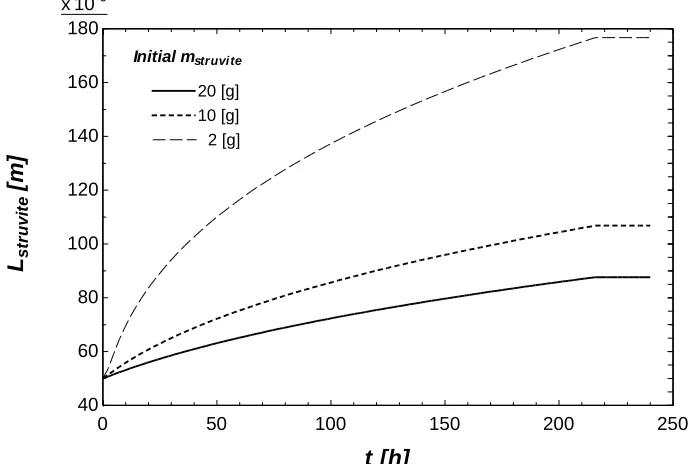
Figure 4 shows the effect of the initial mass of struvite on the average crystal size, ̅, throughout the operating time. As expected, the greatest mass of initial struvite, and thus the greatest number of crystals, , requires these crystals grow less than the cases where less initial struvite mass is present. This corresponds directly to the lower profile in Figure 3, since less thermodynamic driving force is required to grow the crystals to a smaller ultimate size.
0 50 100 150 200 250
0 20 40 60 80 100 120
t [h] mS
tr
u
v
it
e
[
g
]
20 [g] 20 [g]
10 [g] 10 [g]
2 [g] 2 [g]
Initial mstruvite
0 50 100 150 200 250
0 0.5 1 1.5
t [h]
S
Istr
u
v
it
e
20 [g] 20 [g]
2 [g] 2 [g] 10 [g] 10 [g]
Figure 4: Length of struvite crystals in 10-day operation of nutrient recovery reactor with varying initial amounts of struvite
[image:10.596.58.402.77.309.2]At the nominal feed rate of urine, phosphorus recovery quickly rises to better than 98.5% and over the 10-day campaign approaches 99.5%, as pictured in Figure 5. At double and quadruple rates of urine feed, recovery approaches lower ultimate values. This again shows the predictive capability of the model in relation to process design and operation, suggesting that a number of scenarios could be played out before construction and operation of such a unit is executed. Clearly this reduces the risk of uncertainties affecting health and safety, financial and/or operational matters.
Figure 5: Phosphorus recovery in 10-day operation of nutrient recovery reactor with varying feed rates
Consideration is also given to the operational impact of a diurnal variation in the urine feed rate with an amplitude of around its nominal rate of flow. The resultant trajectories are very sensitive to these feed rate variations, as shown in Figure 6, and it is clear that operation with a lower mass of struvite is more sensitive.
0 50 100 150 200 250
x 10-6
40 60 80 100 120 140 160 180
t [h] Ls
tr
u
v
it
e
[
m
]
20 [g] 20 [g] 10 [g] 10 [g] 2 [g] 2 [g]
Initial mstruvite
50 100 150 200
95 96 97 98 99 100
t [h]
R
e
c
o
v
e
ry
[
%
]
Nominal feed rate
2 x
4 x
[image:10.596.61.402.438.665.2]Figure 6: Struvite saturation index in 10-day operation of nutrient recovery reactor with varying initial amounts of struvite subjected to a sinusoidal variation in urine feed
Interestingly, the struvite mass trajectories are much less sensitive to these flow variations, as shown in Figure 7, and show that the same quantity of struvite is recovered, as before. This is due to the fact that the struvite mass results from the integral of the flow, which attenuates the impact of these very significant feed variations.
Figure 7: Mass of struvite produced and retained in 10-day operation of nutrient recovery reactor with varying initial amounts of struvite subjected to a sinusoidal variation in urine feed
Discussion
Why does the mass deposition rate of struvite appear to be insensitive to the initial mass of seed struvite employed? In answer to this it is important to recognise that while a positive is a necessary condition of struvite supersaturation, this alone is not sufficient to predict the rate of struvite recovery. Rather, it is the combination of the , along with the surface area available for mass transfer, that determines the overall mass deposition rate of struvite ion constituents. As shown in Figure 3, if less seed crystal is employed, the available surface area is reduced, limiting
0 50 100 150 200 250
0 0.5 1 1.5
t [h]
S
Istr
u
v
it
e
20 [g] 20 [g]
2 [g] 2 [g] 10 [g] 10 [g]
Initial mstruvite
0 50 100 150 200 250
0 20 40 60 80 100 120
t [h] mS
tr
u
v
it
e
[
g
]
20 [g] 20 [g]
10 [g] 10 [g]
2 [g] 2 [g]
[image:11.596.61.412.389.616.2]the mass deposition rate of struvite, in turn leading to higher levels of in the reactor. In the extreme case, the system would be so limited by the lack of surface area that the SI would build to extremely high levels that would lead to excessive nucleation of struvite, rather than seed crystal growth.
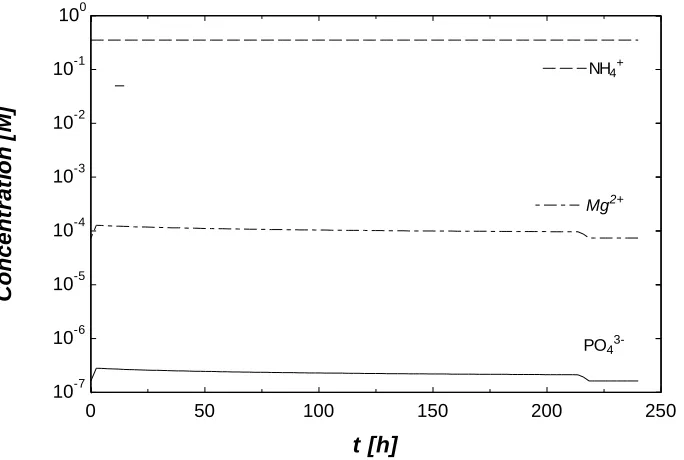
The rapid and significant decline in struvite during the last day of operation is also of interest, since it was put in place to offer a final exhaustion of struvite from the solution. Counterintuitively, the large drop (i.e. 0.25) in the at the end of the cycle (see Figure 3) yields only a slight additional recovery of struvite, as shown in Figure 2. To explain this reference is made to Figure 8, which shows the log-concentration of the struvite constituent ions (i.e. , and ) over the duration of the campaign. Clearly, the final drop in occurs due in large part to the reduction in the concentrations of and ions. However, at such low concentrations, this reduction in causes only a small change in the mass balance of the system (in the order to molar). This implies that there is a significant nonlinear element to the system's thermodynamic behaviour and, as such, caution should be exercised when using as the driving force for the rate of precipitation without careful consideration of these nonlinearities.
Figure 8 also shows that the non-equilibrium solution species ratios ( ) of approximately ( ), even though the magnesium and phosphorus inlet flows were equimolar. This occurs because the tends to complex with a wider range of ions, leaving less free phosphate available for struvite formation. Thus it is the release rate of into the solution, and not simply the feed rate of total phosphorus in urine, that determines the and thus the recovery rate of struvite. This underlines the importance of modelling solution thermodynamics in nutrient recovery systems.
Figure 8: Struvite constituent ion concentrations in 10-day operation of nutrient recovery reactor at nominal operating conditions
It is also apparent that the process is self regulating in the face of significant variations in urine feed rates, which is due to the buffering effect of the surface area available for struvite deposition. The implies that limited process control would likely be required to maintain reasonably stable nutrient recovery rates, as long as a sufficient level of seed crystal is employed.
0 50 100 150 200 250
10-7 10-6 10-5 10-4 10-3 10-2 10-1 100
t [h]
C
o
n
c
e
n
tr
a
ti
o
n
[
M
]
Mg2+
NH4+
[image:12.596.64.406.398.628.2]3-CONCLUSIONS
The model that was developed to describe the dynamic behaviour of a mixed-mode nutrient recovery reactor predicted the recovery rate of struvite from a hydrolysed urine feed. The set of DAEs were successfully simulated across a range of operating conditions.
Recovery of phosphorus appears to be better than across the range of hydraulic residence times considered.
Recovery rates of struvite from a urine feed are insensitive to variations mass of struvite seed present in the range investigated, but instead depended on the rate of feed of the limiting nutrient. Dynamic feed flow variations of were attenuated in terms of their impact on the rate of recovery of nutrients from the feed.
Significant insights into process design and operation result from the modelling and simulation of such systems, and should be incorporated into the design of any nutrient recovery system.
REFERENCES
Ali, M. I., & Schneider, P. A. (2008). An approach of estimating struvite growth kinetic incorporating thermodynamic and solution chemistry, kinetic and process description.
Chemical Engineering Science, 63(13), 3514-3525. doi: DOI: 10.1016/j.ces.2008.04.023 Bhuiyan, M. I. H., Mavinic, D. S., & Beckie, R. D. (2008). Nucleation and growth kinetics of
struvite in a fluidized bed reactor. Journal of Crystal Growth, 310(6), 1187-1194. doi: DOI: 10.1016/j.jcrysgro.2007.12.054
Bouropoulos, N. C., & Koutsoukos, P. G. (2000). Spontaneous precipitation of struvite from aqueous solutions. Journal of Crystal Growth, 213(3-4), 381-388.
Doyle, J. D., & Parsons, S. A. (2002). Struvite formation, control and recovery. Water Research, 36(16), 3925-3940. doi: Doi: 10.1016/s0043-1354(02)00126-4
Etter, B., Tilley, E., Khadka, R., & Udert, K. M. (2011). Low-cost struvite production using source-separated urine in Nepal. Water Research, 45(2), 852-862. doi: DOI: 10.1016/j.watres.2010.10.007
Kofina, A. N., & Koutsoukos, P. G. (2005). Spontaneous precipitation of struvite from synthetic wastewater solutions. Crystal Growth & Design, 5(2), 489-496.
Nelson, N. O., Mikkelsen, R. L., & Hesterberg, D. L. (2003). Struvite precipitation in anaerobic swine lagoon liquid: effect of pH and Mg : P ratio and determination of rate constant.
Bioresource Technology, 89(3), 229-236. doi: 10.1016/S0960-8524(03)00076-2
Ohlinger, K. N., Young, T. M., & Schroeder, E. D. (1998). Predicting struvite formation in digestion. Water Research, 32(12), 3607-3614.
Randolph, A. D., & Larson, M. A. (1988). Theory of particulate processes : analysis and techniques of continuous crystallization (2nd ed.). San Diego: Academic Press.
Ronteltap, M., Maurer, M., & Gujer, W. (2007). Struvite precipitation thermodynamics in source-separated urine. Water Research, 41(5), 977-984. doi: 10.1016/j.watres.2006.11.046
Ronteltap, M., Maurer, M., Hausherr, R., & Gujer, W. (2010). Struvite precipitation from urine - Influencing factors on particle size. Water Research, 44(6), 2038-2046. doi: 10.1016/j.watres.2009.12.015
Shu, L., Schneider, P., Jegatheesan, V., & Johnson, J. (2006). An economic evaluation of phosphorus recovery as struvite from digester supernatant. Bioresource Technology, 97(17), 2211-2216. doi: DOI 10.1016/j.biortech.2005.11.005
Stumm, W., & Morgan, J. J. (1996). Aquatic Chemistry (3rd ed.). New York: Wiley.
Turker, M., & Celen, I. (2007). Removal of ammonia as struvite from anaerobic digester effluents and recycling of magnesium and phosphate. Bioresource Technology, 98(8), 1529-1534. doi: 10.1016/j.biortech.2006.06.026
Udert, K. M., Larsen, T. A., Biebow, M., & Gujer, W. (2003). Urea hydrolysis and precipitation dynamics in a urine-collecting system. Water Research, 37(11), 2571-2582. doi: 10.1016/S0043-1354(03)00065-4