1
Quantifying the benefit of early climate change mitigation in avoiding
1biodiversity loss
23
Authors 4
Warren, R1., VanDerWal, J2., Price, J.3, Welbergen, J.A2, Atkinson, I.3, Ramirez-Villegas, J.4,5,6, 5
Osborn, T.J.7, Jarvis, A.4, 5, Shoo, L.P.2,8, Williams, S.E.2, Lowe, J.9 6
7
Affiliations 8
1Tyndall Centre, School of Environmental Sciences, University of East Anglia, Norwich, UK 9
2Centre for Tropical Biodiversity and Climate Change, School of Marine and Tropical Biology, James 10
Cook University, Townsville, Australia 11
3School of Environmental Sciences, University of East Anglia, Norwich, UK 12
4International Center for Tropical Agriculture (CIAT), Cali, Colombia 13
5CGIAR Research Program on Climate Change, Agriculture and Food Security (CCAFS), Cali, 14
Colombia 15
6School of Earth and Environment, University of Leeds, UK 16
7Climatic Research Unit, School of Environmental Sciences, University of East Anglia, Norwich, UK 17
8School of Biological Sciences, The University of Queensland, St Lucia, QLD, Australia 18
9 Met Office Hadley Centre, Department of Meteorology, The University of Reading, Reading, UK 19
2 Climate change is expected to have significant influences on terrestrial biodiversity at 21
all system levels, including species-level reductions in range size and abundance, 22
especially amongst endemic species1-6. However, little is known about how mitigation of 23
greenhouse gas emissions could reduce biodiversity impacts, particularly amongst 24
common and widespread species. Our global analysis of future climatic range change of 25
common and widespread species shows that without mitigation, 57±6% of plants and 26
34±7% of animals are likely to lose ≥50% of their current climatic range by the 2080s. 27
With mitigation, however, losses are reduced by 60% if emissions peak in 2016 or 40% 28
if emissions peak in 2030. Thus, our analyses indicate that without mitigation, large 29
range contractions can be expected even amongst common and widespread species, 30
amounting to a substantial global reduction in biodiversity and ecosystem services by 31
the end of this century. Prompt and stringent mitigation, on the other hand, could 32
substantially reduce range losses and ‘buy’ up to four decades for climate change 33
adaptation. 34
The IPCC3 estimates that 20-30% of species would be at increasingly high risk of 35
extinction if global temperature rise exceeds 2-3°C above pre-industrial levels. However, 36
since quantitative assessments of the benefits of mitigation in avoiding biodiversity loss are 37
lacking, we know little about how much of the impacts can be offset by reductions in 38
greenhouse gas emissions. Furthermore, despite the large number of studies addressing 39
extinction risks in particular species groups, we know little about the broader issue of 40
potential range loss in common and widespread species, which is of serious concern as even 41
small declines in such species can significantly disrupt ecosystem structure, function and 42
services7. 43
Here we quantify the benefits of mitigation in terms of reduced climatic range losses 44
3 for adaptation. In particular, we provide (i) a comprehensive analysis of potential climatic 46
range changes for 48,786 animal and plant species across the globe, using the same set of 47
global climate change scenarios for all species; and (ii) a direct comparison of projected 48
levels of potential climate change impacts on the climatic ranges of species in six 21st century 49
mitigation scenarios, including a ‘no policy’ baseline scenario in which emissions continue to 50
rise unabated (Fig. 1, Table 1). To calculate the climatic range changes, we employed 51
MaxEnt, one of the most robust bioclimatic modelling approaches for cases where only 52
presence data (as opposed to presence-absence) are available8. MaxEnt models the 53
probability of a species’ presence, conditioned on environment8 so that in this paper ‘climatic 54
range change’ specifically refers to the change in the modelled probability of a species’ 55
occurrence, conditioned on climatic variables. Eighty percent of the species studied have 56
climatic ranges in excess of 30,000 km2, which is the range size used by Bird Life 57
International to delineate ‘restricted range species’, whilst less than 7% have ranges 58
occupying less than 20,000 km2 (Supplementary Fig. S1). Our study therefore focuses on 59
quantifying the effects on widespread species, which are in general more common and less 60
likely to become extinct than restricted range species9, in contrast to previous studies that 61
have only speculated that there may be effects such species1-6 . In projecting future 62
distributions, we use three class-specific long-term average ‘dispersal’ scenarios (zero, 63
realistic, and optimistic). These scenarios are based on the available literature and specifically 64
refer to the rates at which species’ ranges, through an average of individual dispersal events 65
(colonization and extirpation), shift over time (Supplementary Table S1, and Supplementary 66
Methods). 67
With no mitigation, the median global annual mean temperature change reaches 4°C 68
above pre-industrial levels by 2100 (Fig1, Table 1, A1B baseline scenario). Even with 69
4 their climatic range by the 2080s (Table 1, Fig. 2). Here, the standard deviation arises from 71
the use of different GCM patterns for downscaling (see Methods). With no long-term 72
dispersal (also reflecting the potential for barriers to inhibit realistic dispersal), 42±7% of the 73
animals lose 50% or more of their climatic range, whilst the figures for plants remain 74
unchanged owing to their lower dispersal rates (Table 1). The projected climatic range losses 75
under these realistic long-term dispersal assumptions demonstrate clearly that climate change 76
would have an impact even on more widespread species in addition to the species with 77
restricted ranges that have been the main focus of previous studies3,10. These projected losses 78
are not offset by the very small percentage of species projected to gain more than 50% of 79
their climatic range with realistic dispersal rates (4% of the animals and none of the plants) 80
(Supplementary Table S3) indicating that on balance the projected impacts of climate change 81
overwhelmingly result in a sizable reduction of climatically suitable ranges for a large 82
number of species. 83
With mitigation (i.e., global emissions peak in 2016-2030 and are subsequently 84
reduced by 2-5% annually; Fig. 1, Table 1), median global annual mean temperature rise is 85
limited to 2.0-2.8°C with a 7-45% likelihood that it will be constrained to 2°C above pre-86
industrial levels. The highest emission reduction rates considered in most integrated 87
modelling studies which attempt to minimise mitigation cost is typically between 3 and 4%11, 88
whilst other studies highlight that for an additional cost slightly higher rates of up to 5% may 89
be achievable12. Hence the most stringent mitigation scenario considered here allows global 90
emissions to peak in 2016 and to be subsequently reduced by 5% annually (Fig. 1, Table 1). 91
In this scenario, with realistic dispersal rates, the proportion of species losing at least half 92
their climatic range by the 2080s falls from 34±7% to 13±3% in animals, and from 57±6% to 93
23±4% in plants (Table 1), thus avoiding ~60% of the potential impacts with smaller benefits 94
5 and are then reduced at 5% annually, cumulative emissions during the 21st century rise 96
correspondingly. In this case, substantially fewer climatic range contractions are avoided 97
(Table 1, Fig. 2). With these mitigation delays, the proportion of animals losing at least half 98
their climatic range rises from 13±3% to 20±6%, and the proportion of plants rises from 99
23±4% to 35±6% with realistic dispersal (Table 1, Fig. 2), thus reducing climatic range losses 100
by only ~40% relative to the baseline. 101
These patterns and trends are also observed in the individual animal taxa (Fig. 2), 102
under all dispersal scenarios (Supplementary Fig. S2a-f), as well as in the proportions of 103
species losing >=70%, >=90% or >=99% of their climatic ranges (Supplementary Table S4a-104
c). Plants, amphibians and reptiles would be expected to be more at risk from climate change 105
due to their lower long-term dispersal rates relative to the velocity of climate change13. 106
Consistent with Lawler et al.13, our projections suggest that amphibians are most at risk from 107
climate change, with 50±7% of species losing over 50% of their climatic range under a 108
realistic dispersal scenario, dropping to 28±7% with stringent mitigation. Our analysis 109
revealed that in all taxa, distributions were on average more strongly driven by temperature 110
than by precipitation, although many species are more strongly affected by precipitation 111
(Supplementary Table S2a-c). 112
Corresponding, but smaller, increases in the proportions of species losing larger 113
percentages of their climatic range were also seen. Our estimates of the proportion of species 114
losing more than 90% of their climatic ranges (for example 2-6% of animals with realistic 115
dispersal rates; Supplementary Fig. S2, Supplementary Table S4b) largely omit more 116
restricted-range species that have previously been shown to be highly vulnerable to climate 117
change. Our focus on widespread species makes our figures much lower, and not comparable 118
to, previous estimates of climate-change induced commitment to extinction3,14. However, all 119
6 number of species incurring these large climatic range losses (Supplementary Table S4a-c), 121
for all categories (ranging from ≥50% to ≥99% loss), for all long-term dispersal scenarios, 122
and for all taxa. 123
The impacts of climate change and benefits of stringent mitigation action are not 124
geographically uniform (Fig. 3a,b). With no mitigation, the climate becomes particularly 125
unsuitable for both plants and animals in Sub-Saharan Africa, Central America, Amazonia, 126
and Australia. Major loss of plant species is also projected for North Africa, Central Asia, and 127
Southeastern Europe. We used the number of species from our study with suitable climate 128
predicted in each grid cell as an indicator of species richness. With stringent mitigation, 129
species richness in many of the affected areas shown in figure 3a,b is less impacted (i.e., 130
more preserved) (Fig. 3c,d). Benefits (Fig. 3e,f) are particularly strong in Sub-Saharan Africa, 131
Central America, Amazonia, Australia, North Africa, Central Asia, and Southeastern Europe. 132
In areas where species richness is projected to increase, gains are generally below 5%. 133
Corresponding maps for the less stringent mitigation scenarios (i.e., if global emissions peak 134
in 2030) show smaller, but still positive, benefits (Supplementary Fig. S3a-f). In many of 135
these areas, land use changes will be acting synergistically15 with climate-induced 136
autonomous range shifts. 137
In all cases, stringent early mitigation not only reduces the level of risk to the taxa, it 138
also postpones the changes that would otherwise be incurred by the late 2030s to the 2080s, 139
thus ‘buying’ approximately four decades of time for autonomous or planned adaptation (Fig. 140
2a, blue dashed arrow). More generally, levels of adaptation required to adapt to a 141
temperature rise of 2ºC above pre-industrial levels could be required before 2050 if there is 142
no mitigation (Fig. 1b), whereas with stringent mitigation these levels are not required until 143
the end of the century. Adaptation is further facilitated as the rate of climate change is 144
7 the higher rates of climate change are no longer required. Thus, this type of analysis can help 146
quantify the trade-offs between varying levels of climate change mitigation and adaptation 147
needs. 148
In the more stringent mitigation scenarios in which global emissions peak in 2016, 149
climate change stops increasing by the end of the century (Fig. 1b). In all cases, earlier 150
mitigation results in greater avoidance of range losses (60%), and buys more time for 151
adaptation. Delay in the date at which global emissions peak causes reduced effectiveness 152
even if higher emission reduction rates are implemented subsequent to the peak. Thus, the 153
date of peak emissions is key to the efficacy of mitigation in avoiding the risks to biodiversity. 154
Fee et al.11 use the same methodology as in this study to show that constraining median 155
global temperature rise to 2 ºC if emissions peak in 2016 requires a subsequent emission 156
reduction rate of 3-4%, but if the emission peak is delayed by 5 years, a reduction rate of 6% 157
is required to constrain median temperature rise to 2 ºC. Thus, the date of peak emissions is 158
arguably more important than the overall amount in terms of reduced impacts and the 159
adaptation time that can be ‘bought’. Whist some studies highlight that mitigation rates of up 160
to 5% (as considered here) may be achievable16, mitigation at faster rates is widely 161
considered to be infeasible, and thus the possibility that widespread climate change impacts 162
on biodiversity can be avoided if mitigation is delayed seems remote. 163
In our analyses, all of the patterns were found to be robust, for all animals combined, 164
in separate analyses of mammals, birds, reptiles, amphibians, and plants, and in analyses of 165
individual families. Our method encompassed uncertainties in both climate change 166
projections and in the potential ability of species to disperse to areas that become newly 167
climatically suitable. While some authors caution that these types of studies might 168
overestimate potential impactse.g.,17, our overall estimates of biodiversity diminution at this 169
8 weather events, pests, diseases, and barriers to dispersal, as well as to changes in trophic or 171
mutualistic interactions (see Supplementary Material for discussion). In particular, our 172
estimates for animals will be underestimated due to their dependence on plants. Actual levels 173
of risk in all classes would also be expected to be higher due to the concomitant impacts of 174
other environmental stresses, such as land use change, water and soil contamination, and 175
because extremes associated with increased inter-annual variability3 could constrain rates of 176
dispersal that might otherwise be considered realistic18. Moreover, the rate at which 177
emissions are currently increasing exceeds that in our baseline scenario for the current 178
decade19. 179
In conclusion, our projections indicate that without climate change mitigation, large 180
climatic range contractions can be expected, amounting to a substantial global reduction in 181
biodiversity and ecosystem services by the end of this century. However, prompt, stringent 182
mitigation of greenhouse gas emissions has the potential to avoid the risk of systemic 183
biodiversity diminution of common and widespread species, with concomitant declines in 184
ecosystem services, particularly in Sub-Saharan Africa, the Amazon, Australia, North Africa, 185
Central Asia and Southeastern Europe. With prompt, stringent mitigation, levels of adaptation 186
that would be required by the late 2030s are not required until the 2080s, whereas if 187
mitigation is delayed such that global emissions do not peak until 2030 then substantially 188
fewer risks to biodiversity can be avoided. 189
190
Methods 191
We used greenhouse gas emissions time series, specifically the SRES A1B baseline 192
scenario20 and mitigation scenarios21, to drive a global climate change model 193
9 circulation models which have yet to be run and analysed for stringent mitigation scenarios. 195
In the mitigation scenarios, emissions follow the baseline before transitioning over seven 196
years so that they peak globally in either 2016 or 2030, and are reduced subsequently at rates 197
of between 2 and 5% annually until reaching a lower limit, representing emissions that might 198
be difficult to eliminate. The resultant projections of global temperature change drove a 199
pattern-scaling module ClimGen24,25 in which scaled climate change patterns diagnosed from 200
seven alternative GCM simulations are combined with a baseline climate. Thus we produced 201
42 spatially-explicit time series projections of monthly mean, minimum and maximum 202
temperatures, and total precipitation, downscaled to 0.5°x0.5° and consistent with the IPCC26. 203
This was post-processed to produce 8 bioclimatic indices for our subsequent modelling of 204
species’ current and future climate space27,28. Biodiversity records were sourced from the 205
Global Biodiversity Information Facility (GBIF)29 and vetted for locational reliability (see 206
Supplementary Material). We used MaxEnt27,28 to create statistical relationships between the 207
vetted species occurrence records and current (1961-1990) climate, and to calculate the 208
current geographic distribution of each species27,30. To eliminate potential omission and 209
commission biases, distributions were then ‘clipped’ to the bio-geographic zone(s)31 from 210
which the species information was derived and to a conservative 2000 km buffer around the 211
species’ outermost occurrence records. Next, we used the projected climates and trained 212
models to derive potential future distribution for each species in our future climate scenarios 213
for 30 year periods centered on 2025, 2055 and 2085, applying three class-specific long-term 214
‘dispersal’ rate scenarios (zero, realistic, and optimistic) that were restricted to contiguous 215
land areas. This enabled us to estimate the proportions of species losing ≥50, ≥70, ≥90 or 216
≥99% of their climatically suitable range under the various future climate and dispersal rate 217
scenarios. 218
10 References
220
1 Thomas, C. D. et al. Extinction risk from climate change. Nature 427, 145-148 (2004). 221
2 Malcolm, J. R., Liu, C., Neilson, R. P., Hansen, L. & Hannah, L. E. E. Global warming and extinctions 222
of endemic species from biodiversity hotspots. Conserv Biol 20, 538-548 (2006). 223
3 Fischlin, A. et al. Ecosystems, their properties, goods and services. Climate Change 2007: Impacts, 224
adaptation and vulnerability. Contribution of Working Group II to the Fourth Assessment Report of the 225
Intergovernmental Panel of Climate Change (IPCC). 211-272 (Cambridge University Press, 2007). 226
4 Jetz, W., Wilcove, D. S. & Dobson, A. P. Projected impacts of climate and land-use change on the 227
global diversity of birds. Plos Biol 5, 1211-1219 (2007). 228
5 Sekercioglu, C. H., Schneider, S. H., Fay, J. P. & Loarie, S. R. Climate change, elevational range shifts, 229
and bird extinctions. Conserv Biol 22, 140-150 (2008). 230
6 Thuiller, W. et al. Consequences of climate change on the tree of life in Europe. Nature 470, 531-534 231
(2011). 232
7 Gaston, K. J. & Fuller, R. A. Commonness, population depletion and conservation biology. TREE 23, 233
14-19 (2008). 234
8 Elith, J. et al. A statistical explanation of MaxEnt for ecologists. Diversity Distrib 17, 43-57 (2010). 235
9 Brown, J. H. On the relationship between abundance and distribution of species. Am Nat 124, 255-279 236
(1984). 237
10 Warren, R., Price, J., Fischlin, A., de la Nava Santos, S. & Midgley, G. Increasing impacts of climate 238
change upon ecosystems with increasing global mean temperature rise. Climatic Change 106, 141-177 239
(2011). 240
11 Fee, E. et al. Scientific perspectives after Copenhagen. (European Union, Brussels, 2010). 241
12 den Elzen, M. G. J., van Vuuren, D. P. & van Vliet, J. Postponing emission reductions from 2020 to 242
2030 increases climate risks and long-term costs. Climatic Change 99, 313-320 (2010). 243
13 Lawler, J. J. et al. Projected climate-induced faunal change in the Western Hemisphere. Ecology 90, 244
588-597 (2009). 245
14 Secretariat of the Convention on Biological Diversity. Connecting biodiversity and climate change 246
mitigation and adaptation: Report of the second ad hoc technical expert group on biodiversity and 247
climate change. 126pp (Montreal, 2009). 248
11 16 Climate Change Committee. Building a low-carbon economy: The UK's contribution to tackling 250
climate change. (London, 2008). 251
17 Dormann, C. F. Promising the future? Global change projections of species distributions. Basic and 252
Applied Ecology 8, 387-397 (2007). 253
18 Early, R. & Sax, D. F. Analysis of climate paths reveals potential limitations on species range shifts. 254
Ecol Lett 14, 1125-1133 (2011). 255
19 Peters, G. P. et al. Rapid growth in CO2 emissions after the 2008-2009 global financial crisis. Nature 256
Clim. Change 2, 2-4 (2012). 257
20 Nakicenovic, N. et al. Special report on emissions scenarios (SRES). (Working Group III of the 258
Intergovernmental Panel on Climate Change, 2000). 259
21 Gohar, L. K. & Lowe, J. A. Summary of the emissions mitigation scenarios: part 1. (Summary of the 260
emissions mitigation scenarios: part 1, 2009). 261
22 Wigley, T. M. L. & Raper, S. C. B. Interpretation of high projections for global-mean warming. 262
Science 293, 451-454 (2001). 263
23 Lowe, J. A. et al. How difficult is it to recover from dangerous levels of global warming? Environ Res 264
Lett 4, 014012 (2009). 265
24 Osborn, T. J. A user guide for ClimGen: a flexible tool for generating monthly climate data sets and 266
scenarios. 19 (Climatic Research Unit, University of East Anglia, Norwich, 2009). 267
25 Warren, R. et al. Development and illustrative outputs of the Community Integrated Assessment 268
System (CIAS), a multi-institutional modular integrated assessment approach for modelling climate 269
change. Environ Modell Softw 23, 592-610 (2008). 270
26 PCMDI. IPCC model output, <http://www.pcmdi.llnl.gov/ipcc/about_ipcc.php> (26 September 2009). 271
27 Phillips, S. J., Anderson, R. P. & Schapire, R. E. Maximum entropy modeling of species geographic 272
distributions. Ecol Model 190, 231-259 (2006). 273
28 Ramirez-Villegas, J. & Bueno-Cabrera, A. Working with climate data and niche modeling I. Creation 274
of bioclimatic variables (International Center for Tropical Agriculture (CIAT), Cali, Colombia, 2009). 275
29 Global Biodiversity Information Facility (GBIF). <http://data.gbif.org/ > (April 16, 2010). 276
30 Phillips, S. J. & Dudik, M. Modeling of species distributions with Maxent: new extensions and a 277
12 31 Olson, D. M. et al. Terrestrial ecoregions of the worlds: A new map of life on Earth. Bioscience 51, 279
933-938 (2001). 280
281
Acknowledgments 282
We thank the Met Office Hadley Centre and the UK Department of Energy and Climate 283
Change for use of the emission scenarios produced for the AVOID project. We also thank the 284
Global Biodiversity Information Facility (GBIF), in particular Dr. Tim Robertson, for the 285
support provided during the completion of the analyses presented here. A portion of the 286
funding for the Wallace Initiative came from a grant from the MacArthur Foundation to 287
World Wildlife Fund, U.S. We wish to acknowledge Dr. Sarah Raper’s contribution to the 288
production of the probabilistic climate model. We thank Marianne Brown at James Cook 289
University for technical assistance. J.W. was funded, in part, by ARC Discovery Grant 290
DP110104186. J.R. and A.J. were partly funded by the CGIAR Research Program on Climate 291
Change, Agriculture and Food Security (CCAFS). 292
293
Author contributions 294
J.P. assembled the team, coordinated and advised. R.W. generated and provided the climate 295
projections in collaboration with T.O. and J.L. T.R. provided and J.R. cleaned and processed 296
the GBIF data. R.W., J.V., J.P., L.S., A.J. and S.W. designed the model experiments. J.V. 297
performed the model experiments and analysis. R.W., J.W., J.V. and J.P., wrote the paper. 298
I.A. facilitated and advised on computational issues surrounding modelling and data storage. 299
300
13 Reprints and permissions information is available at www.nature.com/reprints.
302
Correspondence and requests for materials should be addressed to R.W. 303
([email protected]). 304
305
Competing financial interests 306
14 Figure Legends
308 309
Figure 1 Global greenhouse emissions (a) and projected annual global mean near-surface 310
temperature rise in the AVOID scenarios (b). Solid lines refer to median temperature rise, 311
whilst shaded bars provide a 10-90% range (see Supplementary Material for details). (Key to 312
mitigation scenario names: A1B- xxxx-y-z where ‘xxxx’ refers to the year during which 313
global greenhouse gas emissions peak, ‘y’ refers to the rate (%/year) at which emissions 314
subsequently decline, and ‘z’ refers to whether the final emissions floor level is set to high 315
(H) or low (L). 316
317
Figure 2 Proportion of species losing ≥50% of their range by the 2080s with realistic 318
dispersal, under the baseline scenario (red), and in the mitigation scenarios with emissions 319
peaking in 2030 (green) or 2016 (blue), respectively, for (a) plants (b) animals (c) 320
amphibians (d) birds, (e) mammals and (f) amphibians. The shaded areas show the 321
uncertainties arising from use of a range of GCM patterns for creating downscaled climate 322
projections, as well as over the use of two (green) or three (blue) different mitigation 323
scenarios. Red lines show trends for emission pathway SRES A1B without mitigation, whilst 324
green and blue pathways show those with mitigation in which global greenhouse gas 325
emissions peak in 2030 and in 2016, respectively. The corresponding green and blue dashed 326
arrows in (a) show the adaptation time ‘bought’ in the AVOID2030 and the AVOID2016 327
scenarios (2038 to 2080 and 2048 to 2080, respectively); the dashed arrows are represented 328
by * and *’ in (b-f). 329
15 Figure 3 Species richness of animal (a, c) and plant (b, d) species in the 2080s under realistic 331
dispersal for the stringent mitigation case in which global greenhouse gas emissions peak in 332
2016 and are subsequently reduced at 5% annually (c, d) compared with the no mitigation 333
case SRES A1B (a, b). Panels (e, f) show the species richness change that is avoided by such 334
mitigation. White areas are those where no data exist in the GBIF network. Species richness 335
gains occur only on the edges of these white areas, where it is an artefact of data paucity, and 336
hence is not shown. 337
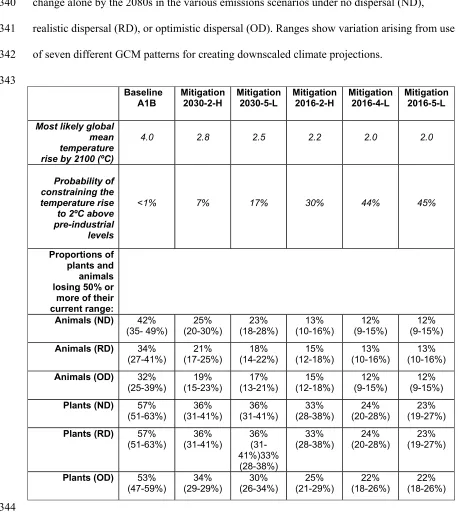
16 Table 1 Proportions of plants and animals losing ≥50% of their current range due to climate 339
change alone by the 2080s in the various emissions scenarios under no dispersal (ND), 340
realistic dispersal (RD), or optimistic dispersal (OD). Ranges show variation arising from use 341
of seven different GCM patterns for creating downscaled climate projections. 342
343
Baseline
A1B Mitigation2030-2-H Mitigation2030-5-L Mitigation2016-2-H Mitigation 2016-4-L Mitigation2016-5-L
Most likely global mean temperature rise by 2100 (ºC)
4.0 2.8 2.5 2.2 2.0 2.0
Probability of constraining the temperature rise to 2ºC above pre-industrial
levels
<1% 7% 17% 30% 44% 45%
Proportions of plants and animals losing 50% or
more of their current range:
Animals (ND) 42%
(35- 49%) (20-30%) 25% (18-28%) 23% (10-16%) 13% (9-15%) 12% (9-15%) 12%
Animals (RD) 34%
(27-41%)
21% (17-25%)
18% (14-22%)
15% (12-18%)
13% (10-16%)
13% (10-16%)
Animals (OD) 32%
(25-39%) (15-23%) 19% (13-21%) 17% (12-18%) 15% (9-15%) 12% (9-15%) 12%
Plants (ND) 57%
(51-63%)
36% (31-41%)
36% (31-41%)
33% (28-38%)
24% (20-28%)
23% (19-27%)
Plants (RD) 57%
(51-63%) (31-41%) 36% 36% (31-41%)33%
(28-38%)
33%
(28-38%) (20-28%) 24% (19-27%) 23%
Plants (OD) 53%
Year
Emissions (GtCeq yr
−
1 )
0
4
8
12
16
20
2000 2020 2040 2060 2080 2100
a)
A1B
A1B_2030_2_H A1B_2030_5_L A1B_2016_2_H A1B_2016_4_L A1B_2016_5_L
Year
Global temper
ature change (
o C)
012345
2000 2020 2040 2060 2080 2100
Propor
tion of species
0.0 0.1 0.2 0.3 0.4 0.5 0.6
2020 2050 2080
● ● ● ● ● ● ● ● ● ● ● ● ● ● ● ● ● ●
a) Plant
0.0 0.1 0.2 0.3 0.4 0.5 0.62020 2050 2080
● ● ● ● ● ● ● ● ● ● ● ● ● ● ● ● ● ●
b) Animal
Proportion of species
0.0 0.1 0.2 0.3 0.4 0.5 0.6
2020 2050 2080
● ● ● ● ● ● ● ● ● ● ● ● ● ● ● ● ● ●
c) Amphibia
0.0 0.1 0.2 0.3 0.4 0.5 0.62020 2050 2080
● ● ● ● ● ● ● ● ● ● ● ● ● ● ● ● ● ●
d) Aves
Year Proportion of species
0.0 0.1 0.2 0.3 0.4 0.5 0.6
2020 2050 2080
● ● ● ● ● ● ● ● ● ● ● ● ● ● ● ● ● ●
e) Mammalia
Year 0.0 0.1 0.2 0.3 0.4 0.5 0.62020 2050 2080
SRES A1B
Animals
a.
0% >100% Richness
b.
Plants
A
V
OID (A1B_A16r5l)
c. d.
Diff
erence (%)
<0% >40% Avoided loss