Investigating the structure of biomass-derived non-graphitising
mesoporous carbons by electron energy loss spectroscopy in the
transmission electron microscope and X-ray photoelectron
spectroscopy
A.S. Marriott 1,2,3 , A.J. Hunt 1,2, E. Bergström 1,3, K. Wilson 4, V.L. Budarin 1,2, J. Thomas-Oates 1,3, J. H. Clark 1, 2, R. Brydson 5
1
Department of Chemistry, 2 Green Chemistry Centre of Excellence, 3 Centre of Excellence in Mass Spectrometry, University of York, York YO10 5DD, UK,
4
School of Chemistry, Cardiff University, Cardiff, UK,
5
Institute for Materials Research, School of Process, Environmental and Materials Engineering (SPEME), University of Leeds, Leeds LS2 9JT, UK
Abstract
We have investigated the microstructure and bonding of two biomass-based porous carbon
chromatographic stationary phase materials (alginic acid-derived Starbon® and calcium
alginate-derived mesoporous carbon spheres (AMCS)) and a commercial porous graphitic
carbon (PGC), using high resolution transmission electron microscopy, electron energy loss
spectroscopy (EELS), N2 porosimetry and X-ray photoelectron spectroscopy (XPS). The
planar carbon sp2-content of all three material types is similar to that of traditional non-graphitising carbon although, both biomass-based carbon types contain a greater percentage
of fullerene character (i.e curved graphene sheets) than a non-graphitising carbon pyrolysed at
the same temperature. This is thought to arise during the pyrolytic breakdown of hexauronic
acid residues into C5 intermediates. Energy dispersive X-ray and XPS analysis reveals a
homogeneous distribution of calcium in the AMCS and a calcium catalysis mechanism is
discussed. That both Starbon® and AMCS, with high-fullerene character, show
chromatographic properties similar to those of a commercial PGC material with extended
graphitic stacks, suggests that, for separations at the molecular level, curved fullerene-like and
planar graphitic sheets are equivalent in PGC chromatography. In addition, variation in the
r.m.drummond-number of graphitic layers suggests that stack depth has minimal effect on the retention
mechanism in PGC chromatography.
1. Introduction
Porous graphitic carbons (PGC) are attracting increasing interest for applications such as
catalysis [1] and [2], adsorption [3], and energy storage [4] and [5]. In particular, PGC has
attracted significant interest over the past decades as a liquid chromatography (LC) stationary
phase, owing to its unique mechanism of separation of polar compounds under mass
spectrometry-compatible reversed-phase conditions, as well as its capacity to function over
the entire pH range[3], [6], [7] and [8]. PGC compares favourably with the widely adopted
standard reversed-phase, chemically bonded but less stable silica columns, which are unable
to retain polar compounds.
Over the last few years, the preparation of mesoporous carbonaceous material via thermal
decomposition of expanded starch (which has been commercialised as Starbon®) has been
developed [9] and [10]. A second generation Starbon® prepared from the algal polysaccharide
alginic acid (termed Starbon® AXXX, where “XXX” refers to the temperature of pyrolysis)
has been shown to be effective in the LC separation of low mass carbohydrates [11], with
retention comparable to that on a commercial PGC column [12]. Synthesis of alginic
acid-derived Starbon® involves the expansion of an alginic acid hydrogel in water, followed by
solvent exchange with ethanol and supercritical CO2 drying to produce an aerogel precursor,
which is then subjected to pyrolysis at up to 1000 oC under an inert atmosphere. Although
attempts have been made to understand the carbon species present in these materials, the
characterisation techniques used have been of an indirect nature, enabling only the description
that the materials show extended aromaticity. Thus there is a need to adopt methods which
that in an alginic acid-derived Starbon®-material, in order to understand why alginic
acid-derived Starbon® shows retention similar to that on PGC. The purpose of this paper is
therefore to shed light on the microstructure and chemical composition of alginic acid-derived
Starbon®, applying transmission electron microscopy (TEM) imaging and diffraction
techniques combined with compositional analysis using energy-dispersive X-ray (EDX) and
electron energy loss (EELS) spectroscopy together with a semi-quantitative analysis of the
EELS carbon K-edge, for the extraction of both the fraction of sp2-bonded carbon atoms and the degree of fullerene character [13]. This data has been directly compared with similar data
for a commercial PGC material. Two alginic acid-derived Starbon® samples were studied: one
had been pyrolysed to 1000 oC (Starbon® A1000) and the other to 800 oC (Starbon® A800).
These samples represent respectively materials prepared using the same pyrolysis temperature
as White et al. [11]and the pyrolysis temperature more recently favoured for the preparation
of Starbon® material [14].
Coupled to this, recent work aimed at improving the morphology of alginic acid-derived
Starbon® particles for the purposes of packing chromatographic columns has led to the
development of calcium alginate mesoporous carbon microspheres (AMCS), which are also
pyrolysed to 800 oC under an inert atmosphere [15]. This research has highlighted the effect
that calcium ions play in the structural properties of AMCS, where microporosity of the
material was observed to increase as calcium levels decreased. To date, no analysis of the
effect of calcium removal on the microstructure of these materials has been attempted. This
paper therefore also attempts to analyse the nanostructure and chemical composition of two
different AMCS samples; a unwashed sample (AMCS-NW; the sample has not undergone an
acid-wash step to remove bound calcium ions), and a washed sample (AMCS-W; the sample
and the alginic acid-derived Starbon® materials whose morphology they have been designed
to improve upon, as well as to study the effect that elevated calcium levels may have on the
carbonisation of AMCS during pyrolysis.
2. Experimental
2.1. Chemicals
Alginic acid from brown algae and sodium alginate were purchased from Sigma (Poole, UK).
Commercial PGC was purchased from Hypersil (Runcorn, UK). Calcium chloride and all
solvents were purchased from Fisher (Fisher Scientific, Loughborough, UK).
2.2. Alginic acid-derived Starbon® precursor synthesis
Alginic acid from brown algae (Sigma) was gelatinised in distilled water: a suspension of the
polysaccharide (1 g in 20 mL water) was stirred for two hours at 90 οC. Retrogradation
(whereby the polysaccharide chains realign themselves) by storing the solution at 5 οC for 24
h was performed in order to strengthen the resulting hydrogel. The water was exchanged for
ethanol and the resulting alcogel dried in supercritical CO2 (scCO2). Drying was conducted
using a Thar SFE-500 supercritical extractor heated to 40 οC and held at a pressure of 120 Bar
for 2 h under dynamic flow conditions (40 g min-1 CO2). The extractor was subsequently
allowed to depressurise over a period of 12 h.
2.3. Preparation of AMCS precursor
Sodium alginate (Sigma-Aldrich) was mixed in deionised water (1 g in 50 mL water) to
produce a viscous solution. The solution was passed through an electrospray ionization
emitter source that had been detached from the mass spectrometer, at a flow rate of 1 mL/min
using a constametric 3200 solvent delivery system (LDC Analytical). The solution was
and cured in solution for 24 h to prepare hydrogel spheres of calcium alginate. The hydrogel
spheres were transferred into deionised water and washed. At this stage, the AMCS-W sample
spheres were acid-washed using hydrochloric acid (0.1 M or 0.5 M), as required, to reduce the
calcium content of the material. The removal of water was performed by solvent exchange
with ethanol (a lower surface tension solvent) using a method reported previously (Robitzer et
al.) [16]. The excess solvent was removed from the resulting alcogel by Buchner filtration
before the material was dried by scCO2. The drying was performed using a Thar SFE-500
supercritical extractor heated to 40 °C at a pressure of 120 Bar for 4 h under dynamic flow
conditions (40 g min-1 CO2). The extractor was depressurized slowly over 12 h.
2.4. Preparation of carbonaceous alginic acid-derivedStarbon®/AMCS material
Starbon® and AMCS precursors were pyrolysed by heating under a N2 atmosphere (N2 flow:
150 mL min-1, BOC) in a ceramic furnace which contained a quartz round bottomed flask. All
samples were pyrolysed to either 800 °C (Starbon® A800, AMCS-NW and AMCS-W) or
1000 °C (Starbon® A1000) at a rate of 1 K min-1 followed by a hold of 20 min.
2.5.N2 sorption porosimetry
N2 porosimetry was performed on a Micromeritics Tristar volumetric apparatus at 77 K. The
samples were outgassed at 160 °C for 8 h under atmospheric pressure before analysis.
2.6. Transmission electron microscopy (TEM)
TEM characterisation was carried out with a FEI Supertwin CM200 thermally assisted field
emission gun transmission electron microscope operated at 197 keV (point resolution 0.24
nm) equipped with an ultra thin window Oxford Instruments energy dispersive X-ray (EDX)
prepared by grinding and ultrasonically dispersing the powders in methanol, one drop of the
dispersion was deposited onto a copper grid (400 mesh) covered by a holey carbon-coated
film (Agar Scientific), and the sample was dried in air for about 15-20 minutes. All EELS
spectra were collected in diffraction mode from areas some 180 nm in diameter; core loss
spectra were all collected using ‘magic’ collection angle conditions for which spectra are
crystallographically orientation independent [17]. Carbon K-edge spectra were processed and
fitted using the Digital Micrograph software package (Gatan). Fitting and analysis of the
EELS carbon K-edge was performed using the approach described by Zhang et al. [13].
2.7. X-ray photoelectron spectroscopy
X-ray photoelectron spectroscopy (XPS) were performed on a Kratos AXIS HSi X-ray
photoelectron spectrometer equipped with a monochromatic Mg K X-ray source (energy
1253.6 eV) and a charge neutralisation gun. Spectra were recorded at an analyzer pass energy
of 20 eV. Spectra were energy referenced to the C 1s photoelectron peak at 284.6 eV, with
quantification performed using CASA-XPS 2.3.15 following Shirley background subtraction.
Sensitivity factors for C 1s (0.318), Ca 2p (1.95), N 1s (0.505) and O 1s (0.736) were used to
correct the signal intensities and quantify the surface composition. Peak fitting for Ca and
carbohydrate features was performed using a 30:70 Gaussian-Lorentzian peak shape, whilst
deconvolution of graphitic-like sample data required an asymmetric Doniach Sunjic line
shape. Spectra were fitted with the minimum number of components required to provide a
good envelope, with full width half maxima (FWHM) kept fixed within each class of
material. Typical FWHM values were 1.5-1.7 eV for Ca 2p; while for the C 1s, FWHM were
2.5 eV for the AMCS and Starbon® precursors and 1.5 eV for the pyrolysed products. Binding
energies for components were chosen using reference data from the NIST XPS database [18].
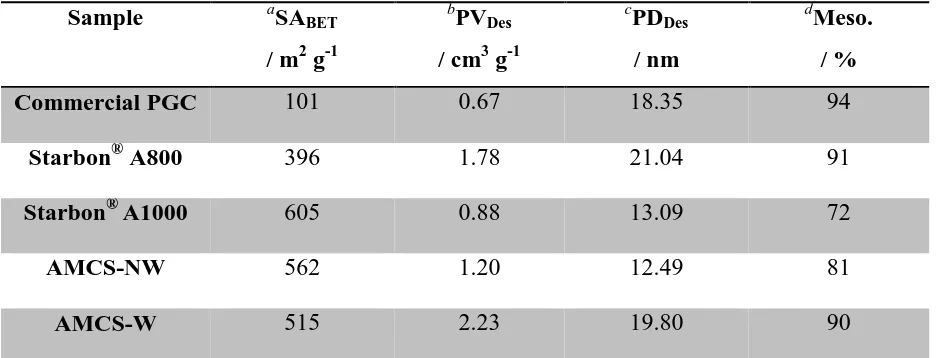
3.1: N2 sorption porosimetry
Table 1 summarises the surface area and pore structure characteristics of the samples as
determined by N2 sorption porosimetry. All samples are predominantly mesoporous, with the
commercial PGC material having the highest mesopore content at 94 %. Pore diameter is well
within the mesopore range for all samples, although the commercial PGC material had a
narrower pore size distribution (not shown). This is to be expected, as this material is
synthesised using a hard-templating route, for which a template of a specified pore size is
used [3].
Sample aSABET / m2 g-1
b PVDes / cm3 g-1
c PDDes / nm d Meso. / %
Commercial PGC 101 0.67 18.35 94
Starbon® A800 396 1.78 21.04 91
Starbon®A1000 605 0.88 13.09 72
AMCS-NW 562 1.20 12.49 81
AMCS-W 515 2.23 19.80 90
[image:7.595.65.534.291.470.2]a = BET surface area; b = BJH desorption pore volume; c = BJH desorption pore diameter; d = Percentage mesoporosity
Table 1: N2 sorption data for commercial PGC, AMCS and Starbon® samples
The alginic acid-based samples have greater surface area than the commercial PGC material
as well as larger pore volumes, although there is significant variation among these samples.
The porosity of the alginic acid-based carbons is derived from the porous expanded
polysaccharide framework created during the synthesis gelling process, a so-called
"natural-template". Although not as strong as a hard-template (e.g. a silica bead), the synthesis has
been developed to retain this framework throughout the synthesis without causing extensive
structural collapse. However, the porous polysaccharide framework is susceptible to heat
3.2: Transmission electron microscopy (TEM)
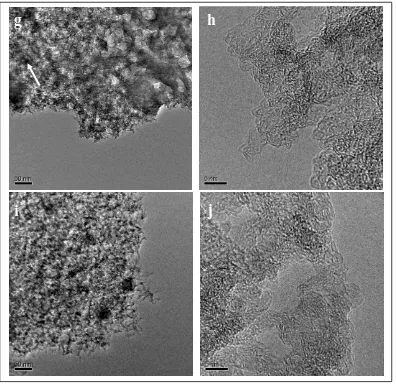
3.2.1: High resolution TEM
Figure 1 shows high resolution transmission electron micrographs of: commercial PGC
(Figure 1(a) and (b)); Starbon® A800 (Figure 1(c) and (d)); Starbon® A1000 (Figure 1(e) and
(f)); AMCS-NW (Figure1(g) and (h)) and AMCS-W (Figure 1(i) and (j)). These images are
representative of the microstructures observed within these materials at both low and high
magnifications.
Commercial PGC exhibits a high proportion of disordered, closed loop structures of graphitic
layer stacks exhibiting both rounded (i.e smooth) curvature and also very angular curvature
(Figure 1 (a) and (b)). The graphitic stacks (consisting of (002) planes) are ca. 1-2 nm thick (3
to 6 graphene layers) and display a range of widths varying between 5 and15 nm. Low
magnification micrographs (Figure 1(a)) show the enclosed pore structure but also reveal that
no long-range order graphitization exists at the macroscopic scale. These images are
consistent with those reported by Zhang et al. [13] for non-graphitising carbons pyrolysed
above 2000 οC. This agrees also with the literature describing PGC synthesis, in which
phenolic carbonising resins are pyrolysed at temperatures in excess of 2000 οC in order to
reduce the micropore content [3]. Interestingly, there is also evidence of smaller, quasi-flat
but highly-aligned carbon layers which appear similar to those described by Harris et al. for
low temperature-pyrolysed graphitizing microporous carbons, derived from anthracene [19].
In the Starbon® A800 sample, there is only minimal ordering of (002) graphitic planes, limited
to 2-3 aligned layers at most (Figure 1(c)). A high degree of rounded layer curvature is also
evident, which indicates a large degree of fullerene-like character (i.e. the presence of carbon
closed-loop structure. At low magnification the material appears particulate in nature and the
images show the porous, irregular-shaped nature of the alginic acid-derived Starbon®
materials.
For Starbon® A1000, the regions sampled at low magnification (Figure 1(e)) display the same
particulate microstructure and pore structure as observed for Starbon® A800. However, at
higher magnification (Figure 1(f)), the fullerene-like character is more obvious with more
distinct loop structures apparent, which exhibit slightly thicker stacks (between 3-5 graphene
layers). Based on the observations at high magnification of short range graphitic order and
limited graphite stacking, Starbon® A1000 appears to closely resemble a non-graphitising
carbon pyrolysed to 1000 οC as described in the paper of Zhang et al. [13].
With regards to the AMCS samples, the carbon microstructures (Figures 1(h) and 1(j)) show
extensive fullerene-like character with a high degree of smooth curvature, which is also found
to enclose a more open network of pores. There is evidence for the presence of closed-loop
structures in both samples, although the washed sample revealed slightly thicker layer packets
(4-5 graphene layers), which were less obvious in the AMCS-NW material. However, it is at
low magnification where the differences are clearer between the AMCS samples. Both
samples differ from alginic acid-derived Starbon® in that the structure is less an
agglomeration of particulates and appears to be a more expanded carbon-based material; in
particular, Figure 1(g) gives evidence for an extended open mesopore structure. Both AMCS
materials show a high degree of mesoporosity, together with distinct, dense nanoparticulate
regions (observed as dark areas, due to mass-thickness contrast in TEM bright field images);
for AMCS-W, these nanoparticulate regions are homogeneously distributed throughout the
material, whereas for AMCS-NW this homogeneous distribution is interspersed with
diffraction, and which appear very dark in TEM bright field images due to diffraction
contrast). EDX spectroscopic analysis of these samples in the TEM indicates a higher
percentage of calcium in these regions of high density than in the more open (less dense)
regions, suggesting that these nanoparticles are predominantly a calcium species. The
chemical nature of these nanoparticles and crystals were investigated by XPS and are
discussed below (see Section 3.3).
Figure 1: High resolution TEM images of commercial PGC at a) low and b) high magnification; Starbon® A800 at c) low and d) high magnification; Starbon® A1000 e) low and f) high magnification; AMCS-NW g) low and h) high magnification and AMCS-W i) low and j) high magnification. The white arrow in figure 1(g) highlights a region of crystalline calcium.
c
d
e
f
[image:11.595.104.492.67.587.2]Figure 1: (continued)
It is clear that there are significant differences between the microstructures of the commercial
PGC, alginic acid-derived Starbon® and AMCS materials. This makes the fact that they
exhibit such similar properties in terms of chromatographic separation all the more
interesting. In order to understand further the nature of the carbon environments present in
these materials, core loss EELS data were collected at the carbon K-edge, which relates to
transitions from the carbon 1s core level to empty p-like final states above the Fermi level.
Analysis of the carbon K-edge using the procedure described by Zhang et al. [13]is used to
gain semi-quantitative information on the level of carbon sp2 bonding from the relative intensity of the π* transition at 285 eV, and on the degree of fullerene character from the
relative intensity of the residual peak at 287/287.5 eV.
i
j
[image:12.595.102.498.69.454.2]3.2.2: Core loss EELS
Representative EELS plots fitted at the carbon K-edge for Starbon® A800 and commercial
PGC are shown in Figure 2 (a and b respectively). The percentage sp2 content and percentage fullerene character data derived from these fitted plots using the procedure described by
Zhang et al.13 for all the samples are summarised in Table 2. The paper by Zhang et al
describes the procedure for the extraction of the concept of “fullerene content”. Essentially
this is the relative intensity of the residual peak centred at ca. 287 eV following a three
Gaussian fit to the carbon K-edge. In practice, this peak is intensity is normalised to the total
C K-edge intensity (integrated over a 20 eV window) – the latter giving a measure of the total
number of carbon atoms in the analysed volume. This relative residual peak intensity is then
corrected by the baseline relative peak intensity in this region observed in a 100% planar sp2
reference material such as fully crystalline graphite (i.e. this is subtracted from the measured
value). Finally the concept of “fullerene content” is achieved by normalising this ratio is to
the corresponding ratio obtained from crystalline C60. In principle this normalised intensity
ratio should reflect the degree of non-planar sp2-bonded carbon character relative to a perfect
fullerene unit (some authors have termed this sp2+d character) – provided no other factors are
contributing to this intensity such as carbon bonded to heteroatoms, the majority of which are
Figure 2: Fitted EELS plots at the carbon K-edge for a) Starbon® A800 and b) commercial PGC
The commercial PGC material exhibits an sp2 content of greater than 90 %, which is expected, given the propensity of highly aligned graphitic layers in this material, and reveals a
percentage fullerene content of around 30 %. This data appears to correlate with the evidence
provided by the TEM images. This material shows similar though slightly lower values when
compared with a phenolic resin-derived, non-graphitising carbon pyrolysed to 2500 οC
investigated by Zhang et al. – that exhibited percentages of ca. 98 % carbon sp2 content and
35 % fullerene character respectively [13].
a
[image:14.595.72.509.69.469.2]Sample Percentage sp2 content / %
Percentage fullerene character /%
Commercial PGC 90 ± 4 30 ± 1
Starbon® A800 72 ± 2 66 ± 12
Starbon®A1000 87 ± 7 55 ± 16
AMCS-NW 76 ± 3 53 ± 5
AMCS-W 82 ± 4 57 ± 6
Table 2: Summary of core loss EELS data for all commercial PGC, AMCS and Starbon® samples. Errors represent the standard deviation of analysis from at least three different sample regions.
Starbon® A800 shows a lower sp2 content (of 72 %) than that observed in a corresponding phenolic resin-derived, non-graphitising carbon pyrolysed at the same temperature of 800 οC
(ca. 84 %) [13]. Meanwhile Starbon® A1000 shows a carbon sp2 content similar to that seen in a comparative, non-graphitising carbon pyrolysed at 1000 οC (87 % and 92 % respectively
[13]). However, both Starbon® A800 and Starbon® A1000 samples show significantly higher
levels of fullerene character compared to the standard phenolic resin-derived,
non-graphitising carbons, with 66 % and 55 % compared to 47 % and 26 % for materials
pyrolysed to 800 οC and 1000 οC respectively. The AMCS samples show similar values to the
Starbon® materials, with fullerene character calculated to be in the range 50 – 60 %.
A recent study by Powles et al. [20] reported the use of molecular-dynamics simulations to
describe how self-assembled sp2-bonded carbon structures, like fullerenes, could arise from highly disordered amorphous precursors. They found that two key factors affected the
[image:15.595.65.534.71.253.2]Initially considering this second factor, the materials in our work can be considered
low-density bulk carbons and afford a greater void fraction than higher-low-density carbons e.g.
annealed carbons. The simulated study by Powles et al. yielded a hypothetical highly curved
sp2 sheet model for low-density bulk carbons which was similar to that put forward by Harris
et al. to describe the fullerene-like character of non-graphitizing microporous carbons, on the
basis of TEM observations [21].
Meanwhile the geometry of the precursor system before pyrolysis is that of a linear
polyuronide polymer consisting of two hexuronic acid residues: β-D-mannuronic acid and
α-L-guluronic acid. A recent study by Ross et al. reported the volatile products released by
alginic acid and its calcium and sodium alginate salts during pyrolysis [22]. The study found
that, for alginic acid and calcium alginate, the major volatile component released was furfural,
along with smaller quantities of various cyclopentenones. Potentially, the C5 intermediates
formed by modification of the hexuronic acid units during the generation of these volatiles
may therefore act as the nucleation point and template for the growth of the highly fullerene
character observed in our materials.
Further to this, the sp2 content of the AMCS-W sample was found to be higher than that for Starbon® A800 sample, with the AMCS-W sample having sp2 levels that are on a par with those of a standard phenolic resin-derived, non-graphitising carbon. It is therefore possible
that the calcium nanoparticles present throughout these materials may act as nuclei, catalysing
TEM images of the unwashed material are less effective catalysts for fullerene formation than
the more dispersed calcium observed in the washed AMCS sample.
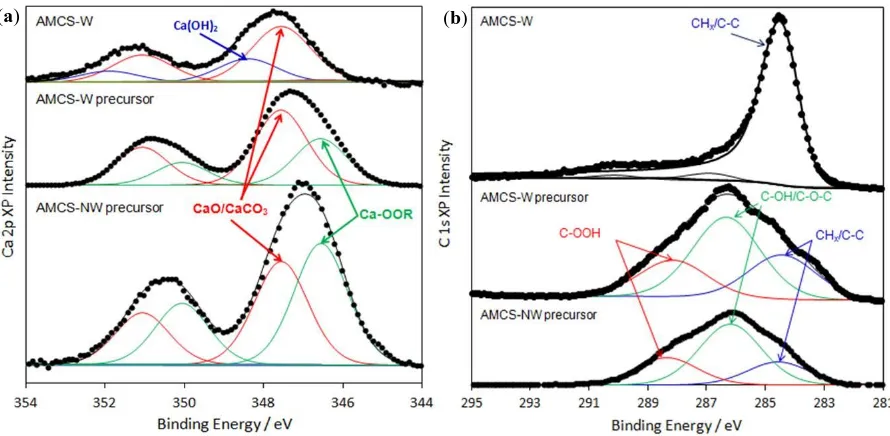
3.3: X-ray photoelectron spectroscopy (XPS)
In order to determine the chemical nature of the calcium present in the alginic acid-derived
Starbon® and AMCS materials, samples were analysed by X-ray photoelectron spectroscopy
(XPS). Figure 3 (a) shows the Ca 2p signal for the expanded precursor of the alginic
acid-derived Starbon® materials, which is composed of a a pair of spin-orbit split doublets, the
2p3/2 and2p1/2 states, with a 2p3/2 binding energy of 346.8 eV, indicative of predominantly
Ca-OOR interactions. The expansion of alginic acid to a hydrogel is described by an ionotropic
gelation process resulting from the binding of Ca2+ ions to areas of poly α-L-guluronic acid
present in the polysaccharide. This leads to the formation of a secondary structure described
by the egg-box model [23] (Figure 4) and these data for the precursor samples are consistent
with this model. We believe the source of the calcium in these materials to be primarily that
incorporated during alginic acid extraction, during which water-soluble sodium alginate is
separated from other polysaccharides present in the algae through gelation with calcium,
followed by filtration of the mixture. Following pyrolysis to 800 οC, features attributed to
Ca-alginate (Ca-OOR) are lost and new states at 347.5 and 348.4 eV emerge, attributed to
Figure 3: XPS analysis of expanded alginic acid-derived Starbon® precursor and pyrolysed to 800 oC (Starbon® A800), in the a) Ca 2p and b) C 1s binding energy regions
The changes in the carbon environment following thermal treatment are shown in Figure 3
(b), which shows the parent alginate is comprised of three components at 284.6 eV (CHx
/C-C), 286.2 eV (COC, C-OH,) and 288.4 eV (COOH) characteristic of the alginate backbone.
The corresponding C 1s photoelectron peak of the pyrolysed material shows that pyrolysis
results in growth of the main peak at 284.5 eV at the expense of the COOH and COH/C-O-C
components. The high degree of asymmetry in the new peak is attributed to a graphitic like
species, having a characteristic sp2 environment. Pyrolysis at 1000°C results in a sharpening of the C 1s spectrum and a further decrease in oxygen content, as evidenced by the increased
C:O ratio in Table 3.
Sample Elemental atomic percentage / % C:O ratio
Na N O Ca C
Starbon® precursor 0.2 0.2 46.0 0.4 53.2 1.2
Starbon® A800 4.5 - 15.9 0.2 79.4 5.0
Starbon® A1000 - 0.4 10.5 0.2 88.9 8.5
AMCS-NW precursor - - 43.5 4.0 52.5 1.21
AMCS-NW 0.3 - 36.4 9.2 54.1 1.48
AMCS-W precursor - - 41.9 1.4 56.7 1.35
[image:19.595.65.528.71.280.2]AMCS-W - - 10.2 2.1 87.7 8.60
Table 3: Surface compositions of Starbon® and AMCS samples
Figure 4: Representation of “egg-box” model binding of α-L-guluronic acid blocks to calcium ions in alginic acid
Figure 5 (a and b) shows the Ca 2p and C 1s spectra, respectively, for the AMCS-NW
precursor and AMCS-NW. In this instance, each of the Ca 2p spin orbit split photoelectron
lines is composed of a clear doublet, having 2p3/2components at 346.8 and 347.5, attributed to
Ca-OOR of alginate and CaO/CaCO3 respectively. Following pyrolysis, the CaO/CaCO3 state
is retained; however the lower binding energy component is lost. There is an overall shift of
the peak envelope to higher binding energy, due to the growth of a new set of doublets with
Ca 2p3/2 centred at 348.4 eV which is attributed to Ca(OH)2. Following pyrolysis, growth of
the CHx/C-C component in the C 1s spectrum occurs at the expense of the C-OH and COOH
O OH OH -OOC O O OH OH -OOC O O O OH OH -OOC O O OH OH -OOC O * * O OH OH -OOC O O OH OH -OOC O O O OH OH -OOC O O OH OH -OOC O * *
[image:19.595.144.459.312.472.2]attributed to a CO3 environment, and is consistent with the presence of a large amount of
CaCO3 as indicated in the Ca 2p spectrum. Powder X-ray diffraction was performed on the
AMCS-NW sample in order to determine the CaCO3 phase type (Fig S1). Comparison of the
sample diffraction pattern with those for CaCO3 recorded on the FIZ Karlsruhe ICSD
suggests that the predominant polymorph is calcite, the pattern strongly correlated to that of
Maslen et al. [24]. The peaks at 2θ = 32.2°, 37.4° and 53.8° could not be assigned although it
is believed that they correspond to a minority crystal phase in this sample.
[image:20.595.110.496.263.460.2]
Figure 5: XPS analysis of AMCS-NW precursor and AMCS-NW, in the a) Ca 2p and b) C 1s
binding energy regions
The effect of acid washing on pyrolysis was also investigated by XPS (Fig 6) which shows
that, while a decrease in Ca content is observed (Table 3), there is no significant change in the
surface carbon functionality (Fig 6b). Following pyrolysis at 800°C, decomposition of the
alginate is observed (as also in Figure 4), with the Ca 2p exhibiting features for Ca(OH)2 and
CaCO3. Inspection of the C 1s now shows a single asymmetric peak for CHx/C-C similar to
that observed for Starbon® A800 and Starbon® A1000. The loss of the peak at 290.4 eV,
which was attributed to a carbonate-derived carbon, is consistent with a decrease in CaCO3 in
the acid washed sample. The loss of CO3 is also manifest in the decreased oxygen content in
the 800 °C pyrolysed sample (Table 3).
Figure 6: XPS analysis of AMCS-W precursor and AMCS-W, in the a) Ca 2p and b) C 1s
binding energy regions
Analysis of the sp2:sp3 components of the Starbon®and AMCS samples was performed (based on fitted C 1s peaks at 284.6 and 286.8 eV respectively) using the procedure described by
Díaz et al. [25] (Table 4). The results are broadly consistent with the deductions from
HRTEM, that Starbon® A1000 contains a higher degree of sp2 character than Starbon® A800, and is comparable with the AMCS-W sample. (N.B. The 286.8 eV peak assigned to the sp3
component overlaps with that for C-OH so any surface oxidation may skew the results.)
Sample asp2:sp3 ratio
Starbon® A800 11.0
Starbon® A1000 22.7
AMCS-NW 13.0
AMCS-W 18.7
[image:21.595.76.521.74.292.2]a = based on 284.6 and 286.8 eV components respectively
Table 4: sp2:sp3 ratio for Starbon® and alginate AMCS samples
[image:21.595.84.512.525.684.2]3.4: Potential mechanism for calcium catalysis
Calcium catalysis of graphitisation processes is discussed widely in the literature, with a
number of the articles describing processes whereby catalytic graphitisation of carbonising
materials has occurred, albeit at high pressures of 3 kbar, where calcium was added. For
example, the acceleration of graphite formation in polyvinyl chloride (PVC) cokes by calcium
carbonate [26], hydroxide [27] and oxide [28], was described in the 1970s and products
characterised by electron microscopy and X-ray diffraction (XRD). However, more recently,
Tsubouchi et al. have described the catalysis of turbostratic graphite formation in several coal
samples by calcium hydroxide under ambient pressures [29].
Two mechanisms of calcium catalysis have been postulated. The first, by Tsubouchi et al.,
describes a reaction by fine particles of CaO with amorphous carbon present in the forming
chars, to produce CO and interstitial calcium carbide/oxide (i.e. CaOαCβ, where α and β are
fractional) intermediates [29]. The breakdown of this interstitial species then releases carbon
in a graphitic form. This mechanism is represented as [29]:
CaO + C(amorphous) CaOαCβ CaOαCγ + Cx (graphitic)
The second mechanism, proposed by Hirano et al., describes an apparently cooperative effect
between calcium carbonate and gaseous nitrogen in catalysing carbon graphitisation via a
calcium cyanamide intermediate [26]:
CaCO3 CaO + CO2
CaO + C (amorphous) Ca + CO
Ca + 2C (amorphous) CaC2
CaC2 + N2 CaCN2 + C (graphitic)
In the case of the data presented in our paper, it is reasoned that the “graphitic” carbon
observed in the alginic acid-derived Starbon® and AMCS materials. Since the carbon
materials in this paper were prepared under a nitrogen atmosphere, it would be reasonable to
assume that if calcium catalysis occurs, it may predominantly progress by the second
mechanism. Indeed, the presence of high levels of calcium carbonate detected in our
pyrolysed materials goes some way to supporting this view. Hirano et al. reported that
graphitic particles were observed in pyrolysed PV-7 PVC by 1000 οC, although the calcium
carbonate infused into their starting material was in the form of “disks 8 mm in diameter and
2.5 mm thick” [26]. It is therefore conceivable that the nanoparticulate nature of the calcium
speciesin the alginic acid-derived Starbon® and AMCS materials described here may enhance
the catalytic effect still further. An earlier study by Hirano et al. reported a positive
correlation between the extent of graphite formation and the distribution and concentration of
calcium found in several specimens of PVC coke [30]. In the case of the unwashed AMCS
material, a large proportion of calcium appears to be tied up in large, crystalline structures; the
calcium is heterogeneously distributed though the sample, and the concentration of calcium
available for catalysis at a particular position is thus lower than that of the unwashed AMCS
material. This could explain why this unwashed AMCS material presented a reduced carbon
sp2 content than the washed AMCS sample.
4. Discussion and conclusions
Analysis of a commercial PGC material using TEM and core loss EELS spectroscopy
indicates that it resembles a typical, high temperature-pyrolysed non-graphitising carbon
derived from phenolic resin. However, analysis of two types of mesoporous carbon derived
from the algal polysaccharide alginic acid (Starbon® and AMCS), shows a higher percentage
fullerene character than the respective non-graphitising carbon. In addition, AMCS samples
Based on these observations and the results of XPS analysis, a mechanism of calcium
catalysis for the formation of fullerene-like carbon has been discussed.
The carbon microstructures of Starbon® and AMCS are considerably different to that of
commercial PGC. Both Starbon® and AMCS have extensive curvature of graphitic layers due
to high-fullerene character whilst the microstructure of PGC predominantly features extended
planar graphitic stacks. The fact that the chromatographic properties of the two
biomass-derived carbons are similar to those of PGC suggests that, at the molecular level, the retentive
properties of fullerene-like and turbostratic graphite, for an analyte, are equivalent. In
addition, whilst the fullerene stacks of Starbon® and AMCS were limited to 2-3 layers, the
graphitic stacks of PGC were 3-6 layers thick which suggests that the stack depth has minimal
effect on the retention mechanism in PGC chromatography.
Acknowledgements
A. S. Marriott would like to thank the BBSRC for DTA doctorate funding. We also thank the
EPSRC (Grant reference EP/K023853/1) for funding access to TEM facilities and expertise
under the Leeds EPSRC Nanoscience Research Equipment Access Facility (LENNF) scheme.
References
[1] Gokulakrishnan N, Kania N, Léger B, Lancelot C, Grosso D, Monflier E et al., An
ordered hydrophobic P6mm mesoporous carbon with graphitic pore walls and its
application in aqueous catalysis. Carbon 2011; 49 (4):1290-8
[2] Chai S- H, Howe JY, Wang X, Kidder M, Schwartz V, Golden ML et al., Graphitic
mesoporous carbon as a support of promoted Rh catalysts for hydrogenation of carbon
[3] West C, Elfakir C, Lafosse M, Porous graphitic carbon: A versatile stationary phase for
liquid chromatography. J. Chromatogr. A 2010; 1217 (19): 3201-16
[4] Saliger R, Fischer U, Herta C, Fricke J, High surface area carbon aerogels for
supercapacitors. J. Non-Cryst. Solids1998;225: 81-5
[5] Fu R- W, Li Z- H, Liang Y- R, Li F, Xu F, Wu D- C, Hierarchical porous carbons: design,
preparation, and performance in energy storage. New Carbon Mater. 2011; 26 (3): 171-9
[6] Gilbert MT, Knox JH, Kaur B, Porous Glassy Carbon, A New Columns Packing Material
for Gas Chromatography and High-Performance Liquid Chromatography. Chromatographia
1982; 16 (1): 138-46
[7] Knox JH, Kaur B, Millward GR, Structure and performance of porous graphitic carbon in
liquid chromatography. J. Chromatogr. A 1986; 352: 3-25
[8] P. Ross, R. E. Majors, LC-GC Eur.2000; 13: 310-9
[9] Budarin V, Clark JH, Hardy JJE, Luque R, Milkowski K, Tavener SJ et al.,Starbons: New
Starch-Derived Mesoporous Carbonaceous Materials with Tunable Properties. Angew. Chem.
2006; 118 (23): 3866-70
[10] White RJ, Budarin VL, Clark JH, Tuneable Mesoporous Materials from
α-D-Polysaccharides. ChemSusChem 2008; 1 (5): 408-11
[11] White RJ, Antonio C, Budarin VL, Bergström E, Thomas-Oates J, Clark JH,
Polysaccharide-Derived Carbons for Polar Analyte Separations. Adv. Funct. Mater. 2010; 20
(11): 1834-41
[12] Antonio C, Pinheiro C, Chaves MM, Ricardo CP, Ortuño MF, Thomas-Oates J, Analysis
carbon liquid chromatography-electrospray ionization mass spectrometry. J. Chromatogr. A
2008; 1187 (1-2): 111-8
[13] Zhang Z, Brydson R, Aslam Z, Reddy S, Brown A, Westwood A et al. Investigating the
structure of non-graphitising carbons using electron energy loss spectroscopy in the
transmission electron microscope. Carbon 2011; 49 (15): 5049-63.
[14] Parker HL, Hunt AJ, Budarin VL, Shuttleworth PS, Miller KL, Clark JH, The importance
of being porous: polysaccharide-derived mesoporous materials for use in dye adsorption. RSC
Advances. 2012; 2 (24): 8992-7
[15] Marriott AS, Hunt AJ, Bergström E, Wilson K, Budarin VL, Thomas-Oates J et al.,
Natural template approach to mesoporous carbon spheres for use as green chromatographic
stationary phases. RSC Advances. 2013; Paper submitted
[16] Robitzer M, Di Renzo F, Quignard F, Natural materials with high surface
area. Physisorption methods for the characterization of the texture and surface of
polysaccharide aerogels. Micropor. Mesopor. Mat. 2011; 140 (1): 9-16
[17] Daniels H, Brown A, Scott A, Nichells T, Rand B, Brydson R, Experimental and
theoretical evidence for the magic angle in transmission electron energy loss spectroscopy,
Ultramicroscopy. 2003; 96 (3): 523-34
[18] NIST X-ray Photoelectron Spectroscopy Database, Version 4.1. Gaithersburg, 2012:
National Institute of Standards and Technology. c2000 [updated 15th September 2012, cited
June 2013]. Available from: http://srdata.nist.gov/xps/
[19] Harris PJF, Burian A, Duber S, High resolution electron microscopy of a microporous
carbon. Philos. Mag. Lett. 2000; 80 (6): 381-6
[20] Powles RC, Marks NA, Lau DWM, Self-assembly of sp2-bonded carbon nanostructures
[21] Harris PJF, Tsang SC, High-resolution electron microscopy studies of non-graphitizing
carbons. Phil. Mag. A. 1997; 76 (3): 667-77
[22] Ross AB, Hall C, Anastasakis A, Westwood A, Jones JM, Crewe RJ, Influence of cation
on the pyrolysis and oxidation of alginates. J. Anal. Appl. Pyrol. 2011; 91 (2): 344-51
[23] Grant GT, Morris ER, Rees DA, Smith PJC, Thorn D, Biological interactions between
polysaccharides and divalent cations: the egg-box model. FEBS Letters. 1973; 32 (1): 195-8
[24] Maslen EN, Streltsov VA, Streltsova NR, X-ray study of the electron density in calcite,
CaCO3. Acta Crystallogr. B. 1993; 49 (4): 636-41
[25] Díaz J, Paolicelli G, Ferrer S, Comin F, Separation of the sp3 and sp2 components in the C1s photoemission spectra of amorphous carbon films. Phys. Rev. B; 54 (11): 8064-9
[26] Hirano S, Inagaki M, Saito H, Cooperative accelerating effect of calcium carbonate and
gaseous nitrogen on graphitization of carbon. Carbon 1979; 17 (5): 395-8
[27] Noda T, Inagaki M, Hirano S, Saito H, Effect of coexisting minerals on graphitization of
carbon under pressure. III. Accelerating effect of calcium hydroxide. Bull. Chem. Soc. Jpn.
1969; 42 (6): 1738-40
[28] Õya A, Õtani S, Effects of particle size of calcium and calcium compounds on catalytic
graphitization of phenolic resin carbon. Carbon 1977; 17 (2): 125-9
[29] Tsubouchi N, Xu C, Ohtsuka Y, Carbon Crystallization during High-Temperature
Pyrolysis of Coals and the Enhancement by Calcium. Energy and Fuels 2003; 17 (5): 1119-25
[30] Hirano S, Inagaki M, Saito H, Effect of Coexisting Minerals on the Graphitization of
Carbon under Pressure. V. Distribution of Calcium and Graphitic Components in


![A Li-rich Li[Li0.2Ni0.2Mn0.6]O2 Cathode Material in situ Coated with Polyaniline](data:image/gif;base64,R0lGODlhAQABAIAAAP///wAAACH5BAEAAAAALAAAAAABAAEAAAICRAEAOw==)