This is a repository copy of
A comparative analysis of the evolution of imperfect mimicry.
.
White Rose Research Online URL for this paper:
http://eprints.whiterose.ac.uk/74902/
Article:
Penney, HD, Hassall, C, Skevington, JH et al. (2 more authors) (2012) A comparative
analysis of the evolution of imperfect mimicry. Nature, 483 (7390). 461 - 464 . ISSN
0028-0836
https://doi.org/10.1038/nature10961
[email protected] https://eprints.whiterose.ac.uk/
Reuse See Attached Takedown
If you consider content in White Rose Research Online to be in breach of UK law, please notify us by
A comparative analysis of the evolution of imperfect mimicry,
Penney et al. (2012) - SELF-ARCHIVED COPY
This document is the final, reviewed,
A
, as submitted to
the journal Nature. It does not include any modifications made during
typesetting or copy-editing by the Nature publishing team. This document was
archived six months after publication of the article in line with the self-archiving
policies of the journal Nature, which can be found here:
http://www.nature.com/authors/policies/license.html
The version of record can be found at the following address:
http://www.nature.com/nature/journal/v483/n7390/abs/nature10961.html
The paper should be cited as:
Title:
A comparative analysis of the evolution of imperfect mimicry
Heather D. Penney1, Christopher Hassall1, Jeffrey H. Skevington1,2, Kevin R. Abbott1 and Thomas N. Sherratt1*
1
Department of Biology, Carleton University, 1125 Colonel By Drive, Ottawa, K1R 5B6, Canada
2
Agriculture and Agri-Food Canada, Canadian National Collection of Insects, Arachnids and Nematodes, 960 Carling Avenue, K.W. Neatby Building , Ottawa, K1A 0C6 , Canada
Heather Penney [[email protected]; tel. 00 1 (613) 520 2600 ext. 3866] Chris Hassall [[email protected]; tel. 00 1 (613) 520 2600 ext. 3866] Jeff Skevington [[email protected]; tel. 00 1 (613) 613 759 1647]
Kevin Abbott [[email protected]; tel. 00 1 (613) 520 2600 ext. 3866] Tom Sherratt [[email protected]; tel. 00 1 (613) 520 2600 ext. 1748]
*
Author for correspondence
Telephone: 00 1 (613) 520 2600 (ext. 1748) Fax: 00 1 (613) 520 3539
Summary
Although exceptional examples of adaptation are frequently celebrated, some outcomes of natural selection appear far from perfect and it is important to establish why this is so. For example, many hover flies (Diptera: Syrphidae) are harmless (Batesian) mimics of stinging Hymenoptera 1. However, while some hover fly species are considered excellent mimics, other species bear only a superficial resemblance to their models 2. Here we use a comparative approach to evaluate a series of largely untested hypotheses that have been put forward to explain inter-specific variation in the mimetic fidelity of Palearctic Syrphidae. The degree of mimetic perfection was quantified for each of 38 syrphid species using both human and multivariate morphometric rankings. The long-term relative abundance of each of these species was estimated from 11 independent field studies. Finally, a novel phylogeny based on COI was constructed to control for evolutionary relationships between these species. Our findings, in combination with previous results, allow us to reject several key hypotheses for imperfect mimicry: (i) human ratings of mimetic fidelity are positively correlated with both morphometric
measures and avian rankings, indicating that variation in mimetic fidelity is not simply an illusion based on human perception 3, (ii) no species of syrphid maps out in multi-dimensional space as intermediate in appearance between several different hymenopteran model spe -model hypothesis 4 requires, and (iii) we demonstrate no evidence for a negative relationship between mimetic fidelity and abundance, which calls into question the "kin selection" 5 hypothesis. By contrast, a strong positive relationship between mimetic fidelity and body size supports the "relaxed selection" hypothesis 6,7, suggesting that reduced predation pressure on less profitable prey species limits the selection for mimetic perfection.
Main text
Much of evolutionary theory relating to mimicry has been based on the assumption that the fidelity of mimicry in any given system is extremely high (see 8 for a review). Of course, if mimicry were poor, then one might intuitively expect that signal receivers would learn be able to distinguish mimics from their models and (depending on context) accept or reject them. In reality however, there are many examples of inaccurate or low fidelity mimics 2,4,5,7,9. For example, the relative composition of key odour
compounds of specific non-rewarding orchids differ markedly from the bees they have evolved to resemble 9. Likewise, while mimetic spiders of the genus Cosmophasis bear some resemblance to ants, they are readily visually discriminated by the human observer 4. Perhaps the best examples of imperfect mimics are found in hover flies (Diptera: Syrphidae), which are considered Batesian (harmless) mimics of hymenopteran models 1 but which appear to vary markedly across species in the degree of mimetic perfection 2,10 (see Figure S1).
There have been numerous hypotheses proposed to explain the evolution and maintenance of studythere have been no comparative tests of their validity
5,11
. Common (and inter-related) explanations
to human eyes remain good mimics to natural predators 3, multi-model , such that mimics gain most benefit from imperfect similarity to multiple models 4, (iii) kin selection, such that imperfect mimicry is maintained through its benefit to conspecifics carrying the same trait 5,
such that the evolved degree of mimetic perfection represents a trade-off between selection for mimicry and selection acting on other aspects of life-history 12, such as thermoregulation, and (v)
such that selection for mimicry gradually weakens to a point where it is readily counteracted by weak selection or mutation 6,7 (see Supplementary Information A for additional hypotheses). Below we describe new comparative morphological and genetic data that allows us to evaluate which of these hypotheses are best able to explain the range of mimetic perfection seen in hover flies.
Phenotypic mapping
A long-standing challenge in elucidating the ultimate causes of imperfect mimicry is quantifying the extent of mimetic fidelity between mimics and models, which frequently differ in multiple trait dimensions ranging from colour to shape. Previous measures of mimetic fidelity have used human rankings 13, pigeon responses 10, pixel mapping 10, neural networks 13 and multivariate analyses 14. We employed subjective human rankings of mimetic fidelity (hereafter "fidelityHR", see Methods) across a
range of species which were compared for consistency against a measure derived from a multivariate analysis of trait values MD M
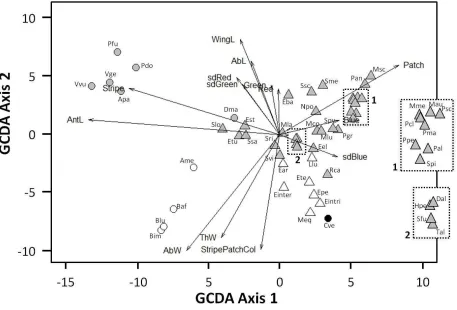
Overall, our morphological analysis of 38 syrphid species and 10 hymenopteran model species indicated that there was a clear statistical difference in appearance between the 2 taxa (Syrphidae vs.
Hymenoptera) (nested MANOVA: taxon, F1,427=797.77, p<0.001; species, F47,427=11.03, p<0.001). The first
The Mahalanobis distances between each of the syrphid species and each of the Hymenoptera groups were calculated from these three canonical variates. This measure was multiplied by -1 to give a quantity, fidelityMD, that is positively related to mimetic fidelity. Syrphids and hymenopterans tend to
cluster with their respective orders, largely on the basis of relative antennae length (RELAntL), a feature that is thought to be used in discrimination by birds 13. The "multi-model" hypothesis 4 would predict that mimics fall between several models, gaining greater benefit from multiple, weaker associations. Our analysis clearly indicates that there are no mimetic phenotypes in our sample that could be considered as falling morphologically between two or more distinct model phenotypes (Figure 1).
The "eye of the beholder" hypothesis recognizes that the natural predators of mimics (such as birds) and humans differ in both their perception and cognitive abilities, and argues that the apparent variation in mimetic perfection is therefore illusory and/or misleading. However our multivariate measure of mimetic fidelity correlated well with our human ranking (r= 0.555, df = 36, p < 0.001, Figure 2), while similar work indicates that trained pigeons rank mimetic fidelity of hover fly species in much the same way as humans do (Figure S2). Additional results suggest that behavioural mimicry (antennae waving, mock stinging, wing wagging) only occurs in species that humans classify as high fidelity mimics (Penney
et al., in prep), further suggesting that the human-based quantification of mimetic perfection is
ecologically relevant. Collectively, these findings suggest that we can discount the "eye of the beholder" hypothesis as an explanation for inter-specific variation in hover fly fidelity.
Mimetic fidelity and abundance
It has been stated frequently that, within hover flies at least, poor mimics tend to occur at higher population densities than good mimics 2,4,10. While this relationship is plausible, it remains entirely anecdotal. The kin selection hypothesis for imperfect mimicry not only assumes a degree of family grouping (unlikely in hover flies 2), but also predicts that the evolved degree of mimetic perfection will be lowest when mimics are relatively common and/or relatively beneficial to attack compared to their models. This prediction arises from the assumption that predators that are largely unable to distinguish mimics from models will sample those high fidelity mimics at a greater rate when the incentive to attack is greater. The constraints 12 and relaxed selection 6,7 hypotheses predict the opposite, namely that the evolved degree of perfection will be highest when mimics are relatively common and/or relatively beneficial to attack simply due to the increased selection pressure to avoid predation through mimicry. Meta-analysis of 11 independent studies (Table S1) demonstrated no evidence of a strong correlation between relative abundance and either measure of mimetic fidelity in our 38 focal species, either before controlling for phylogenetic autocorrelation (fidelityHR: r-bar = 0.065 (95% CI: -0.052 0.181); fidelityMD:
r-bar = 0.001 (95% CI: -0.149 0.152)) or after controlling for phylogeny using phylogenetic generalised least squares regression (PGLS) for a subset of 31 species (Figure 3) (fidelityHR: rbar = 0.083 (95% CI:
-0.031 0.198); fidelityMD: r-bar = 0.223 (95% CI: 0.058 0.389)). Note that this latter correlation
between fidelityMD and abundance was significant (95% CI did not overlap zero) and positive, indicating
Mimetic fidelity and body size
The constraints 12 and relaxed selection 6,7 hypotheses suggest that smaller-bodied (and thus less nutritionally profitable 15) species will endure low levels of predation, even if they are poor mimics,
s the
opposite (see above). Therefore the relationship between hover fly species body size and their mimetic fidelity was assessed. There was a highly significant relationship between body size (-PC1) and fidelityHR
both before controlling for phylogeny (Pearson's correlation, r = 0.680, df = 36, p < 0.001) and after controlling for phylogeny (PGLS, t = 4.693, p < 0.001). The relationship between body size and fidelityMD
was also highly significant before controlling for phylogeny (r = 0.632, df = 36, p < 0.001) and after controlling for phylogeny (t = 3.005, p = 0.005) see Figure 4. Finally, our meta-analysis indicates that the relative abundance of hover fly species was only weakly (negatively) correlated with their body size before controlling for phylogeny (r-bar = -0.132 (95% CI: -0.239 -0.024)) and after controlling for phylogeny (r-bar = -0.240 (95% CI: -0.476 -0.005)), and it is clear that this relationship is not consistent among studies (Figure S5).
The constraints and relaxed selection hypotheses both suggest that larger, more profitable species will tend to achieve a higher degree of mimetic fidelity at equilibrium, due to the greater underlying incentive on predators to attack them. Other dimensions of profitability might include evasive flight behaviour, but predation of hover flies by birds takes place largely on flowers 2. Of course, the predicted evolutionary trajectory for small and large mimics is less obvious if larger-bodied species are rarer than smaller-bodied species 14,16, but as noted above, there is no consistent evidence that this is the case. Likewise, our expectation that selection might be less intense on small species because they are less valuable prey might not hold if predators rely heavily on body size as a trait to distinguish mimics from models 17 (hymenopteran models tend to be larger). At the extreme, if predators were highly sensitive to size then there might be a complete relaxation of selection on mimicry in small species (since they are always attacked regardless of mimetic fidelity), leading to the same general outcome we have observed. Alternatively, small body-size could conceivably favour higher mimetic fidelity as a way to counteract size-based discrimination. Nevertheless, there is evidence that predators cannot discriminate perfectly between mimics and models on the basis of body size 17, and our general arguments remain valid.
Conclusion
a relaxation of selection on mimetic fidelity alone without the need to invoke a specific constraint to generate counter-selection, renders the relaxed selection hypothesis entirely sufficient to explain the variation we have documented, but we cannot discount the constraints hypothesis. Whether the patterns we have revealed are observed in other mimicry complexes remains to be seen. However it is clear that the comparative method will play an important role in evaluating the various explanations not only for imperfect mimicry, but limits to adaptation in general.
Methods Mimetic fidelity
Specimens
We focused on the hover fly species recorded in the most extensive (>40,000 specimens) multi-annual (15 years) abundance dataset available 20; see Table S2 for a species list. We took photographs of the dorsal and lateral aspects of pinned specimens of 35 species which were included in this focal dataset and present in sufficient numbers at the Canadian National Collection of Insects and Arachnids (CNC), Ottawa, Canada. Three additional hoverfly species were included to increase the number of high fidelity mimics, while ten hymenopteran species representing a broad array of potential models (vespid wasps, polistine wasp, honey bee, bumble bees) were also photographed. Photographs were taken of 10 individuals (5 males, 5 females) for each of the 38 syrphid species and 10 individuals of each
hymenopteran species (all female). All the photographs were taken using a Canon EO5 50D camera with macro lens (100 mm) and microtwin light (MT-243X).
Human rankings
A sample of the photographs, all dorsal view, representing 2 different individuals of each of the 38 syrphid species were collated. Human volunteers (n=21) were shown each photograph in random order on a projector screen for 20 seconds, alongside the same images of a wasp (Vespula vulgaris), honeybee (Apis melifera) and bumblebee (Bombus impatiens). Each hover fly and model image was presented at magnifications such that they had the same projected body length. Human subjects were asked to rank each syrphid on a scale of 1 (very poor mimic) to 10 (excellent mimic) for each of the 3 potential models (wasp, honey bee and bumble bee). The human rank of mimetic fidelity identified the model type to which the potential mimic bore the closest resemblance (based on overall mean score for images of that species) and provided a measure of mimetic fidelity, fidelityHR.
Multivariate ratings
multivariate measures of mimetic fidelity (see text) remains significant even when we remove RGB and the number of stripes and patches, retaining only measurements of the physical dimensions of
specimens (r = 0.369, df = 36, P = 0.023). All of the above size-related values in our analyses were first divided by the width of the head before analysis to create a relative measurement.
A generalized canonical discriminant analysis (GCDA) was used to identify combinations of variables that serve to discriminate among one or more groups of data based on differences among them using the "candisc" library 21 in R 22. Each potential mimic species is represented by a centroid in multivariate space representing the mean GCDA variates of the individual specimens of that species. Typically each model species centroid clustered closely around its taxonomic group centroid. The distance between species' centroids (the Mahalanobis distance) represents a multi-dimensional measure of the
morphological similarity between species. While we cannot confidently assign specific hymenopteran models to each mimic, it is possible to distinguish bee mimics from wasp mimics. Therefore, the average of the distances between each mimic centroid and the centroids of the bee and wasp models was calculated to give a score for mimetic fidelity for each mimic to its putative model group. The smallest mean Mahalanobis distance from the hover fly species to its potential model type (bee or wasp) again provided a measure of mimetic fidelity. Since Mahalanobis distances were negatively related to mimetic fidelity, we invert those distances to give a measure of mimetic fidelity that is easier to interpret: fidelityMD.
Quantification of body size
Body size of each of the 38 syrphid species photographed was quantified by conducting a principal components analysis (PCA) on body dimensions mentioned above. The first principal component (PC1) explained 82.9% of the variation in the data, was strongly negatively correlated to all six body
dimensions (r<-0.81, p<0.001 in all cases), and was taken as a composite measure of body size. Since PC1 was negatively correlated to body size measures, we refer to "-PC1", which is positively correlated with body size, in the results as an aid to interpretation.
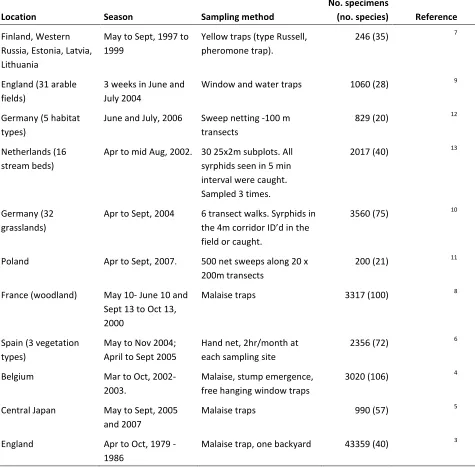
Abundance
We identified 11 independent studies that provide estimates of relative hover fly abundance based on a range of trapping and survey methods (see Table S1 for full details). These studies included between 3 and 34 species for which we had detailed morphological data (hence estimates of mimetic fidelity). Where multiple years of data were presented, this was based on the arithmetic mean count of each species trapped per year over the whole period of recording. These data were considered reasonably indicative of abundance, as there was a general tendency for the relative abundance of hover fly species to correlate between studies based on a range of trapping methods (see Table S3).
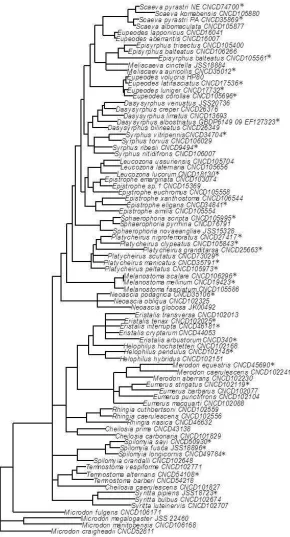
Phylogenetic analysis
specimens represent most major syrphid clades. Four species of Microdon, the putative sister group to the rest of the syrphids 23, were used as outgroup taxa.
The 5 region of cytochrome oxidase c subunit I (COI) was sequenced for each specimen following the methods outlined in Gibson et al24. DNA extraction and sequencing was performed in house and at the Canadian Centre for DNA Barcoding. The resultant sequences, as well as images and related data, can be accessed through the Barcode of Life Data Systems (BOLD) (http://www.barcodinglife.org/) in the public
Mimicry “ MIM“K http://www.boldsystems.org/views/projectmenu.php?&). In addition, all sequences were deposited in GenBank (Table S4).
Bayesian analyses were conducted using MrBayes 3.1.2 25 with a Markov Chain Monte Carlo (MCMC) method as submitted remotely to the CIPRES computing cluster (www.phylo.org/). MrModeltest v2.3 (JAA Nylander 2004, Uppsala University) was used to determine the best model (GTR+I+G) for analysis. Four chains (three hot, one cold) were run simultaneously for 5 million generations. Trees were sampled every 1000 generations and each simulation was run twice. At 5 million generations the standard deviation was 0.03195. Following the discard of the first 500,000 samples as burn-in, 9002 trees were used to generate a majority rule consensus tree, posterior probabilities for each node, and branch length estimates. The resulting phylogeny is largely congruent with other published results that used nuclear loci 23 and contains multiple taxa per genus which acts as a major control for the single
mitochondrial marker. Reassuringly, the resulting phylogeny supported monophyly for all genera apart from identifying two paraphyletic genera that have been suggested as such in the literature (Cheilosia
26,27
and Eupeodes27, Figure S6). Finally, using additional 28S sequences for a subset of 15 species (see
Table S4 for accession numbers), we find a significant correlation between the phylogenetic distances of the COI+28S and COI-only trees (Mantel test for phylogenetic distances, r=0.680, p<0.0001) suggesting that our COI phylogeny is an adequate representation of the phylogenetic relationships between the species in our analysis.
Relationships between variables were first evaluated without control for phylogenetic autocorrelation using Pearson correlations. Autocorrelation was incorporated into a second analysis using the
"corGrafen" function in the "ape" library 28 in R 22 to create a covariance matrix based on species from the tree structure described above. The "gls" function in the "nlme" package 29 was then used to carry out the test. For the abundance analysis, Pearson correlations between variables were used in the "MetaTable" function in the "psychometric" package 30 in R to calculate the weighted mean correlation, r-bar, for all 11 studies. This statistic does not have an associated p-value, but 95% confidence intervals for the coefficient were calculated and can be used to determine significance. To control for
phylogenetic autocorrelation, t-statistics from the PGLS analyses of abundance were converted to Pearson correlation coefficients, where r=t/sqrt(n-2+t2) followed by the calculation of the weighted mean correlation.
Acknowledgements
Carleton University Research Ethics Committee and conducted according to the guidelines set out in the Tri-Council Policy Statement on Ethical Conduct for Research Involving Humans. The work was
supported by grants to T.N.S. from NSERC, the Canada Foundation for Innovation and the Ontario Innovation Trust. C.H. was supported by an Ontario MRI Fellowship.
References
1 Mostler, G. Observations on the question of wasp mimicry. Z Morph Okol Tiere29, 381-454 (1935).
2 Gilbert, F. in Insect Evolutionary Ecology (eds M.D.E. Fellowes, G.J. Holloway, & J. Rolff) 231-288 (CABI, 2005).
3 Cuthill, I. C. & Bennett, A. T. D. Mimicry and the eye of the beholder. Proceedings of the Royal Society: Series B (Biological Sciences)253, 203-204 (1993).
4 Edmunds, M. Why are there good and poor mimics? Biological Journal of the Linnean Society70, 459-466 (2000).
5 Johnstone, R. A. The evolution of inaccurate mimics. Nature418, 524-526 (2002).
6 Duncan, C. J. & Sheppard, P. M. Sensory discrimination and its role in the evolution of Batesian mimicry. Behaviour24, 269-282 (1965).
7 Sherratt, T. N. The evolution of imperfect mimicry. Behavioral Ecology13, 821-826, doi:10.1093/beheco/13.6.821 (2002).
8 Ruxton, G. D., Sherratt, T. N. & Speed, M. P. Avoiding Attack: The Evolutionary Ecology of Crypsis, Warning Signals, and Mimicry. (Oxford University Press, 2004).
9 Vereecken, N. J. & Schiestl, F. P. The evolution of imperfect floral mimicry. Proceedings of the National Academy of Sciences105, 7484-7488, doi:10.1073/pnas.0800194105 (2008).
10 Dittrich, W., Gilbert, F., Green, P., McGregor, P. & Grewcock, D. Imperfect mimicry - a pigeon's perspective. Proceedings of the Royal Society: Series B (Biological Sciences)251, 195-200 (1993). 11 Chittka, L. & Osorio, D. Cognitive dimensions of predator responses to imperfect mimicry. PLoS
Biology5, e339 (2007).
12 Holen, O. H. & Johnstone, R. A. The evolution of mimicry under constraints. American Naturalist
164, 598-613 (2004).
13 Bain, R. S., Rashed, A., Cowper, V. J., Gilbert, F. S. & Sherratt, T. N. The key mimetic features of hoverflies through avian eyes. Proceedings of the Royal Society: Series B (Biological Sciences)
274, 1949-1954 (2007).
14 Iserbyt, A. et al. Frequency-dependent variation in mimetic fidelity in an intraspecific mimicry system. Proceedings of the Royal Society: Series B (Biological Sciences)278, 3116-3122 (2011). 15 Sutherland, W. J. Do oystercatchers select the most profitable cockles? Animal Behaviour30,
857-861 (1982).
16 Harper, G. R. & Pfennig, D. W. Mimicry on the edge: why do mimics vary in resemblance to their model in different parts of their geographical range? Proceedings of the Royal Society: Series B (Biological Sciences)274, 1955-1961 (2007).
17 Marples, N. M. Do wild birds use size to distinguish palatable and unpalatable prey types?
18 Hagman, M. & Forsman, A. Correlated evolution of conspicuous coloration and body size in poison frogs (Dendrobatidae). Evolution57, 2904-2910,
doi:10.1111/j.0014-3820.2003.tb01531.x (2003).
19 Janzen, D. H., Hallwachs, W. & Burns, J. M. A tropical horde of counterfeit predator eyes.
Proceedings of the National Academy of Sciences107, 11659-11665, doi:10.1073/pnas.0912122107 (2010).
20 Gilbert, F. S. & Owen, J. Size, shape, competition and community structure in hoverflies (Diptera: Syrphidae). J. Anim. Ecol.59, 21-39 (1990).
21 Friendly, M. & Fox, J. candisc: Generalized canonical discriminant analysis. R package version 0.5-19 (2010).
22 R Development Core Team. R: A language and environment for statistical computing. (R Foundation for Statistical Computing, 2010).
23 Skevington, J. H. & Yeates, D. K. Phylogeny of the Syrphoidea (Diptera) inferred from mtDNA sequences and morphology with particular reference to classification of the Pipunculidae (Diptera). Molecular Phylogenetics and Evolution16, 212-224 (2000).
24 Gibson, J. F., Skevington, J. H. & Kelso, S. Placement of the Conopidae (Diptera) within the Schizophora based on ten mtDNA and nrDNA gene regions. Molecular Phylogenetics and Evolution56, 91-103 (2010).
25 Ronquist, F. & Huelsenbeck, J. P. MrBayes 3: Bayesian phylogenetic inference under mixed models. Bioinformatics Applications Note19, 1572-1574 (2003).
26 Rotheray, G. & Gilbert, F. Phylogeny of Palaearctic Syrphidae (Diptera): evidence from larval stages. Zoological Journal of the Linnean Society127, 1-112,
doi:10.1111/j.1096-3642.1999.tb01305.x (1999).
27 Mengual, X., Ståhls, G. & Rojo, S. First phylogeny of predatory flower flies (Diptera, Syrphidae, Syrphinae) using mitochondrial COI and nuclear 28S rRNA genes: conflict and congruence with the current tribal classification. Cladistics24, 543-562, doi:10.1111/j.1096-0031.2008.00200.x (2008).
28 Paradis, E., Claude, J. & Strimmer, K. APE: analyses of phylogenetics and evolution in R language.
Bioinformatics20, 289-290 (2004).
29 Pinheiro, J., Bates, D., DebRoy, S., Sarkar, D. & R Development Core Team. nlme: Linear and nonlinear mixed effects models. R package version 3.1-98 (2011).
30 Fletcher, T. D. psychometric: Applied psychometric theory. R package version 2.2 (2010).
Author contributions H.D.P. photographed and measured specimens, and collected data on human rankings; J.H.S. provided the novel molecular phylogeny; C.H. analysed the data; C.H., K.R.A. and T.N.S. wrote the paper; T.N.S. conceived the project. All authors discussed the results and provided comments on the manuscript.
Figure 2: The relationship between two different measures of mimetic fidelity in hover flies using Mahalanobis distances (FidelityMD) and human rankings (FidelityHR). Line shows linear regression.
Symbols: wasp mimics (filled triangles), bee mimics (open triangles) and the non-mimetic syrphid,
Figure 3: Phylogenetic relationships between the subset (31) of the hover fly species (Diptera: Syphidae)
“ FidelityHR),
Figure 4a,b: Relationship between body size (estimated as -PC1) and (a) a measure of mimetic fidelity based on Mahalanobis distances (FidelityMD) and (b) human ratings of mimetic fidelity (FidelityHR). Lines
Figure S2 The relationship between the mimetic fidelities of 11 hover fly species assessed by pigeons trained to discriminate wasps from non-mimetic flies 1 and by humans 2. Human rankings were obtained by asking human participants (n=25) to rank images of 11 syrphid species (presented at the same size) along with a non-mimetic fly and wasp (Vespula spp.) for their degree of similarity to a sample of 5 representative wasp (Vespula spp.) images. Species names: S.ri=Syrphus ribesii; T.ve=Temnostoma vespiforme; C.ca=Chrysotoxum cautum; H.pe=Helophilus pendulus; E.gr=Epistrophe grossulariae; X.pe=Xanthogramma pedissequum; C.bi=Chrysotoxum bicinctum; S.ve=Sphecomyia vespiformis; V.zo=Volucella zonaria; S.py=Scaeva pyrastri; I.gl=Ichyrosyrphus glaucius; Wasp=mixture of Vespula vulgaris and Vespula rufa; Fly=a mixture of Diptera species from the genera Tabanus, Tachina,
Sarcophaga and Scataphaga. Pearson's product-moment correlation, r=0.854, df=11, p<0.001.
Pigeon peck rate based on Wasp+ data
0
10
20
30
40
50
60
Figure S3 Relationships between relative abundance (logged in all plots apart from G) of hover fly (Diptera: Syrphidae) species recorded in 11 independent field studies and mimetic fidelity as measured by Mahalanobis distances. A=3, B=4, C=5, D=6, E=7, F=8, G=9, H=10, I=11, J=12, K=13.
Table S1 Details of 11 independent studies that provide estimates of hover fly abundance.
Location Season Sampling method
No. specimens
(no. species) Reference
Finland, Western Russia, Estonia, Latvia, Lithuania
May to Sept, 1997 to 1999
Yellow traps (type Russell, pheromone trap).
246 (35) 7
England (31 arable fields)
3 weeks in June and July 2004
Window and water traps 1060 (28) 9
Germany (5 habitat types)
June and July, 2006 Sweep netting -100 m transects
829 (20) 12
Netherlands (16 stream beds)
Apr to mid Aug, 2002. 30 25x2m subplots. All syrphids seen in 5 min interval were caught. Sampled 3 times.
2017 (40) 13
Germany (32 grasslands)
Apr to Sept, 2004 6 transect walks. Syrphids in
ID
field or caught.
3560 (75) 10
Poland Apr to Sept, 2007. 500 net sweeps along 20 x
200m transects
200 (21) 11
France (woodland) May 10- June 10 and Sept 13 to Oct 13, 2000
Malaise traps 3317 (100) 8
Spain (3 vegetation types)
May to Nov 2004; April to Sept 2005
Hand net, 2hr/month at each sampling site
2356 (72) 6
Belgium Mar to Oct,
2002-2003.
Malaise, stump emergence, free hanging window traps
3020 (106) 4
Central Japan May to Sept, 2005 and 2007
Malaise traps 990 (57) 5
England Apr to Oct, 1979
-1986
Table S2 List of (a) Syrphidae and (b) Hymenoptera species included in the morphological analysis.
(a) Syrphidae
Subfamily Tribe Species
Included in phylogeny?
Abbreviation in Figure 1
Eristalinae Eristalini Eristalis arbustorum Linnaeus Yes Ear
Eristalinae Eristalini Eristalis interrupta Poda Yes Einte
Eristalinae Eristalini Eristalis intricaria Linnaeus No Eintr
Eristalinae Eristalini Eristalis pertinax Scopoli No Epe
Eristalinae Eristalini Eristalis tenax Linnaeus Yes Ete
Eristalinae Eristalini Eumerus funeralis Meigen No Efu
Eristalinae Eristalini Eumerus strigatus Fallén Yes Est
Eristalinae Eristalini Merodon equestris Fabricius Yes Meq
Eristalinae Eristalini Helophilus pendulus Linnaeus Yes Hpe
Eristalinae Eristalini Spilomyia longicornis Loew Yes Slo
Eristalinae Eristalini Spilomyia sayi Goot Yes Ssa
Eristalinae Eristalini Syritta pipiens Linnaeus Yes Spi
Eristalinae Eristalini Temnostoma alternans Loew Yes Tal
Eristalinae Eristalini Cheilosia vernalis Fallén No Cve
Eristalinae Eristalini Rhingia campestris Meigen No Rca
Eristalinae Brachyopini Neoascia podagrica Fabricius Yes Npo
Syrphinae Bacchini Melanostoma mellinum Fabricius Yes Mme
Syrphinae Bacchini Melanostoma scalare Fabricius Yes Msc
Syrphinae Bacchini Platycheirus angustatus Zetterstedt No Pan
Syrphinae Bacchini Platycheirus clypeatus Meigen Yes Pcl
Syrphinae Bacchini Platycheirus granditarsa Forster Yes Pgr
Syrphinae Bacchini Platycheirus manicatus Meigen Yes Pma
Syrphinae Bacchini Platycheirus nigrofemoratus Kanervo Yes Pni
Syrphinae Bacchini Platycheirus peltatus Meigen Yes Ppe
Syrphinae Bacchini Platycheirus scutatus Meigen Yes Psc
Syrphinae Syrphini Dasysyrphus albostriatus Fallén Yes Dal
Syrphinae Syrphini Epistrophe eligans Harris No Eel
Syrphinae Syrphini Episyrphus balteatus De Geer Yes Eba
Syrphinae Syrphini Eupeodes corollae Fabricius Yes Eco
Syrphinae Syrphini Eupeodes latifasciatus Macquart Yes Ela
Syrphinae Syrphini Eupeodes luniger Meigen Yes Elu
Syrphinae Syrphini Leucozona lucorum Linnaeus Yes Llu
Syrphinae Syrphini Meliscaeva auricollis Meigen Yes Mau
Syrphinae Syrphini Scaeva pyrastri Linnaeus Yes Spy
Syrphinae Syrphini Sphaerophoria menthastri Linnaeus Yes Sme
Syrphinae Syrphini Sphaerophoria scripta Linnaeus Yes Ssc
Syrphinae Syrphini Syrphus ribesii Linnaeus Yes Sri
(b) Hymenoptera
Family Species
Abbreviation in Figure 1
Apidae Apis mellifera Linnaeus Ame
Apidae Bombus affinis Cresson Baf
Apidae Bombus impatiens Cresson Bim
Apidae Bombus lucorum Linnaeus Blu
Vespidae Ancistrocerus parietum Linnaeus Apa
Vespidae Dolichovespula maculata Linnaeus Dma
Vespidae Polistes dominula Christ Pdo
Vespidae Polistes fuscatus Fabricius Pfu
Vespidae Vespula germanica Fabricius Vge
Table S3 Product moment correlation coefficients between the relative abundance of hover flies in 11 studies included in the meta-analysis (see Table S1). Values in bold (all positive) refer to statistically significant correlations in relative abundance (P < 0.05), letters refer to the individual studies.
MW H KL Me Mo Ou R F T GO
L -0.162 0.538 -0.102 0.599 -0.459 0.699 -0.204 0.526 0.801 0.382
MW 0.458 -0.274 0.467 0.998 0.150 0.907 0.142 0.628 0.202
H -0.060 0.867 -0.096 0.949 0.125 0.772 0.981 0.451
KL 0.534 0.070 0.153 -0.011 -0.015 0.933 0.353
Me 0.247 0.849 0.363 0.667 0.969 0.459
Mo -0.086 0.977 -0.232 -0.249 -0.016
Ou 0.010 0.605 0.980 0.464
R -0.006 0.147 0.116
F 0.900 0.380
T 0.993
Table S4 List of specimens used in the construction of the Syrphidae phylogeny (Figure S5) with their individual specimen codes (CNC = Canadian National Collection) and GenBank accession numbers.
Species Author GenBank #
COI
Genbank #
28S Unique # for COI
Cheilosia caerulescens Meigen JN991966 CNC DIPTERA 101827
Cheilosia carbonaria Egger JN991967 CNC DIPTERA 101829
Cheilosia prima Hunter JN991968 CNC DIPTERA 43138
Dasysyrphus albostriatus Fallén EF127323 EF127402 from 14
Dasysyrphus bilineatus Matsumura JN991969 CNC DIPTERA 26349
Dasysyrphus creper Snow JN991970 CNC DIPTERA 26376
Dasysyrphus limatus Hine JN991971 CNC DIPTERA 13693
Dasysyrphus venustus Meigen JN991972 Jeff Skevington Specimen # 20736
Epistrophe (Epistrophe) eligans Harris JN991974 CNC DIPTERA 34841
Epistrophe (Epistrophella) emarginata Harris JN991975 CNC DIPTERA 103074
Epistrophe (Epistrophella) sp. 1 JN991973 CNC DIPTERA 15369
Epistrophe (Epistrophella) euchromus Kowarz JN991976 CNC DIPTERA 105558
Epistrophe similis Doczkal & Schmid JN991977 CNC DIPTERA 105554
Epistrophe (Epistrophe) xanthostoma Williston JN991978 CNC DIPTERA 106544
Episyrphus (Episyrphus) balteatus De Geer JN991980 EF127416 CNC DIPTERA 105561
Episyrphus (Episyrphus) balteatus De Geer JN991979 CNC DIPTERA 106266
Episyrphus (Episyrphus) trisectus Loew JN991981 CNC DIPTERA 105400
Eristalis (Eoseristalis) arbustorum Linnaeus JN991982 CNC DIPTERA 340
Eristalis (Eoseristalis) cryptarum Fabricius JN991983 CNC DIPTERA 44053
Eristalis (Eoseristalis) interrupta Poda JN991984 CNC DIPTERA 1833
Eristalis (Eristalis) tenax Linnaeus JN991985 AY261750 CNC DIPTERA 102025
Eristalis (Eoseristalis) transversa Wiedemann JN991986 CNC DIPTERA 102013
Eumerus barbarus Coquebert JN991987 CNC DIPTERA 102077
Eumerus macquarti Ferguson JN991988 CNC DIPTERA 102088
Eumerus punctifrons Loew JN991989 CNC DIPTERA 102104
Eumerus strigatus Fallén JN991990 CNC DIPTERA 102119
Eupeodes (Lapposyrphus) aberrantis Curran JN991991 CNC DIPTERA 16007
Eupeodes (Metasyrphus) corollae Fabricius JN991992 EU431467 CNC DIPTERA 105696
Eupeodes (Lapposyrphus) lapponicus Zetterstedt JN991993 CNC DIPTERA 16041
Eupeodes (Metasyrphus) latifasciatus Macquart JN991994 CNC DIPTERA 17536
Eupeodes (Metasyrphus) luniger Meigen JN991995 CNC DIPTERA 17732
Eupeodes (Eupeodes) volucris Osten Sacken JN991996 HP80
Helophilus (Pilinasica) hochstetteri Nowicki JN991997 CNC DIPTERA 102168
Helophilus (Helophilus) hybridus Loew JN991998 CNC DIPTERA 102151
Helophilus (Helophilus) pendulus Linnaeus JN991999 AY261751 CNC DIPTERA 102145
Leucozona (Leucozona) lucorum Linnaeus JN992001 EF501965 CNC DIPTERA 18130
Leucozona (Ischyrosyrphus) ussuriensis Stackelberg JN992002 CNC DIPTERA 105704
Melanostoma fasciatum Macquart JN992003 CNC DIPTERA 105586
Melanostoma mellinum Linnaeus JN992004 CNC DIPTERA 19423
Melanostoma scalare Fabricius JN992005 EF127417 CNC DIPTERA 106296
Meliscaeva auricollis Meigen JN992006 EF127423 CNC DIPTERA 35012
Meliscaeva cinctella Zetterstedt JN992007 Jeff Skevington Specimen # 18884
Merodon (Merodon) aberrans Egger JN992008 CNC DIPTERA 102230
Merodon (Merodon) equestris Fabricius JN992010 EU431455 CNC DIPTERA 45690
Merodon (Merodon) caerulescens Loew JN992009 CNC DIPTERA 102241
Microdon (Microdon) craigheadii Walton JN992011 CNC DIPTERA 52811
Microdon (Chymophila) fulgens Wiedemann JN992012 CNC DIPTERA 106171
Microdon (Microdon) manitobensis Curran JN992013 CNC DIPTERA 106168
Microdon (Microdon) megalogaster Snow JN992014 Jeff Skevington Specimen # 22460
Neoascia (Neoascia) globosa Walker JN992015 JK00492
Neoascia (Neoasciella) obliqua Coe JN992016 CNC DIPTERA 102325
Neoascia (Neoascia) podagrica Fabricius JN992017 CNC DIPTERA 35106
Platycheirus (Platycheirus) clypeatus Meigen JN992018 CNC DIPTERA 105843
Platycheirus (Pyrophaena) granditarsa Forster JN992019 CNC DIPTERA 4199
Platycheirus (Platycheirus) manicatus Meigen JN992020 CNC DIPTERA 35791
Platycheirus (Platycheirus) nigrofemoratus Kanervo JN992021 EF127432 CNC DIPTERA 27417
Platycheirus (Platycheirus) peltatus Meigen JN992022 AY261753 CNC DIPTERA 105973
Platycheirus (Platycheirus) scutatus Meigen JN992023 CNC DIPTERA 73029
Rhingia (Rhingia) caerulescens Loew JN992024 CNC DIPTERA 102556
Rhingia (Eorhingia) cuthbertsoni Curran JN992025 CNC DIPTERA 102559
Rhingia (Rhingia) nasica Say JN992026 CNC DIPTERA 46632
Scaeva albomaculata Macquart JN992027 CNC DIPTERA 105877
Scaeva komabensis Matsumura JN992028 CNC DIPTERA 105880
Scaeva pyrastri Linnaeus JN992029 EF127410 CNC DIPTERA 35869
Scaeva pyrastri Linnaeus JN992030 EF127410 CNC DIPTERA 74700
Sphaerophoria (Sphaerophoria) novaeangliae Johnson JN992031 Jeff Skevington Specimen # 15328
Sphaerophoria (Sphaerophoria) pyrrhina Bigot JN992032 CNC DIPTERA 76791
Sphaerophoria (Sphaerophoria) scripta Linnaeus JN992033 AY261755 CNC DIPTERA 105995
Spilomyia crandalli Curran JN992034 CNC DIPTERA 102648
Spilomyia fusca Loew JN992035 Jeff Skevington Specimen # 18896
Spilomyia longicornis Loew JN992036 CNC DIPTERA 49784
Spilomyia sayi Goot JN992037 CNC DIPTERA 50930
Syritta bulbus Walker JN992038 CNC DIPTERA 102674
Syritta luteinervis de Meijere JN992039 CNC DIPTERA 102707
Syritta pipiens Linnaeus JN992040 AY261713 Jeff Skevington Specimen # 18723
Syrphus (Syrphus) ribesii Linnaeus JN992042 CNC DIPTERA 9494
Syrphus (Syrphus) torvus Osten Sacken JN992043 CNC DIPTERA 106029
Syrphus (Syrphus) vitripennis Meigen JN992044 AY261728 CNC DIPTERA 34704
Temnostoma alternans Loew JN992045 CNC DIPTERA 54108
Temnostoma barberi Curran JN992046 CNC DIPTERA 54218
Supplementary Information A: Additional hypotheses to explain imperfect mimicry
Below is a list of some alternative theories for the evolution and maintenance of imperfect mimicry not covered in the main text. Note that these theories, like those in the main text, are not necessarily mutually exclusive.
Disequilibrium
I
mimicry. For instance, Sheppard 15 investigating the field distributions of mimetic African butterflies found that the proportion of individuals of a given species with a poor resemblance to the model was higher when mimics were relatively common. Likewise, Azmeh et al. 16 noted that the larvae of many hover fly mimics that are judged imperfect are aphidophagous and that these species may have increased dramatically in numbers following agricultural development. However in his review of imperfect mimicry in hover flies Gilbert 17 argued I
evidence for a non-
Multiple predators
A prey species would be expected to evolve increasing mimetic fidelity to a model that is noxious to a potential predator. However, if an additional predator is present that specialises on the model, mimetic perfection will be selected against due to increased predation from that specialist 18, resulting in an optimal phenotype that is highly but not perfectly faithful to the model. Like the multi-model
hypothesis (main text) this mechanism is represents a specific realization of the constraint hypothesis, with counter-selection being imposed by predators species that do not find the model aversive.
Satyric mimicry
Howse and Allen 19 proposed that a phenotype that looked partly like a noxious model and partly like a palatable prey would confuse the predator allowing more time for the imperfect mimic to escape. There is currently no evidence for this phenomenon in hover flies 17 and one might argue that as such phenotypes become more common then predators would be less readily confused.
References
1 Dittrich, W., Gilbert, F., Green, P., McGregor, P. & Grewcock, D. Imperfect mimicry - a pigeon's perspective. Proceedings of the Royal Society: Series B (Biological Sciences)251, 195-200 (1993). 2 Rashed, A. Evolution and maintenance of Batesian Mimicry, with particular references to hover
flies (Diptera: Syrphidae) PhD thesis, Carleton University, (2006).
3 Gilbert, F. S. & Owen, J. Size, shape, competition and community structure in hoverflies (Diptera: Syrphidae). J. Anim. Ecol.59, 21-39 (1990).
4 Fayt, P. et al. Contrasting responses of saproxylic insects to focal habitat resources: the example of longhorn beetles and hoverflies in Belgian deciduous forests. Journal of Insect Conservation
5 Taki, H. et al. Responses of community structure, diversity and abundance of understory plants and insect assemblages to thinning in plantations. Forest Ecology and Management259, 607-613 (2010).
6 Ricarte, A., Marcos-Garcia, M. A. & Moreno, C. E. Assessing the effects of vegetation type on hoverfly (Diptera: Syrphidae) diversity in a Mediterranean landscape: implications for conservation. Journal of Insect Conservation15, 865-877 (2011).
7 Leinon, R., Soderman, G. & Kutenkova, N. Results from pollinator monitoring in Kivach 1997-1999. Transactions of Karelian Research Centre of Russian Academy of Science10, 85-89 (2006). 8 Ouin, A. et al. The species-area relationship in the hoverfly (Diptera, Syrphidae) communities of
forest fragments in southern France. Ecography29, 183-190 (2006).
9 Marshall, E. J. P. & West, T. M. Impacts of field margins, landscape and crop on the distributions of Syrphidae on an arable farm. Aspects of Applied Biology81, 91-99 (2007).
10 Meyer, B., Jauker, F. & Steffan-Dewenter, I. Contrasting resource-dependent responses of hoverfly richness and density to landscape structure. Basic and Applied Ecology10, 178-186 (2009).
11 Moron, D. et al. Wild pollinator communities are negatively affected by invasion of alien goldenrods in grassland landscapes. Biological Conservation142, 1322-1332 (2009).
12 Haenke, S., Scheid, B., Schaefer, M., Tscharntke, T. & Thies, C. Increasing syrphid fly diversity and density in sown flower strips within simple vs. complex landscapes. Journal of Applied Ecology
46, 1106-1114 (2009).
13 Kleijn, D. & van Langevelde, F. Interacting effects of landscape context and habitat quality on flower visiting insects in agricultural landscapes. Basic and Applied Ecology7, 201-214 (2006). 14 Mengual, X., Ståhls, G. & Rojo, S. First phylogeny of predatory flower flies (Diptera, Syrphidae, Syrphinae) using mitochondrial COI and nuclear 28S rRNA genes: conflict and congruence with the current tribal classification. Cladistics24, 543-562, doi:10.1111/j.1096-0031.2008.00200.x (2008).
15 Sheppard, P. M. The evolution of mimicry: a problem in ecology and genetics. Cold Spring Harbor Symposia in Quantitative Biology24, 131-140 (1959).
16 Azmeh, S., Owen, J., Sorensen, K., Grewcock, D. & Gilbert, F. Mimicry profiles are affected by human-induced habitat changes. Proceedings of the Royal Society: Series B (Biological Sciences)
265, 2285-2290 (1998).
17 Gilbert, F. in Insect Evolutionary Ecology (eds M.D.E. Fellowes, G.J. Holloway, & J. Rolff) 231-288 (CABI, 2005).
18 Pekár, S., Jarab, M., Fromhage, L. & Herberstein, M. E. Is the evolution of inaccurate mimicry a result of selection by a suite of predators? A case study using myrmecomorphic spiders.
American Naturalist 178, 124-134 (2011).