BORANG PENGESAHAN STATUS TESIS
JUDUL: WEB-BASED DATA ANALYSIS TOOLS (WeDA) SESI PENGAJIAN: 2013/2014
Saya CHONG RUEN FEI mengaku membenarkan tesis Projek Sarjana Mud.a ini disimpan di Perpustakaan Fakulti Teknologi Maklumat dan Komunikasi dengan syarat-syarat kegunaan sebagai berikut:
1. Tesis dan projek adalah hakmilik Universiti Teknikal Malaysia Melaka 2. Perpustakaan Fakulti Teknologi Maklumat dan Komunikasi dibenarkan
membuat salinan untuk tujuan pengajian sahaja.
3. Perpustakaan Fakulti Teknologi Maklumat dan Komtlllikasi dibenarkan membuat salinan tesis ini sebagai bahan .pertukaran antara institusi pengajian tinggi.
4. **Sila tandakan (/) _ _ _ SULIT
_ _ _ TERHAD
/ TIDAK
_ _ _ TERHAD
CHONG RUEN FEI H-3-28, Lorong Helang 1, 11700 Gelugor,
Pulau. Pinang / /
Tarikh: ~
_s-_
~ I I(Mengandungi maklumat yang berdarjah
keselamatan atau kepentingan Malaysia seperti yang termaktub di dalam AKTA RAHSIA RASMI 1972) (Mengandtlllgi maklumat TERHAD yang telah ditentukan oleh organisasi/badan di mana penyelidikan dijalankan)
DR. AZAR KAMILAH BT DRAMAN @MUDA
Tarikh:
--uf---¢-~-'_f
__ _
DECLARATION
I hereby declare that this project report entitled
WEB-BASED DATA ANALYSIS TOOLS
(WeDA)
is written by me and is my own effort and that no part has been plagiarized
without citations.
STUDENT
~
Date:*f~f
r;c tlf
I (CHONG RUEN FEI)
SUPERVISOR
a::r_
Date:?/sfr'~
(DR AZAH KAMILAH BT
DRAMAN @MUDA)
iii
DEDICATION
iv
ACKNOWLEDGEMENTS
I would like to thank my supervisor Dr.Azah for giving assistant to complete this
project and thesis successfully.
I would also like to thank to my friends who gave me suggestion and advice
v
ABSTRACT
A manual way of generating graph by inserting formula on the desired data is not
efficient and time consuming. Not all users have that kind of knowledge on using
manual data analysis tools such as Microsoft Excel. The purpose of this project is to give
users a platform to analyze their desired data without any manual formula input
required. The proposed system is hopefully capable to give the convenience to users to
vi
TABLE OF CONTENTS
DECLARATION II
DEDICATION
TIT
ACKNOWLEDGEMENTS IV
ABSTRACT
v
TABLE OF CONTENTS VI
LIST OF TABLES XI
LIST OF FIGURES XIII
LIST OF ATTACHMENTS
xv
CHAPTER 1 INTRODUCTION 1
1.1 Project Background 1
1.2 Problem Statement 2
1.3 Objective 2
1.4 Project Scope 2
1.4.1 Target User 3
1.4.2 System Module 3
1. 4 .3 Boundary of System 4
1.5 Project Significance 4
1. 6 Expected Output 4
1. 7 Conclusion 5
CHAPTER 2 LITERATURE REVIEW AND PROJECT METHODOLOGY 6
2.2 Facts and Findings
2.2.1 Domain
2.2.2 Existing System
2.2.2.1 Microsoft Excel
2.2.3 Technique
2.3 Project Methodology
2.3.1 Object-oriented Analysis and Design (OOAD)
2.3.2 Extreme Programming (XP)
2.3.3 Rapid Application Development (RAD)
2.4 Project Requirement
2.4.1 Software Requirement
2.4.2 Hardware Requirement
2.4.3 Other Requirement
2.5 Project Schedule and Milestones
2.6 Conclusion
CHAPTER 3 ANALYSIS
3 .1 Introduction
3 .2 Problem Analysis
3 .3 Requirement Analysis
3. 3 .1 Data Requirement
3.3.1.1 Input Data
3.3.1.2 Output Data
3.3.2 Functional Requirement
3.3.2.1 Upload excel file
3.3.3 Non-functional Requirement
3.3.3.1 Performance and Throughput
3.3.3.2 Integrity
©
Universiti Teknikal Malaysia Melaka3.3.3.3 Security
3.3.3.4 Serviceability
3.3.3.5 Usability
3.3.3.6 Maintainability
3.3.3. 7 Flexibility and Extensibility
3.3.3.8 Reusability
3.3.4 Other Requirement
3. 3 .4 .1 Software Requirement
3.3.4.2 Hardware Requirement
3 .4 Conclusion
CHAPTER 4 DESIGN
4.1 Introduction
4.2 High-level Design
4.2.1 System Architecture
4.2.2 User Interface Design
4.2.2.1 Input Design
4.2.2.2 Output Design
4.2.3 Database Design
4.2.3 .1 Conceptual and Logical Database Design
4.3 Conclusion
CHAPTER 5 IMPLEMENTATION
5.1 Introduction
5 .2 Software Development Environment Setup
5.3 Software Configuration Management
5.3.1 Configuration Environment Setup
5.4 Implementation Status
©
Universiti Teknikal Malaysia Melaka5.5 Conclusion
CHAPTER 6 TESTING
6.1 Introduction
6.2 Test Plan
6.2.1 Test Organization
6.2.2 Test Environment
6.2.3 Test Schedule
6.3 Test Strategy
6.3.1 Classes of Tests
6.3.1.1 Unit Testing
6.3.1.2 Integration Testing
6 .3 .1. 3 System Testing 6.3.1.4 User Acceptance Test
6.4 Test Design
6.4.1 Test Description
6.4.2 Test Data
6.5 Test Results and Analysis
6.6 Conclusion
CHAPTER 7 PROJECT CONCLUSION
7.1 Observation on Strengths and Weaknesses
7.1.1 System Strengths
7.1.2 System Weaknesses
7.2 Propositions for Improvement
7.3 Contribution
7.4 Conclusion
©
Universiti Teknikal Malaysia Melakax
REFERENCES 48
APPENDIX A: PROJECT MILESTONE 50
APPENDIX B: GANTT CHART 52
APPE~TIIX C: DATA REQUIRE1v1ENTS 61
APPENDIX D: FUNCTIONAL REQUIREMENT 63
APPENDIX E: SEQUENCE DIAGRAMS 64
APPENDIX F: USER INTERFACE DESIGN 67
APPENDIX G: INPUT DESIGN 71
APPENDIX H: OUTPUT DESIGN 72
APPENDIX I: CLASS DIAGRAMS 73
APPENDIX J: IMPLEMENTATION STATUS 75
APPENDIX K: TEST DESCRIPTION 76
APPENDIXL: TEST DATA 78
APPENDIXM: TEST RESULT AND ANALYSIS 79
xi
LIST OF TABLES
Table 2-1 Server hardware requirement ... 19
Table 2-2 Client hardware requirement ... 20
Table 3-1 Performance and throughput systemic qualities ... 26
Table 3-2 Integrity systemic qualities ... 26
Table 3-3 Security systemic qualities NFR ... 27
Table 3-4 Serviceability systemic qualities ... 27
Table 3-5 Usability systemic qualities ... 27
Table 3-6 Maintainability systemic qualities ... 28
Table 3-7 Flexibility and extensibility systemic qualities ... 28
Table 3-8 Reusability systemic qualities ... 28
Table 3-9 Software requirement for WeDA ... 29
Table 3-10 Server hardware requirement.. ... .30
I Table 3-11 Client hardware requirement ... 30
Table 5-1 Server and Client Hardware Configuration ... 37
Table 6-1 Members Involved in Testing Phases ... .40
Table 6-2 Testing Environment Specification ... .41
Table 6-3 WeDA Test Schedule ... .41
Table A-1 Project milestone ... 50
Table C-1 Input data requirement for Web-based Data Analysis Tool ... 61
Table C-2 Output data requirement for Web-based Data Analysis Tool ... 62
Table D-1 Functional requirement of Web-based Data Analysis Tool ... 63
Table G-1 Input Design for WeDA ... 71
xii
Table J-1 WeDA Implementation Status ... 75
Table K-1 Test Description for WeDA ... 76
Table L-1 Test Data for WeDA ... 78
Table M-1 Test Results and Analysis for WeDA ... 79
xiii
[image:13.595.50.482.238.720.2]LIST OF FIGURES
Figure 2-1 Microsoft Excel ... 8
Figure 3-1 Use case diagram ofWeDA ... 24
Figure 4-1 n-Tier Architecture ofWeDA ... 33
Figure 4-2 ERD for WeDA ... 34
Figure B-1 Gantt chart ofproject ... 52
Figure B-2 Gantt chart of project ... 53
Figure B-3 Gantt chart of project ... 54
Figure B-4 Gantt chart of project ... 55
Figure B-5 Gantt chart of project ... 56
Figure B-6 Gantt chart of project ... 5 7 Figure B-7 Gantt chart of project ... 58
Figure B-8 Gantt chart of project.. ... 59
Figure B-9 Gantt chart of project ... 60
Figure E-1 Login for \VeDA ... 64
Figure E-2 Registration for WeDA ... 65
Figure E-3 Upload Excel File for WeDA ... 66
Figure F-1 Home page ofWeDA ... 67
Figure F-2 Registration ofWeDA ... 68
Figure F-3 Upload file ofWeDA ... 69
Figure F-4 Analysis result ofWeDA ···:···70
Figure 1-1 WeDA User ... 73
Figure I-2 WeDA UserDB ... 73
xiv
Figure 1-4 WeDA ReportManager ... 73
Figure 1-5 WeDA FileManager ... 74
Figure 1-6 WeDA Facade ... 74
xv
LISTOFATfACHMENTS
APPENDIX A: PROJECT MILESTONE ... 50
APPENDIX B: GANTT CHART ... 52
APPENDIX C: DATA REQUJREMENTS ... 61
APPENDIX D: FUNCTIONAL REQUJREMENT ... 63
APPENDIX E: SEQUENCE DIAGRAMS ... 64
APPENDIX F: USER INTERFACE DESIGN ... 67
APPENDIX G: INPUT DESIGN ... 71
APPENDIX H: OUTPUT DESIGN ... 72
APPENDIX I: CLASS DIAGRAMS ... 73
APPENDIX J: IMPLEMENTATION STATUS ... 75
APPENDIX K: TEST DESCRIPTION ... 76
APPENDIX L: TEST DATA ... 78
1
CHAPTERl
INTRODUCTION
1.1 Project Background
A collection of data plays an important role for decision making to a personal,
or/and a company. Data can be measure in terms of qualitative and quantitative. Data
can be found anywhere, such as temperature of a weather, personal income,
friendliness of a system, size of an object, and so on. Hence, it is important to keep the
record of a data.
The "Web-based Data Analysis Tool (WeDA)" is a proposed web-based tool to
produce a set of statistical result based the data input by the user. In this project, user
is required to input a set of quantitative data only in order to allow the tool to formulate
the data provided, while data results is the results shown based on the user input and
desired results in different type of charts and diagram.
2
1.2 Problem Statement
1. The user input data in the existing data analysis tool such as Microsoft Excel is
done by manual, the results also depends on the user input the formula on the
desired data.
2. The data input by the user and the results produced by the tools in existing data
analysis tool cannot be saved and export to the current workspace used.
1.3 Objective
1. To allow user only input the desired data and produce the charts and diagrams by
selecting the preset functions given in WeDA.
2. To provide the convenience to the user as WeDA is a web-based tools which can
be access anywhere at any time, with workspace and internet connection provided.
3. To allow the user to login and save the analysis result in the server.
1.4 Project Scope
The scope of project: All user whoever have their own data set which wish to be
analyze by the analysis tool. This project is consisting 9 modules and the system
3
1.4.1 Target User
The propose system are available for all user whoever have their own data set
which wish to be analyze by the proposed system. User can choose either want to
use the tools with or without a membership account. If user register an account in the system, they can keep their data set inside the system's database and user will be
able to view back their analysis result. Besides, user also can edit or update their
existing data set that had been store inside the system's database. If the user use the system without a membership account, the system will still analyze the data set that
had been insert by the user and produce the analysis result but the user will not be
able store their analysis result in the server.
1.4.2 System Module
The proposed system consists the modules as mention below:
a. Member Login Module This module allows user who has membership
account to login to the system.
b. User Register Module
c. User Profile Module
d. Data Management Module
e. Data Analysis Module
This module allows user to register to be
member for the system.
This module allows user to update their profile.
This module allows user to upload or edit their
data set.
This module will analyze the data set that had
been insert by the user and produce analysis
4
1.4.3 Boundary of System
The scopes of the project boundary are listed as follows:
a. The system is built based on 3-tier web-based application architecture which the
framework concept is based on the Model-View-Controller (MVC) model
concept.
b. The system is built using hypertext markup language (HTML), JavaServer Pages
(JSP), Javascript, My Structured Query Language (MySQL) and Java
programming language.
c. For data analysis module, the system will analyze data set by using basic
statistical method and the analysis result will produce as chart or diagram form.
1.5 Project Significance
The importance of this data analysis tools is to allow user to analyze their data set
at anytime and anywhere. Registered user able to store their analysis result in the
system database server. Besides, the analysis result that produce by the system is in
chart or diagram form which makes user easier to understand the analysis result.
1.6 Expected Output
The proposed data analysis tools will analyze the data set that had been input by
the user. The tools will produce chart or diagram based on the analysis result. In the
data analysis module, user are required to input their data set which they wanted to be
analyze by the tools. The analysis tools will analyze the data set by using basic
statistical method or technique and it will produce the analysis result as in chart or
5
1. 7 Conclusion
This chapter includes project background, problem statements, objective, project
scope, project significant and the expected output of the project. As a conclusion, the
proposed system is a data analysis tools which it will analyze the data set that had been
input by user. The system will analyze data set by using basic statistical methods and
6
CHAPTER2
LITERATURE REVIEW AND PROJECT METHODOLOGY
2.1 Introduction
Literature review is a summary of the finding and facts found through the related
sources. Literature review provides supporting facts to develop the proposed tool. The
purpose of having literature review is synchronized with existing literature on data
analysis tool, which will be the foundation of developing Web-based Data Analysis
Tool (WeDA). This can be used as justification for future research on data analysis
tool.
From literature reviewed, an appropriate methodology is required to develop the
proposed tool. An appropriate methodology will enhance the overall development
process and guide the developer to develop high quality software in shorter time and
lower cost.
Hence, there are multiple methodologies will be proposed based on the facts of
reason to select a methodology and principle of methodology. Project can be
categorized into three sizes, which are small, medium and complex system. Aspects
such as size, composition, priorities, and criticality determines the different level of
projects. Personal bias is commonly in a project team, based on their experiences,
principles and preferences towards a project. These will affect the project quality and
7
2.2 Facts and Findings
2.2.1 Domain
Data analysis tool is a documented and tested step-by-step method aimed at smooth functioning through standard practices. It is used in variety of industries which need analysis report, generally include the graph such as (1) pie chart, (2) line graph, (3) bar chart and (4) analysis based on the graph.
8
2.2.2 Existing System
Currently, Microsoft Excel is using manual formula input to generate different types
of graph. Hence, the existing systems will be used as a foundation to develop the
tool.
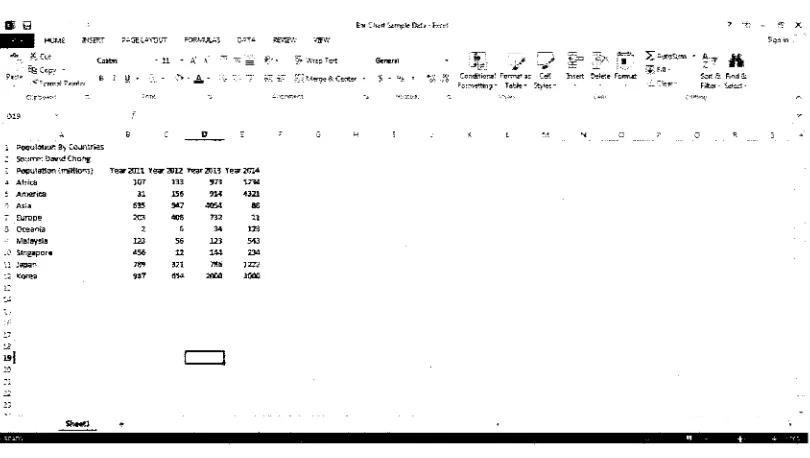
2.2.2.1 Microsoft Excel
.8
~~---- 1-'CJ.ilt INSE<:: _..;.',lE[..ia~-:JiP" f()F:l.·11.>v.3 Ct.i.,.~ .-e,-rr,>; •'IfW
: ~latkm ~-COJntrieS .: Soun:e:DwidCnol'lf :: Popu!.mori (mtffilJl'\'S}
.l Afnai -; E1.Erope
5 Oceania "'\1a!aysla
~,: Si11g:aporie
-.?.3
_ o _
Tear2011 Year-2012 Year2Dl3 Tear2Gl4
107
"' "" ,,..,
n ,,,
...
-'"
..
,-
..
""
...
m 11l
' 34 l13
i l l
" 123 5'13
.,. 12 144 234
,.., "1 ,., = m
[image:23.595.78.483.248.477.2]""' """' '"""
Figure 2-1 Microsoft Excel
Microsoft Excel is a spreadsheet application developed by Microsoft for
Microsoft Windows and Mac OS.
This tool is developed to allow the user to organize data manipulation such as
arithmetic operations. In this tool, it has a variety of interactive features which allows
the user interface hides the spreadsheet completely. Interactive features can be
customized with colors, styles and pattern to present the spreadsheet. Hence, the
9
The basic functionality in Microsoft Excel are calculation, graphing, macro
programming and pivot tables. With the main objective to aid the user, there are
many formulas can be input to allow calculation based on data and formula. There
are wide range of formulas and functions available, and is categorized based on
user's usage. Besides, different types of graph can be produced based on the data
calculated.
Furthermore, Microsoft Excel of Windows version supports programming
language, which is Visual Basic Applications (VBA). VBA also allows spreadsheet
manipulation by writing code using Visual Basic Editor (VBE). It is suitable for
programmers who prefer code module organization environment. They can
implement automating tasks such as formatting or data organization in VBA. Any
intermediate results by calculation done can be reported back to the spreadsheet.
Microsoft Excel has the following features:
1. Graphical Representation
• Charts
~ Line chart
~ Barchart
~ Pie chart
~ Combo chart (combines both line and histogram)
~ Stock chart
~ Pivot chart
• Graphs
• Histograms
2. Conditional formatting
• Highlight cell rules
~ Greater than ...
~ Less than .. .