•
- .... '·.· '
V/1074-82-EN
PROGRAMrE OF RESEARCH AND ACTIONS ON THE DEVELOPMENT OF THE LABOUR MARKET
~·By :
TRADE
WITH
DEVELOPING COUTNRIES AND EMPLOYMENT IN THE
EUROPEAN COMMUNITY
...---·
/ (comparative analysis for six countries on the.basis
of current import and export flows in trade with
industrial products)
/
For:
DIETER SCHUMACHER
Inst. Fur
Wirtschafts-forschung - BERLIN
The {i:ommi ss ion of the
European Communities.
Study n° 82/22
I
.,
..
. I
. i
I
. !
j
I .
The studies described in this docu.ent were financed by the
Commission of the European Communities as part of its Programme
of Research and Actions on the Development of the Labour Market.
The analysis and results presented do not necessarily reflect
the views of the Labour Market or on other policy matters.
•
t
V/1074/82-EN
Trade with developing countries and employment in
the EuroRean Community
A comparative analysis for six EEC countries on the
basis of current import and export flows in trade
with industrial products
-2-Slightly amended version of a report prepared for
the Federal Minister for Economics and terminated
in December 1980
•
-3-Contents
1.
2.
Object and structure of the report
Preliminary notes on methodology, definitions and data base
2.1 Method
2.2 Explanation and preparation of the statistical material
3. Division of labour with developing countries and foreign trade
of the EEC countries
4. Macroeconomic employment and inco~e effects of trade with
developing countries
5. Changes in sectoral employment structure due to division
of labour with developing countries
6.
7.
Employment effects of the expansion of trade with developing
countries in 1970-77
Conclusion
Appendix: Tables
Bibliography
Page
5
6
6 11
15
19
24
28
33
37
-4-Tabulations Page
Tabulation 1: Diagram of the employment and income effects of the
substitution of imports from developing countries for
production in industrialized countries 7
Tabulation 2: Definition of sectors 12
Tabulation 3: Definition of country groups 14
Tables in text
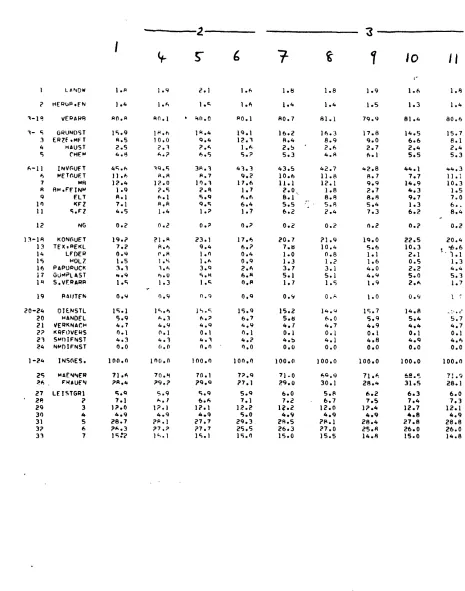
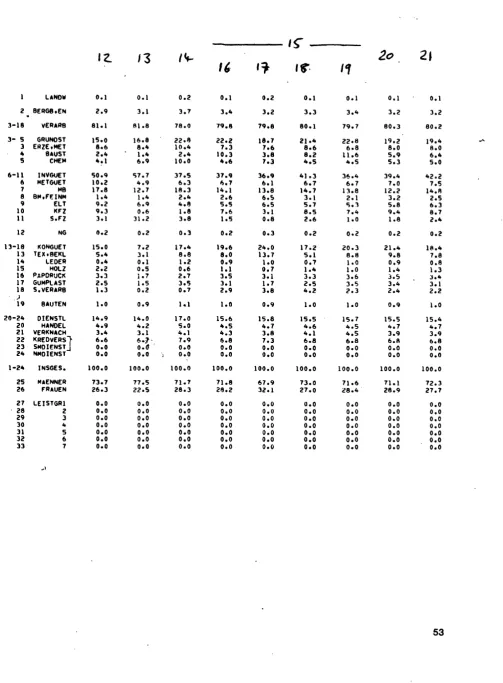
Table 1: Imports ~y the EEC countries in 1970 and 1977 16
Table 2: Exports by the EEC countries in 1970 and 1977 17
Table 3: Macroeconomic employment effects of trade in industrial
goods in the EEC countries in 1977 19
Table 4: Employment and income effects of a US$100 million increase
in exports of industrial goods 20
Table 5: Comparison of the employment and income effects of equal
levels of exports and imports of industrial goods 22
Table 6: Net employment effects by sectors of a US$100 million
increase in both exports and imports in trade in industrial
goods with developing countries 25
Table 7: Extent of sectoral structural changes due to equal increases
in exports and imports in trade in industrial goods with
different groups of countries 26
Table 8: Components of tne change in employment 1970/1977 29
Table 9: Employment effects of the growth of trade in industrial
goods with different groups of countries between 1970 and
1977 31
Tables in Appendix
Table A.1:
Table A.2:
Tables A.3 to A.8:
Tables A.9 to A.14:
Key macroeconomic indicators of the EEC countries in 1977
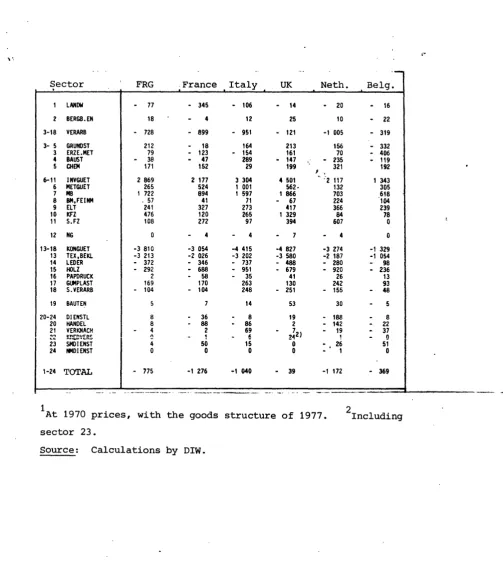
Trade in industrial goods of the EEC countries by groups of countries in 1977
Macroeconomic employment and income effects of the trade in industrial goods with different groups of countries in 1977
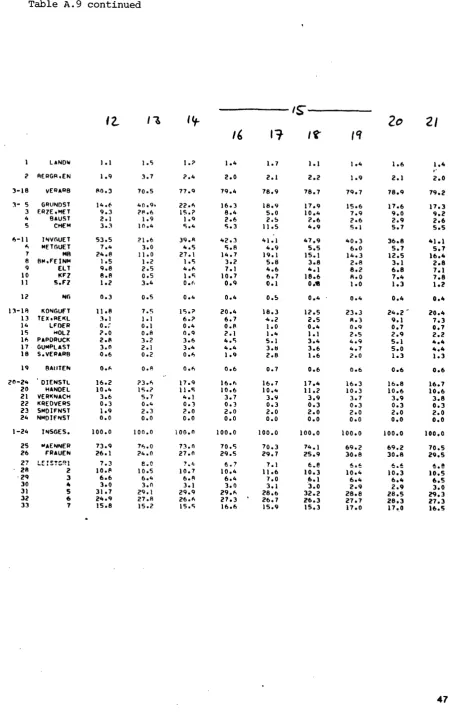
Structure of the employment effects of exports of industrial goods to different groups of countries by sectors, sex and qualification groups in 1977
Tables A.15 Structure of the employment effec~of imports of
to A.20: industrial goods from different groups of countries by
38
39
40
46
sectors, sex and qualification groups in 1977 58
Tables A.:l Net employment effects of an equal increase in trade in
to A.26: industrial goods with different groups of countries by
•
-5-1. Object and structure of the report
A liberal attitude to imports of finished products from developing
countries is meeting with increased resistance in view of the greater
competitiveness of these countries in individual product groups and
persistently high unemployment in the industrialized qountries. For
fear of further job losses in the economic sectors subject to pressure
from imports, additional trade-inhibiting measures were taken both
within the EEC and elsewhere, especially in the second half of the
1970s, instead of allowing the structural change necessary for a new
division of labour in the world economy. In this situation it is
necessary to examine more closely the relations between employment
and exchanges of goods with the Third World. This is the aim of this
report: the results are intended to provide quantitative information
as to whether, and if so to what extent, the internal employment
objective in the individual EEC countries conflicts with a liberal
attitude in trade with developing countries. This may help to introduce
more objectivity into the discussion of development and trade policy at
EEC level.
Empirical analyses of the relevance of trade with developing countries
to employment are available not only for the Federal Republic of Germany
but also for most other EEC countries. However, evaluation of these 1
analyses shows that they are either based on obsolete statistical material
and take account only of the import side (older reports by UNCTAD, ILO,
OECD) or differ substantially from each other in method, period and sec~nal
composition (more recent analyses for the Federal Republic of Germany, France,
Italy, the United Kingdom, the Netherlands, Belgium and Ireland). The
object of this report is to provide a comparative analysis, using a standard
method and the same sec~oral breakdown, for the six EEC countries for which
sufficient data exist. For this purpose, the report uses input-output
calculations which take account not only of the direct employment effects
in the relevant sector but also of the indirect effects induced by the
demand for intermediate consumption inputs. To allow an assessment
of the effects of trade with the Third World on the level and structure of
employment, they are compared with the labour market implications of trade
-sa-First of all, the method used here of calculating trade-induced employment
effects is presented and the data base explained. This is followed by a
brief review of the foreign-trade interdependence of the six EEC countries
dealt with. The effect of a greater internat~onal division of labour on
employment and income in the economy as a whole is then analysed on the
basis of model calculations. For this purpose, the changes in the use of
domestic factors of production (gainfully employed persons as a whole and
by categories; fixed capital) and in GOP due t; equal levels of imports
and exports in the trade in semimanufactures and finished products with
different groups of countries are compared. The resulting shifts in
sectoral employmrl1t are examined in the same way. In addition, the
changes in sectoral employment which can be imputed to the actual growth
of trade in semimanufactures and finished products between 1970 and 1977
are discussed. These give an indication of the extent (which is variable)
to which structural change in the individual EEC countries in the last
decade can be attributed to the international division of labour. The
report concludes with a summary assessing the employment effects of trade
with developing countries. The appendix of tables includes the full results
for the trade in industrial goods of the individual EEC countries with all
groups of countries.
1
For an evaluation of various empirical studies, see UNIDO: The Impact of
Trade with Developing Countries on Employment in Developed Countries
-Empirical Evidence from Recent Research, UNIDO Working Papers on Structural
Changes, No 3, UNIDO/ICIS. 85, October 1978 and OECD: The Impact of the
Newly Industrialising Countries on Production and Trade in Manufactures,
Report by the Secretary-General, Paris 1979, Annex II. A list of available
-6-2. Preliminary notes on methodology, definitions and data base
2.1 Method
Changes in employment in the economy as a whole and in individual sectors
arise from a large number of factors which, moreover, are not independent
of each other. Since the effects of the various domestic and international
e~onomic determinants cannot be considered in isolation, they must be
attributed to them with the aid of model calculations on the basis of
assumptions of greater or lesser simplicity. It is not possible to
go into the methodology problems in detail here2• Only the principal
relationships are briefly outlined here, so that the scope of this report
is clear.
On the basis of an increase in imports, the main effects of a greater
international division of labour and the relationships between them are
shown diagrammatically in the tabulation on page 7. For simplicity,
it is assumed that the world is divided into two economies, A (the
industrialized countries) and B (the developing countries):
(1) If domestic production of a good in A is replaced by import of the
same good from B, then the output of this product and employment and
income in the affected sector in A fall, while output, employment and
income in the same industry increase in B.
{2) In addition, owing to the interdependence between sectors, production,
employment and income also decline in other sectors in A, while they
are correspondingly stimulated in B owing to the necessary provision of
intermediate consumption inputs. Again, the demand in A for imported
intermediate consumption inputs from B falls, while B imports more
intermediate consumption inputs from A.
(3) The net foreign currency earnings obtained by B from the original
increase in exports, after deduction of induced intermediate consumption
imports and losses of exports, allow growth of domestic final uses in
accordance with the marginal tendency to import. This further stimulates
employment in B.
(4) Spending of the net foreign currency earnings of B on imports increases
production in the export industries and the supplying industries in A,
-6a-(5) The change in income in A has multiplier effects due to the
change in consumption expenditure, which in turn influences
production, employment and trade flows.
Other effects not shown in the diagram result from induced changes
in prices, investment and growth in both the industrialized and the
developing countries. Again, A and B include a number ·of inaividual
countries whose competitive positions differ, th1a affecting.the
distribution of the effects described above to the individual countries.
In the ideal case, al ~- effects and repe.rcussions due to national and
inter-national interdependences should be taken into account in order to
determine the level and sectoral structure of the employment effect
of an increased division of labour between the industrialized and the
developing countries. However, to limit the data and computing capacity
requirements to an acceptable scale, empirical studies must
2
Methodological problems are discussed in great detail in
w.s.
Salant/B.N.Vaccara: Import Liberalization and Employment. The Effects of Unilateral
Reduction in United States Import Barriers, Washington D.C. (The Brookings
Institution) 1961. See also H.F. Lydall: Trade and Employment. A Study
of the Effects of Trade Expansion on Employment in Developing and
-7-Tabulation 1. Diagram of the employment and income effects of the
substitution of imports from developing countries for
production in industrialized countries
I
I
I
I
l11
I
I I
---~
I I
12)
I
I
I
---+
II
I
I(3) I
I
I
I
Effects in the
indust-rialized countries (A)
---·---I-II
i4i
iEffects in the developing
countries (B)
I
---'--
1.-~---~---·
I •o---+----t.
I +
I
IS)
II I
.&E.
-
..-,
Meaning of symbols: 6M, 6E, 6X, 6L, 6V, 6F and 6Y denote changes in imports,
exports, gross value of production, employment, GDP,
foreign currency earnings and total finaldemand
respectively. i is the sector whose products are
additionally imported, j represents all sectors j
=
1,••• , n. The symbol
c:J
represents a functionalrelationship between the variables whose form is left open.
-7a-be based on partial analyses: they concentrate - in accordance with the
objective of each- on a few oftn~relations mentioned above, which,
furthermore, can only be represented by simplifying assumptions on the
nature of the functional relationships. Thus this report deals in
partial analyses for the individual EEC countries with the (negative)
direct and intermediate-consumption~induced effects of imports on the
one hand (parts A (1) and A (2) in the diagram) a1d the corresponding
(positive) effects of exports on the other (part A (4) of the diagram).
The basis used is the trade flows in 1977 and changes therein compared
with 1970; their J~vel is not explained and no correlation is
established between imports and exports.
With regard to the functional relatipnships, the instrument used is
. 1 . 3
1nput-output ana ys1s This is based on the idea that the structure
of an economy can be represented as a system of linear equations. For
each economic sector i considered, the following balance equation applies:
3
A full description of the open static model used in this report can befound, for example, in R. Staglin: Methodische und rechnerische Grundlagen
der Input-Output-Analyse, in: R. Krengel (ed.): Aufstellung und Analyse
von Input-OUtput-Tabellen, Sonderhefte zum Allgemeinen Statistischen Archiv,
No 5, Gottingen 1973, pp. 27-54.
-8-n
( 1) L x ..
+
y. = X, in which i=
1, ••• , n.. 1 l.J J. J.
J=
The left-side of equation (1) includes the intermediate consumption
deliveries to all j economic sectors (x .. ) and deliveries to final uses
l.J
(y.), which are composed of private and public consumption, investment J.
and exports; the value of gross sector production (x.) appears on the
J.
right-hand side. It is also assumed that the intermediate consumption
inputs purchased by a sector are proportional to its total production
-i.e., constancy of the input coe:ffficients a .. = Xij is assumed. This
l.J Xi
assumption is expressed in the "Leontief production function"
(2)
which is linear-homogeneous and limitational. Incorporating it in the
balance equation (1) gives
(3)
n
E a .. x. + yJ..
=
xi in which ij=1 l.J J 1, ... ,
n.
This system of linear equations is known as an open,static Leontief
model and can be expressed in matrix notation by
(4) Ax+y=x
In this equation
is the column vector of the sectoral gross production values,
is the column vector of the final use deliveries of the individual
sectors, and
A
a nn
is the matrix of the intermediate input coefficients. By appropriate solution
of the equation system, the total "technologically" dependent gross production
-Sa--1
(5) X = (I-A) y
=
c
YoIn this equation
1 0 0 0 0
I
0 0 0 0 1
-9-represents the unit matrix of order n and
c
=
c
nn
is the inverse of the Leontief matrix (I-A) • Their elements indicate
how much sector 1 must produce in order to satisfy one unit of final use
of goods of sector j.
Hence the coefficients of the inverted Leontief matrix can be used to
determine the entire outputs - i.e., both direct and indirect- needed
by all sectors to satisfy the autonomous demand for goods of a specific
sector. For example, if exports of machines increase, this does not only
affect the production of the mechanical engineering sector directly
concerned (direct effects); its supplying sectors, such as the electrical
engineering industry and the chemical industry, and at the next level
their suppliers in turn, etc., must all produce more intermediate
consumption products (indirect effects) in order ultimately to satisfy
the increased foreign demand for machines.
Just as the direct and indirect production effects of an increase in
final uses can be calculated, it is also possible to determine the primary
inputs required in connection with this production. If it is again
assumed that the input coefficients are constant and the following notation
is used for the'use of labour and capital per unit of gross production
in the individual sectors:
l. total gainfully employed persons (labour coefficient)
J
l;
male gainfully employed personslw j female gainfully employed persons
li
gainfully employed persons of qualification level q (q =l, ...
,Q)k. fixed capital (capital coefficient)
J
v. contribution to GOP (remuneration of all domestic primary inputs) ,
J
the number of workers required in the individual sectors for predetermined
-9a-(6) L. = L.x. {j=l, ••• ,n).
J J J
the figure for all sectors together being
(7)
n L:. = E
j=l
L.x .• J J
This labour requirement breaks down into male and female workers as
follows:
(8)
and
n
{9) E LJ .. w xj
j=l
and by qualification levels as follows:
(10)
n
Lq = E
j=l
l~ X,
Fixed capital required is
{11) K
=
n
l:
k X
j=1 j j
-10-The total remune~ati6n of domestic factors of production - GOP as the
total gross compensation of employees, entrepreneurial activity and
capital, fixed capital consumption and indirect taxes less subsidies
-works out as
( 12)
v
=
n
l:
j=1
v .x .• J J
If the results ori the left-hand side of equations (6) to (12) are
combined in a column vector p and the coefficients on the right-hand
side of these expressions into a matrix A , i.e. p
L1 1
1 0
Ln 0 l-n
L L 1
.
L.np Lm and A
=
Lf L.~p
LW LY • L.!{
Ll L
l
•L~
the requirement of primary inputs can also be written as
(13) p
=
A px.
The direct and indirect requirement of primary inputs for a predetermined
final use vector y, allowing for (5), is then
( 14) p'= A C y.
-lOa-If exports or the change in exports
is incorporated in this relation as the final use.vector, equation (14)
can be used to determine the factors, or increases therein, required for
the production of export goods if foreign demand i.ncreases, as follows:
( 15) A C E.
p
The reduced demand for production factors due to imports can be calculated
in the same way if the imported goods can also be produced at home (competing
imports). If it is assumed that one unit of value of imports in each case
replaces one unit of value of demand for goods of domestic production, the
effects of imports on employment, capital requirements and income are as
follows:
(16)
in which
M
p
=
-A C M,p
-11-represents the column vector of competing imports or the change therein.
The limiting assumptions on which these two formulae are based must be
taken into account in assessing the results. For example, economies of
scale, price effects and changes in utilization of capacity are ignored
by the assumed constancy of the input coefficients. Other distortions
arise from the use of sectoral averages for the coefficients. The more
the production function for individual goods diverges from the average
for the sector as a whole, and the more the goods structure of exports
or imports differs from that of the total production of the relevant
sector, the greater the error. On the export side, i t is assumed that
the whole of exports lead to production and that the exports do not
consist of transfers of capital (e.g., sales of old aircraft or ships).
On the import side, there is the problem of distinguishing between
competing and non-competing imports, and the question of the extent to
which domestic demand is induced for the first time by the possibility
of import, e.g., owing to a lower price. In the approach chosen, the
employment effects of imports are overestimated where domestic demand
would not exist without them, while conversely their effects are
underestimated where they displace domestic suppliers of below-average
productivity from the market.
Having regard to the distortions due to the limiting assumptions of the
theoretical approach, and also in view of inaccuracies in the data used,
the results of the model calculations should not be construed as laying too
claim to a/high degree of exactitude. However,theirdirection and order
of magnitude should convey an accurate picture. Again, the distortions
are likely to tend in the same direction for all EEC countries, so that
comparison of the effects between these countries is not substantially
-11a-2.2 Explanation and preparation of the statistical material
The data used for the empirical analysis are based on EEC and OECD
statistics. The available figures allow a disaggregation into 24
economic sectors, including 16 manufacturing sectors (see Tabulation
2) •
The coefficients for the use of intermediate cons11mption inputs and
contribution to GDP were determined from the stundardized input-output
tables of the Statistical Office of the European Communities. It was
possible to retain tr~ degree of disaggregation of the original tables
in the manufacturLng field - except for the aggregation of the food
sectors - while in the fields of mining and energy and of services, the
tables have been aggregated in accordance with the availability of
up-to-date employment and production data. For the UK, banking and finance
and insurance are included together with Other market services in sector
22. The latest EEC input-output tables,
at the time of computation, relate
!D4
tlie year
19r0 . Accordingly, the values used in this report are expressed in 1970 pricesunless otherwise stated. The unit of currency is the US dollar, which 5
in 1970 was equal to the European unit of account EUR •
The labour coefficients were estimated from figures from the EEC
National
Accounts
Statisti~s
and
indicate the number of gainfully employed personsper unit of gross production value in accordance with the
4
Eurostat: Input-Output Tables. The Nine and the Community, Special Series
a,
1970, Luxembourg 1978.5
Figures expressed in the sources in national currencies have been translated
at the rates of exchange specified by the EEC for 1970 (US$ 1
=
EUR 1=
DM 3.66000
=
FF 5.55419=
Lit 625.000=
Fl 3.62000=
Bfrs 50.0000 £0.41667).6
For this purpose the European Commission provided printouts with revised
data on employment and GDP. The gross ~alues of production were estimated
by adding intermediate consumption inputs (of both domestic and foreign
origin) to the GDP values in the same proportions as in the 1970 input-output
tables. OWing to the lack of subdivision, it was only possible in the case
of sectors 10 and 11, 13 and 14 and 15 and 18 respectively to determine
•
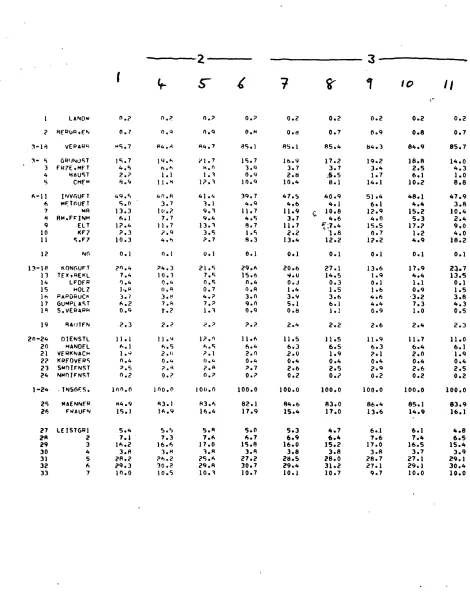
Tabulation 2. Definition of sectorsNo 1 2 3-18 3-5 3 4 5 6-11 ·6 7 8 9 10 11
Description Agricultural,
forestry and fishery products Mining and 3 energy Products of manufacturing industry Primary and producer products Ferrous and non-ferrous ores and -ores -metals Non-metallic mineral products -as-extracted -other than as-extracted Chemical products Capital goods metals Metal products except machinery and transport equipment Agricultural and industrial machinery Office and data processing machines; precision and optical instruments Electrical goods Motor vehicles Other transport equipment 4
Abbreviation LANDW BERGB,EN VERARB GRUNDST ERZE,MET -ERZE -METALLE BAUST -ROH -VERARB CHEM INVGUET METGUET MB BM,FEINM ELT KFZ S.FZ
NACE-CLIO
1
number
(R44)
01 03,05,07,09,11 13 15 17 19 21 23 25 27, 29
..
2 SITC number [04, 05, 22, 23 (excluding 231.2), 241.1, 271, 29] [286 5 , 32 (exclgding 321.8), 33, 34, 35, 688 ] [28 excluding 286 5 ] 67 (excluding g79.3), 68 (excluding 688 ), 693 (excluding 693.4), 698.2, 698.3, 698.6, 723.1 [27 excluding 271] 66, 697.9, 723.2, 231.2, 241.2, 266.2, 266.3, 321.8, 51, 52 53, 54, 55, 56, 57, 59 679.3, 691, 692.2, 693.4, 694, 695, 696, 697 (excluding 697.9), 698.1, 698.4, 698.5, 698.9, 81 692 (excluding 692.2), 71 (excluding 714 and 719.4) 714, 726, 729.7,86 (excluding 861. 7) 719.4, 72 (excluding 723, 726 and 729.7), 891.1 732 (excluding 732.9), 733.3 731, 732.9, 733.1, 734, 735Tabulation
2.
(continued)
No 12 13-18 13 14 15 16 17 18 19 20-24 20 21 22 23 24 Description Food,
drinks and tobacco products Consumer goods Textiles and clothing Leathers, leather and skin goods,
footwear Timber,
wooden products and furniture Paper and printing products Rubber and plastic products Other manufactur~ng prqducts Building and construction
Services Services
of wholesale and retail trade, recovery and repair Transport and communications services Services of credit and insurance
institutions Other
market
servic-es
Non-market
services
Abbreviation NG KONGUET TEX,BEKL LEDER HOLZ PAP
DRUCK
GUMPLAST S.VERARB BAUTEN DIENSTL HANDEL VERKNACH KREDVERS SMDIENST NMDIENST
NACE-CLIO
1
number
(R44}
31,33,35,37,39 41 43 45 47 49 51 53 55,57 61,63;65,67 69 59,71,73,75,77,79 81,85,89,93
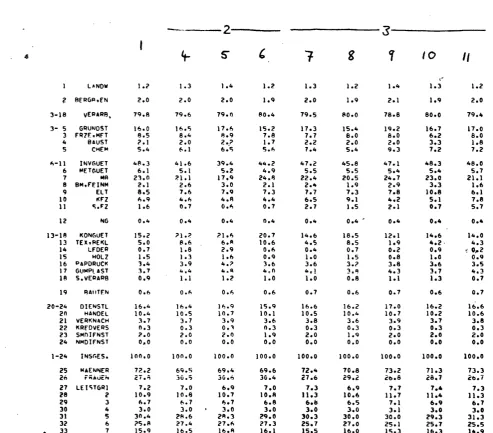
-12b-productivity of labour in 1977. The breakdown between male and female
Wc>rkers is also based mainly on 1977 figures 7• The division by skill··
levels is based on data from a survey of employees in industry in 1972;
this breakdown was possible only for manufacturing industry (sectors 3 to
18)8; however, over 80% of the direct and indirect employment effects of
trade in industrial goods are felt in these sectors. The following seven
qualification groups are distinguished:
7
For the industrial sectors, figures on the division of the labour force
into men and women for 1977 were used (Eurostat: Employment and Unemployment
1972-1978, Luxembourg 1979); the details for the other sectors are based
on information on gainfully employed persons from censuses around 1970
(Eurostat: Censuses of Population in the Community Countries, 1968-1971,
Luxembourg 1977).
8
Eurostat: Social Statistics. Structure of Earnings in Industry 1972,
Special Series. For a comprehensive description of the various qualification
-13-Non-manual workers
1. Management and executives
2. Qualified non-manual workers (assistants}
3. Clerical staff
4. Foremen
Manual workers
5. Skilled workers
6. Semiskilled workers
7. Unskilled workers
Capital coefficients could also be calculated only for the manufacturing 9
sectors, as figures on fixed capital are available only for industry . The
latest data were used in each case; the figures apply to 1977 for France and the UK, to 1976 for the Federal Republic, the Netherlands and Belgium
and to 1975 for Italy.
The values of foreign trade were taken from the OECD statistics for 1970
and 197710• The exports and imports of the individual EEC countries,
classified in accordance with the SITC, were aggreqated to the chosen
sectoral structure in accordance with Tabulation 2. The distinction
between imports of goods which can also be produced at home and ones where
domestic production is impossible is difficult, and would presumably also
differ from country to country. A pragmatic solution to this problem
was chosen, all imported processed or manufactured products being regarded
as also capable of production in the EEC country in view of the level of technological knowhow in the industrialized countries. Food, drinks
and tobacco products and petroleum products were excluded from this
approach. All imports of food goods are deemed to be non-competing because
precisely in this field, international trade is substantially governed by
administrative arrangements and because imports from developing countries
consist predominantly of tropical agricultural products which, of course,
cannot be produced in Europe. Petroleum products had to be excluded as
no separate information ontheproduction function of these products was
available; they are included in the mining and energy sector. Competing
imports are defined here substantially as corresponding to SITC groups
5 to 8 (industrial products) • For the sake of comparability, the employment
and production effects on the export side too were determined for industrial
products only; however, these represent almost the whole of exports frcm
-13a-The_1977 trade values have been corrected for the effects of inflation
by means of sectoral unit value indices on the basis of 19~0 prices in
' 11
the input-outpu_t tabl:es On average, the prices of industrial imports
and exports expre$sed in US dollars approximately doubled between 1970
and· 1977.
The groups of countries distinguished in the-analysis are set out in
Tabulation 3. Within the group of developing countries, the breakdown
.
-allows a comparisOn-between trade ~n goods ·with southern European countries
12 .
-- the candidates for accession to the EEC, Spain, Greece and Po~tugal7
being considered separately among these - the extra-European developing
countries not belonging to OPEC - with separate treatment of the Mediterranean
countries,. Latin America and the powerful exi>orting countries of south-eas·t
_Asia - and ·the OPEC countries. Comparisons can also be made between the
effects- of trade with developing countries on the on·e hand and the division
of labour with the east European state trading countries and the western
industrial countries on the other.
9
B. Seidel {with I. Schweiger): Berechnung des Industriellen Brutto-Anlagevermogens
in den EG-L~ndern unter Anwendung·einheitlicher Definitionen, Abgrenzungen und
Verfahren, _DIW-Beitrage zur Strukturforschu~g No 62, Berlin {Duncker und
Humblot) 1981.
10
-OECD: Commodity Trade Statistics, Series C. When the calculations began,
the figures for 1977 were the latest trading data broken down by groups of
countries and·goods. 1977 is the last year for which figures based on SITC
Rev. 1 are still available for all OECD countries, and can therefore be compared
without reservation with earlier years.
11
we are grateful to the European commission for providing us with the indices
calculated from OECD statistics by comparison of values and quantities.
12
-14-Tabulation 3
Defin~tion of country groups
1. All developing countries
1 1 d 1 0 0 1
. European eve op~ng countr~es
1.1.1 Spain, Greece, Portugal
1.1.2 Yugoslavia, Turkey
1.2 Extra-European developing countries2 (ecluding OPEC)
1.2.1 Mediterranean countries3
1.2.2 Latin America
1.2.3 South-east Asia4
1.2.4 Other developing countries
1.3 OPEC countries5
2. People's Republic of China
3. Comecon countries6
4. Western industrial countries (excluding EEC)
4.1 Japan
4.2 USA
4.3 Other western industrial countries
5. EEC countries (9)
6. All countries
1
'2Gibraltar, Malta and Europe n.e.c. are included in the extra-European developing countries. 3Egypt, Gaza strip, Gibralta·r, Israel, Jordan, Lebanon, Malta, Morocco, Spanish Sahara, Syria, Tunisia, Cyprus and Europe n.e.c. 4Hong Kong, Malaysia, Philippines, Singapore, South Korea and Taiwan. Sorganization of the Petroleum Exporting Countries, and Bahrein, North
.,;..
-15-3. Division of labour with developing countries and foreign trade of the
EEC countries
In 1977, the six EEC countries examined here together spent over $360
billion on imports of goods - nearly 2~ times as much as in 1970. Imports
from developing countries were represented to an above-average degree
in the increase in expenditure. This was due firstly to higher raw
materials prices - in particular, the price explosion in petroleum
resulting from the supply policy of the OPEC countries - and secondly
to a powerful increase in purchases of finished goods from Third World
countries. The picture was somewhat different only for the UK which,
having oil resources of its own, incurred relatively little additional
expenditure on petroleum imports; again, following the country's
accession to the EEC, impo~ts from Community countries increased much
faster ·than from other regions.
The developing countries achieved their successes in industrial products
mainly in the field of consumer goods. This is where they generally
achieve their highest import market shares, which they in fact increased
in all EEC countries during the period considered. They continue to
be very important as suppliers of metals and non-metallic mineral products.
OWing to the EEC's decline in metal imports from the extra-European
developing countries, however, the Third World's sales of primary products
in the aggregate increased only slightly or even decreased. The highest
growth rates were achieved by the developing countries in products of the
capital goods industries. However, their deliveries in these fields are
still relatively negligible; they consist mainly not of capital goods
in the strict sense but of the more durable consumer goods, particularly
electricals •
The developing countries increased sales of industrial products fastest
in the Netherlands, where they rose by a factor of about 2~ by volume
between 19ryo and 1977; the next highest increases were recorded by
France and the Federal Republic, where these sales more than doubled in
the period considered. The results were much less spectacular on the
British, Italian and Belgian semimanufacture and finished product markets.
Nevertheless, the developing countries still achieved good results:~ in
Italy compared with other foreign suppliers, as Italy's overall imports of
industrial goods increased only slightly. Conversely, the Third World
; was less· successful in the UK than other foreign suppliers, although,
-15a-imports of industrial goods, occasioned mainly by the exceptionally high
increase in purchases of capital goods in the other EEC countries. The
poor performance of the developing countries in Belgium is due mainly to
the decline in metal imports, which are particularly important in that
country; on the other hand, Belgian imports of consumer goods from the
Third World increased much faster than British and Italian imports of
these goods.
OVerall, petroleum and other mineral raw materials, as well as agricultural
products {including food, drinks and tobacco products), predominate in the
goods supplied by the developing countries. Industrial products accounted
in 1977 on average for only 20-30%; for comparison, they accounted for
more than half the imports from the state trading countries and 70-80%
of imports from the Community countries and other western industrial
countries. The proportion of imports from OPEC countries accounted for
by industrial products is, of course, particularly low, and this is also
true of imports from Latin America, with its traditional emphasis on
agricultural products and mineral raw materials. By contrast, deliveries
from southern Europe and south-east Asia include a similar proportion
of industrial products to that supplied by the industrialized countries.
In the field of semimanufactures and finished products, the delivery
structures vary between groups of countries according to their endowment
with natural resources and level of development. In the imports from all
groups of developing countries discussed here, consumer goods predominate,
the principal items being textiles and clothing. In addition, Latin America
supplies above-average proportions of leathers, leather and skin goods;
south-east Asia provides particularly high proportions of musical instruments,
games, toys and sports goods; while timber and wooden products predominate
Table 1. Imports by the EEC countries in 1970 and In US$ billion
1970 1977
Average annual change 1977/70 (%) in which imports from: European developing countries Extra-European developing countries (excluding OPEC) OPEC countries
....
In US$ billion1970 1977
Average annual change 1977/70 (%) in which imports from: European developing countries Extra-European developing countries (excluding OPEC) OPEC countries Proportion of total imports from the relevant group of countries accounted for by industrial goods in 1977 (%) All countries Developing countries European developing countries Extra-European developing countries (excluding OPEC) in which: south-east Asia OPEC
countries J
___./
1977
(at
Germany (FR) 28.9 98.5 19.1 20.6 20.1 27.1 18.8 60.8 18.2 26.5 21.4 16.9 61.8 31.6 71.2 45.1 78.5
3.6 current prices) France Italy UK Netherlands Belgium Total imports 18.9 14.9 20.3 13.1 11.3 70.1 46.5 62.8 45.1 39.7 20.6 17.7 17.5 19.3 19.6 28.2 15.7 15.8 25.2 21.8 19.1 16.5 15.4 21.1 12.7 29.3 26.5 18.5 29.3 29.1 Imports of industrial goods
I ...
13.1
9.1
11.7
9.2
8.2
0'\ I
Table
!.(continued)
PR
China
Comecon
countries
Western
industrial
countries
(excluding
EEC)
EEC
countries
Proportion
of
imports
of
industrial
goods
from
all
countries
in
1977
(%)
Developing
countries
European
developing
countries
Extra-European
developing
countries
(excluding
OPEC)
OPEC
countries
PR
China
and
Comecon
countries
Western
industrial
countries
(excluding
EEC)
EEC
countries
Germany (FR) 54.8 54.9 77.1 70.7 12.6
4.2 7.8 0.6 4.2 27.6 55.6 France 72.7 51.4 81.0 81.3 10.5
4.5 5.5 0.5 2.9 21.5 65.1 Italy 90.2 32.4 72.7 72.3 12.5 4.2 7.6 0.7 4.1 23.2 60.3
UK
67.4 69.9 81.4 71.7 11.5 2.2 8.5 0.7 4.1 41.3 43.1
Sources:
OECD,
Commodity
Trade
Statistics,
Series
c,
1970
and
1977;
calculations
by
DIW.
Netherlands
58.9 53.0 67.5 82.9 6.8 1.
8
4.8 0.2 2.2 18.2 72.8
Belgium
72.4 61.3 73.0 78.6 7.1 1.5 5.4 0.2 1.6 14.4 76.8
-16b-are particularly strongly represented in imports from Latin America (metals
and themicals), the Mediterranean region (miherals and chemicals) and the
other developing countries (metals and mineral products). The highest
proportions of products of the capital goods industries are recorded in
deliveries from south-east Asia (electrical goods, office machines and
precision instruments) and from southern Europe and Latin America
(mechanica~ engineering, electrical goods and motor vehicles).
Purchases from the People's Republic of China were concentrated even more
than imports from the developing countries on consumer goods (textiles,
clothing and other manufactured goods) • The Comecon countries supply
mainly (in roughly equal proportions) consumer goods (textiles, clothing
and wooden products) and primary products (metals and chemical products) •
Conversely, products of the capital goods industries predominate in imports
from the western industrial countries. Their proportion is particularly
high in Japanese exports, the emphasis being on motor vehicles, electronics,
office machines and precision instruments. The USA supplies principally
mechanical engineering products, office machines and electrical goods, as
well as chemical products, which are exported on a particularly large
scale. In imports from the countries of the European Community, mechanical
engineering products and motor vehicles are the chief items in the capital
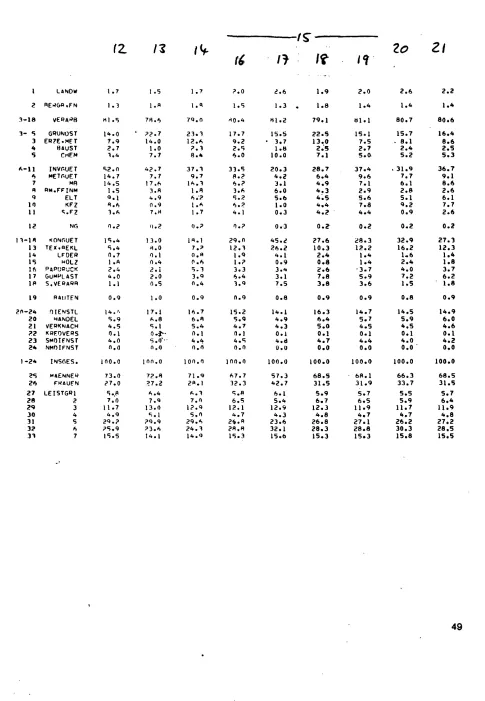
Table 2. Exports by the EEC countries in 1970 and 1977 (at current prices) Germany France Italy UK Netherlands Belgium (FR) Total exports In US$ billion 1970 33.7 17.5 13.0 18.5 11.4 11.3 1977 115.2 62.6, 44.1 55.8 42.4 35.8 Average annual change 1977/70 {%) 19.3 20.0 19.0 17.1 20.5 17.9 in which exports to: European developing countries 18.8 20.5 16.7 16.0 22.2 17.9 Extra-European developing countries {excluding OPEC) 17.2 20.1 16.6 12.8 18.4 18.8 OPEC countries 40.3 30.8 40.2 32.4 34.7 35.3 Exports of industrial goods US$
billion 1970
31.4 13.9 11.2 16.6 6.9 9.8 I 1977 106.1 50.6 38.2 47.7 24.0 29.9
... ...J I
Table
2
(continued)
Germany
France
Italy
UK
(FR)
,,
Proportion
of
exports
of
industrial
goods
to
all
countries
in
1977
(%)
Developing
countries
23.8
32.5
30.6
32.0
European
developing
countries
6.1
5.9
7.2
4.6
Extra-European
developing
countries
(excluding
OPEC)
8.2
15.9
9.2
13.7
OPEC
countries
9.5
10.7
14.2
13.6
PR
China,
Comecon
countries
6.4
5.2
5.9
3.1
Western
industrial
countries
(excluding
EEC)
26.8
15.6
17.5
30~5
EEC
countries
43.0
46.6
46.0
34.4
Sources:
OECD,
Commodity
Trade
Statistics,
Series
C,
1970
and
1977;
calculations
by
DIW.
Netherlands
17.8 4.3 7.5 5.9 2.9 14.1 65.2
Belgium
14.0 2.9 6.4 4.7 2.3 12.3 71.4
-17b-metals, chemical products, textiles and clothing. In purchases from other
western industrial countries, consumer goods (in particular, paper, etc.)
and capital goods are of approximately equal importance.
Exports of goods by the six EEC countries combined increased at the same
rate as imports between 1970 and 1977, _reaching a level of just under
$360 billion in 1977. Exports to the developing countries increased
particularly fast. This trend was due predominantly to the increased
purchasing power of the OPEC countries consequent upon the increase in
oil prices. The export industries of the Federal Republic of Germany
and Italy benefited most £rom the rapidly expanding market in the
petroleum countries, while French industry recorded the lowest growth 13
rate here • In 1977, a third to a half of the EEC countries' exports
to the Third World went to the OPEC countries alone. The growth of
exports to the other developing countries in general remained only
slightly below the average, although these countries had to spend more
foreign currency on petroleum imports. The UK and Italy increased their
sales to the non-petroleum developing countries least; conversely, their
exports to the other EEC countries increased particularly substantially.
13
-18-The EEC countries• exports considt mainly of industrial products. Other
products are important only in deliveries to Community countries. This
applies primarily to foo~ and agricultural products from the Netherlands
and, to a lesser extent, from France. The emphasis in industrial goods
exports is on products of the capital goods industries (especially in the
Federal Republic). In addition to mechanical engineering, motor vehicles
are most strongly represented here, and electrical goods in the Netherlands.
The Netherlands also has substantial exports of chemical products. Italian
exports have the greatest emphasis on consumer goods, with particularly
high proportions for textiles and clothing and leather and skin goods.
Belgian exports have the lowest proportion of capital goods; metals,
mineral products and textiles are strongly represented here.
The export fortes of ~e individual EEC countries also tend to be reflected
in their deliveries to the developing countries, although the emphasis
shifts in favour of chemicals and capital goods. This applies particularly
to exports in the fields of mechanical engineering, electrical goods and
transport equipment other than motor vehicles. Owing to the vigorous policy
of industrialization in the OPEC countries, deliveries to those countries
include a particularly high proportion of capital goods, while chemical
products are much less important here, partly owing to the low significance
of agriculture in this group of countries.
Comparison of the goods structure of exports and imports in trade with the
developing countries shows that the EEC countries export a wide range of
products of the capital goods and chemical industries. In return, they
import from the OPEC countries virtually nothing but qrude oil and from
the mass of the other extra-European developing countries predominantly
other raw materials - in particular, agricultural products. The traditional
complementary division of labour between north and south has therefore
substantially persisted here, although there is a recognizable trend towards
an increased substitutive division of labour. On the other hand, the
exchange of semimanufactures and finished products has already developed
into the predominant form of division of labour with a number of countries
-mainly the most advanced ones·. Today, this still consists substantially
of exchanges of consumer for capital goods. However, reciprocal trade in
goods of the capital goods sectors also increased considerably in the 1970s,
although the goods structures of imports and exports here still differ
-18a-from the developing countries, while capital goods in the strict sense
predominate among exports.
The pattern of the exchange of consumer goods for capital goods and chemical
products in the trade in industrial goods with the Third World is most
pronounced in Germany and the Netherlands, followed by the UK. France and
Italy also have considerable net imports of metals. This applies to an
even greater extent to Belgium, where the division of labour with the
developing countries is characterized mainly by exchanges of goods within
the metals and mineral products sectors and conforms least to the typical
situation.
•
The EEC countries' trade in industrial goods with the other industrialized
countries is characterized more by an intrasectoral than an intersectoral
division of labour. Here again, the Federal Republic has clear comparative
advantages in capital goods and chemicals, this being true, although to a
lesser extent, also of the UK, France and the Netherlands. Conversely,
the emphasis in Italy's net exports is more on the field of consumer goods,
and in the case of Belgium on metals and textiles.
Most trade in industrial products is among the industrialized countries
themselves. For example, in 1977, 80-90% of the EEC countries' imports of
semimanufactures and finished goods came from western industrial countries,
while 60-80% of exports of industrial goods went to this group of countries.
The main group here consisted of the countries of the Community itself,
the only exception being the trade of the UK, which, owing to the continued
close extra-Community ties of this country, is divided roughly equally
between Community countries and the other western industrial countries.
The countries whose trade is most strongly directed towards the EEC are
the Netherlands and Belgium, for which the proportions accounted for by
other regions are correspondingly lower. For instance, the two smallest
of the EEC countries considered here obtained only about 7% of their imports
of industrial goods from the Third World in.1977, while the equivalent
figures for the four large countries were 11-13%. On the export side, the
proportions accounted for by the developing countries are two to three times
-19-4. Macroeconomic employment and income effects of trade with developing
countries
Using the model calculations described, it can be estimated that nearly
14 million employees in the six EEC countries considered (combined) worked
directly or indirectly for exports of industrial goods in 1977. Relative
to total employment, exports were most important in Belgium, more than a
fifth of all employees being engaged on them, and least important in France
(one tenth). In manufacturing industry alone, about two thirds of jobs
depended on exports of industrial goods in the two smaller EEC countries
and more than one third in the four large countries. A corresponding
calculation of the "employment equivalent" of imports as the number of
employees that would be necessary to produce the imported industrial goods
at home yields a figure of nearly 11 million persons for the six countries
together. That is three quarters of the employment effect of exports; only
in the Netherlands, with its high proportion of food exports, was the
number of employees dependent on exports of industrial goods smaller than
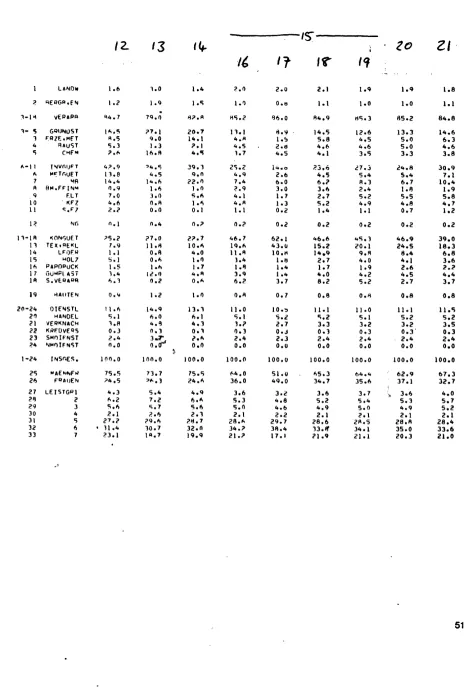
Table 3. Macroeconomic employment effects of trade in ~ .. Justrial goods in the EEC countries in 1977 Germany France Italy UK Netherlands Belgium (FR) Employees dependent on exports Trade with all countries Total thousands of persons 4 053.8 2 164.5 2 409.6 3 476.3 714.8 838.0 % of total employment 16.2 10.1 11.9 13.9 15.9 22.4 In manufacturing industry thousands of persons 3 209.8 1 744.6 2 042.4 2 799.0 632.2 700.5 % of total employment 37.9 31.3 36.2 40.0 62.8 71.6 Employees not required owing to imports Total thousands of persons 2 580.1 2 039.0 1 303.4 2 977.0 909.0 807.0 % of total employment 10.3 9.5 6.4 11.9 19.5 21.5 In manufacturing industry thousands of persons 2 040.4 1 632.6 1 081.2 2 389.3 783.3 680.7 % of total employment 24.1 29.3 19.1 34.2 77.8 69.5 I Trade with developing countries
...
1..0Employees
dependent
on
exports
PI I
-20-In 1977, over 1 million employees in the UK and nearly .:.1 million
employees in the Federal Republic depended on exports to the developing
countries; the equivalent numbers in Italy and France were nearly
700 000, and 120 000 each in the Netherlands and Belgium. This amounted
to 3-4% of total employment in all countries together. In manufacturing
industry alone, some 10% of employees were working on exports to the Third
world, the proportion being as high as 13% in the UK. The number of jobs not required owing to imports of industrial goods from developing countries
amounted in the four large countries to only a third of the employment effect of exports, and to half in the two smaller EEC countries. The
employment effect of the flows of goods in trade in industrial goods
with the Third World is of about the same order of magnitude as their share
of the total trade in industrial goods of the individual EEC countries. The following analysis, which illustrates the employment effects of equal
levels of exports and imports, however, reveals considerable differences
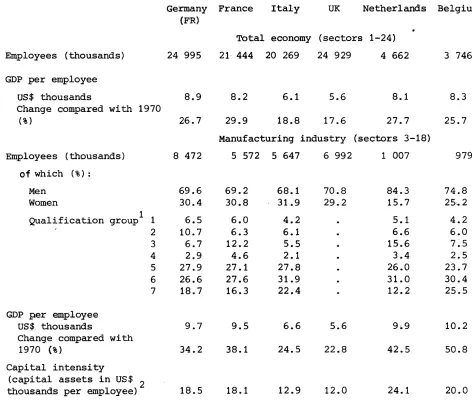
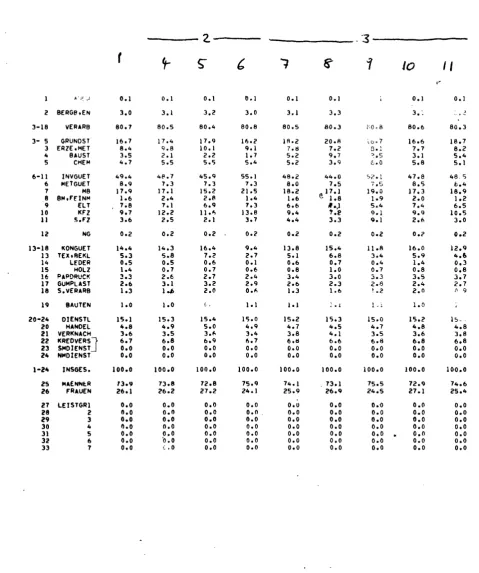
Table 4. Employment and income effects of a US$100 million increase Germany (FR) France 1 in exports of industrial goods Italy UK Netherlands Exports to developing countries Employees (thousands) of which (%) :
Men Women Skilled
workers 2 3 Semiskilled and unskilled workers 8.6
72.2 27.8 58.2 41.7
Fixed capital per employee (US$ thousand) 21 Gross domestic product (US$ million) 82 .~ross domestic product per employee (US$ thousand) 9.6 Employees (thousands) of which (%) :
Men Women
2 Skilled workers 3 Semiskilled and unskilled workers 8.5
70.5 29.5 56.1 43.8
Fixed capital per employee (US$ thousand) 22 Gross domestic product (US$ million) 81 !Gross domestic product per employee (US$ thousand) 9.6 8.9
71.6 28.4 58.6 41.5 21 84 9.4 9.0 68.5 31.5 56.0 44.0 21 84 9.3
11.
1
75.5 24.5 46.6 53.4 16 76 6.8
14.6 73.9 26.1 13 80 5.5
Exports to all countries 11.9 14.4
67.3 32.7 45.4 54.6 14 76 6.4
72.3 27.7 13 80 5.6
6.2
84.9 15.1 60.7 39.3 26 59 9.5 6.4 82.4 17.6 57.7 42.4 27 58 9.1
Belgium
6.0
76.0 24.0 44.4 55.6 23 60 9.9 5.8 72.6 27.4 42.8 57.2 22 55 9.5
1 At 1970 prices, with the goods structure of 1977. 2 Qualification groups 1-5. Source: Calculations by DIW. 3 Qualificatiqn groups 6 and 7.
-20b-Thus the number of persons required to produce export goods for developing
countries worth $100 million (at 1970 prices)14 is highest in the UK, at
14 600, followed by Italy at about 11 100. The equivalent figures for the
Federal Republic and France are 8 600 to 8 900, and for Belgium and the
Netherlands some 6 000 (the lowest) • The differences, where not due to
different export goods structures, are attributable to differing import
intensities and labour productivities. For instance, production in the
two small EEC countries leads directly and indirectly to imports of
intermediate consumption inputs amounting to 40% of the value of exports;
only 60% remains as the contribution to GDP, the employment effect being
correspondingly low. Conversely, in the large EEC countries, 75-85% of
the value of exports is produced at home - the highest proportion being
in France. The high manpower requirements
14
-21-in Italy and, to an even greater extent, -21-in the UK are due ma-21-inly to the
oer
emolo~eelow productivity of labour: the domestic product/generatefi by export
production is only $5 500 in the UK and $6 800 in Italy, compared with
$9 500 to $10 000 in the other countries. It is of the same order of
magnitude as the average product per employee in manufacturing industry
in the individual countries of the EEC.
The results for the production of export goods for deve~oping countries
again reflect the macroeconomic differences between the EEC countries
with regard to use of capital and the breakdown of the employment effect
by qualification groups and sex. Thus the highest capitalization per
employee for exports is recorded by the Netherlands, followed by Belgium,
the Federal Republic and France, where capital intensity is roughly equal; 15
the lowest figures are found in Italy and the UK • The skill level of
the required labour is very high in the Netherlands, the Federal Republic
and France, where the proportion of the employment effect of exports
accounted for by skilled workers is about 60%, compared with only about 45% in Italy and Belgium16• The smallest proportion of women in employment
is recorded in the Netherlands, where i t is about 15%, compared with a
quarter or more in the other EEC countries. The tendency is for women to be proportionately less involved in the production of export goods for
developing countries than in manufacturing industry on average, owing to
the smaller significance of consumer goods.
A comparison between the EEC countries on the basis of the effects of
exports to developing countries on factor requirements and production
-and also on the basis of corresponding averages for manufacturing industry
as a whole (see Table A.1 in the Appendix) - shows that GDP and hence
income-per-employee remaining in the country tends to be higher the higher
the skill level of the labour used and the higher the capital endowment per
job. The wide gap between Italy and the UK and the other countries considered
is particularly striking here. The above-average capital intensity in the
Netherlands and the above-average proportion of semiskilled and unskilled
workers in Belgium, in this connection, are presumably attributable to the
specific factor requirements of individual sectors strongly represented in
the production and exports of these countries (chemicals in the Netherlands
and the metal industry in Belgium) •
-21a-Labour requirements for production for exports to developing countries
differ only slightly from those for exports as a whole. Since the
~ird World's demand on European markets is more strongly directed towards
capital goods and chemical products and less so towards consumer goods
than export demand as a whole, it tends to lead to a somewhat higher skilled
labour requirement, a somewhat higher domestic product per employee and
a higher proportion of male workers.
Much bigger differences emerge if factor requirements in export production
are compared with the factor content of imports. The more the goods
structures of exports and imports differ from each other and the more
different the sectoral production functions are, the greater these
differences. Table 5 shows the effects of $100 million worth of exports
as a multiple of the effects of equal domestic production of imports,
for trade in industrial goods both with developing countries and as a
whole. The table shows that exports and imports in trade with developing
· countries differ firstly in the total number of workers required and
secondly in the structure of the labour input. On average in the EEC
countries, the number of employees required for the production of export
goods is about 10% less than the employment effect of the same level of
imports. The difference is greatest in the Netherlands (16%), while
manpower requirements on both sides are the same in the UK. The proportion
of women in the labour force required for exports averages only about
two thirds of that for imports. The production of export goods also
shows an appreci~ly lower proportion of semiskilled and unskilled
workers - i.e., i t requires more human capital. Fixed capital per employee,
and hence physical capital intensity, is higher in exports than in imports
. th d . th d 1 . tr. 17 Th d t ' d t t d
~n e tra e w~ eve op~ng coun ~es e ames ~c pro uc genera e
in export production is somewhat above the value on the import side, the
product per employee being considerably above the import value; this is
most pronounced in the Netherlands (nearly 30%) and least in the UK.
15
Note that the capital coefficients used here relate to different years.
However, the order of the EEC countries in capital intensity is unaffected. 16
No comparable figures are available for the UK. 17
Except in Belgium owing to high imports of metals from Latin America and
the other, extra-European developing countries. The metal industry is particularly