This is a repository copy of A soil model considering principal stress rotations. White Rose Research Online URL for this paper:
http://eprints.whiterose.ac.uk/125187/ Version: Accepted Version
Proceedings Paper:
Yang, Y, Wang, Z and Yu, H-S (2014) A soil model considering principal stress rotations. In: Hicks, MA, Brinkgreve, RBJ and Rohe, A, (eds.) Numerical Methods in Geotechnical Engineering: Proceedings of the 8th European Conference on Numerical Methods in Geotechnical Engineering. NUMGE 2014: 8th European Conference on Numerical Methods in Geotechnical Engineering, 18-20 Jun 2014, Delft, The Netherlands. CRC Press , pp. 1319-1324. ISBN 9781138001466
© 2014 Taylor & Francis Group, London, UK. This is an Accepted Manuscript of a book chapter published by CRC Press in Numerical Methods in Geotechnical Engineering on 29 May 2014, available online: https://www.crcpress.com/9781138001466
eprints@whiterose.ac.uk https://eprints.whiterose.ac.uk/ Reuse
Items deposited in White Rose Research Online are protected by copyright, with all rights reserved unless indicated otherwise. They may be downloaded and/or printed for private study, or other acts as permitted by national copyright laws. The publisher or other rights holders may allow further reproduction and re-use of the full text version. This is indicated by the licence information on the White Rose Research Online record for the item.
Takedown
If you consider content in White Rose Research Online to be in breach of UK law, please notify us by
1 INTRODUCTION
Many types of loadings in geotechnical engineer-ing can generate the principal stress rotation (PSR) in soil, such as the earthquake, wave and traffic load-ing (Ishihara & Towhata, 1983; Ishihara, 1993; Grabe & Clayton, 2009). Numerous experimental studies indicate that a change of principal stress di-rections, without a change of principal stress magni-tudes, can lead to plastic deformations in soil (Ros-coe et al, 1967; Miura et al, 1986; Gutierrez et al, 1991; Chen & Kutter, 2009). Further, the principal strain increment directions are not coincident with the principal stress directions under the PSR, and this non-coincidence is called the non-coaxiality. Neglecting the PSR induced deformations can lead to unsafe designs, especially the volumetric strain, such as in the study of sand liquefaction. In conven-tional elastoplastic theory, the stress rate generating the PSR and the stress rate not associated with the PSR are treated the same way, so that the soil behav-ior can not be properly simulated under the loading including the PSR. A few elastoplastic constitutive models have been developed to treat the PSR stress rate and non-PSR stress rate separately in their mod-el formulations (Gutierrez et al, 1991; Tsutsumi & Hashiguchi, 2005; Yang & Yu, 2006; Li & Dafalias, 2006). However, some of them can only properly simulate part of aspects involving the PSR, such as the non-coxiality. Some are complicated and not easy to be numerically implemented. This paper aims to develop a soil model which can properly rep-resent all characteristics of soil responses induced by
the PSR in a relatively concise way. For this pur-pose, a well-established kinematic hardening soil model with the bounding surface concept is used a base model (Dafalias & Manzari, 2004). Model sim-ulations with and without the special treatment of PSR stress rate will be compared with test results. Since there are multiple PSRs along different direc-tions in many occasions in geotechnical engineering, attempts are also made to study the impact of multi-ple PSRs.
2 THE ORIGINAL BASE MODEL
The total strain rate d can be broken down into
the elastic e
d and plastic component p
d , which is
composed of p
m
d from the stress rate without the
PSR d m, named as the monotonic loading for
sim-plicity, and the p
r
d from the PSR d r, where the
subscript m and r represent the monotonic loading
and PSR loading hereafter, respectively. e
d and
p m
d can be obtained by the conventional
elasto-plasticity theory. A well-established soil model with the kinematic hardening and bounding surface con-cept is used (Dafalias & Manzari, 2004) as the base
model, which doesn’t consider the PSR. Its
formula-tions are briefly presented in this section, and the de-tails can be found in Dafalias & Manzari (2004). The yield function of model is,
f [(s p ):(sp )]1/2 2/3pm0 (1)
where s and p are deviatoric stress tensor and
confin-ing pressure, respectively. is the back-stress ratio
A Soil Model Considering Principal Stress Rotations
Yunming Yang
Department of Civil Engineering, University of Nottingham Ningbo China, China
Zhe Wang
Department of Civil Engineering, University of Nottingham Ningbo China, China
Hai-Sui Yu
Nottingham Centre for Geomechanics, University of Nottingham, UK
representing the center of yield surface, and m is the radius of yield surface on the deviatoric plane with a
very small constant. p
m
d is given as,
m m
pm m m p
m d
f K L
d R 1 ( )R
(2)
where Lm represents the loading index, Kpm is the
plastic modulus and Rm represents the flow direction.
Kpm is defined as,
) (
) 1 ( 3
2 1/2
0 0
in a t
h pm
p p e c h G p
K (3)
where b is the distance between the current back-stress ratio tensor and bounding back-back-stress ratio
tensor on the bounding surface. G0, h0 and ch are the
plastic modulus model parameters. Rm is defined as,
I n ( )I
3 1 3
1
d
m A
D
n
Rm (4)
where n represents the normal to the yield surface on
the deviatoric plane, and Dm is the dilatancy ratio. d
is the distance between the current back-stress ratio
tensor and dilatancy back-stress ratio tensor, and Ad
is a dilatancy model parameter.
The model is first used to predict stress-strain re-sponses of Toyoura sand under drained conditions, in which several typical stress paths are studied. One is the monotonic loading paths (F paths) in which monotonic loadings are applied at different angles with the horizontal bedding plane (Miura et al, 1986). This is also used to calibrate model parame-ters. Another loading path is the pure PSR path (R paths), in which the stress ratio (at)/(at)is
chosen to be 0.5 (R1) and 0.6 (R2), respectively (Miura et al, 1986). The third loading tests are per-formed by Gutierrez et al (1991), in which the non-coaxiality is measured at different mobilized fric-tional angles. In all those tests, the confining pres-sure remains constant at 98 kPa, and b remains con-stant at 0.5. Figure 1 shows the tests results and model predictions for the monotonic tests, and a rea-sonably good agreement is achieved. It is noted that
this model doesn’t consider the role of fabric aniso
t-ropy, and its simulations are intended to fit the aver-age of all tests results along different loading direc-tions. Table 1 shows the model parameters calibrated in the monotonic loading test.
Figure 2 shows the evolutions of various strain components including the volumetric strain with ro-tational angles of principal stress in tests results and predictions for the PSR path R1. Figure 3 shows the tests results and predictions for the PSR path R2,
starting at 2=1800. Figure 2 shows a reasonably
good agreement between the test results and predic-tions in the PSR path R1, except for the radial strain, which is much smaller than other strain components and can be neglected. However, Figure 3 shows the discrepancy between the predicted and measured re-sults is much larger in R2 than in R1, especially for the shear strain and volumetric strain. The predicted
[image:3.595.305.556.110.611.2]volumetric strain is much smaller than that measured in the test.
Table 1. Model parameters in the original and modi-fied models for Toyoura sand (the first line) and Ne-vada sand (the second line)
original model
elasticity critical state Y.S.
G0 v M c c e0 m
125 0.25 1.25 0.712 0.019 0.934 0.7 0.01
150 0.2 1.45 0.689 0.0052 0.807 0.5 0.01
plasticity dilatancy modified model
h0 ch nb A0 nd h0r
r
Ar
15 0.968 1.1 0.8 0.9 10 1.5 0.4
5.5 0.968 0.55 0.6 3.5 0.9 1.1 0.18
Figure 1. Test results and model predictions of the monotonic loadings in Miura et al (1986) for Toyoura sand (F denotes the angle of loading).
It is because the stress ratio in R2 is close to dilatan-cy surface or the phase transformation line, which results in a smaller predicted volumetric contraction. If the PSR occurs at a stress ratio a little higher than that in R2 or above the phase transformation line ((at)/(a t)=0.65), the volumetric expansion
directly controls the generation of pore water pres-sures. The discrepancy is understandable as the
model doesn’t distinguish the PSR and non-PSR
stress rate, and all the model parameters are calibrat-ed in the monotonic loadings. Figure 4 shows the predicted and measured non-coaxiality at various mobilized friction angles, and they are in a very good agreement. The larger the mobilized friction angle is, the smaller the non-coaxiality becomes. This is because, according to the projection rule of the bounding surface concept used in this model and many other kinematic models, the direction of plas-tic flow on the deviatoric plane gets closer to that for the principal stresses at a higher stress ratio when it approaches the bounding surface.
Figure 2. Test results and predictions of PSR loadings R1 in Miura et al (1986) with the original base model and the modi-fied new model (eps-a: axial strain; eps-t: circumferential strain; eps-r: radial strain; eps-at: shear strain; eps-v: volumetric strain).
The model is also used to reproduce stress-strain responses of Nevada sand with three stress paths in hollow cylinder tests. The first one is the drained tri-axial compression with various initial confining pressures and relative densities. In the second path called the torsional shear, the soil specimen is first subjected to drained triaxial extension loading with
K0=1.38, followed by a cyclic loading of shear stress
under undrained conditions until liquefaction occurs.
Because the loading starts with the initial anisotropic
condition and the effective confining pressure can’t
reach zero, and the liquefactions manifest them-selves through large deformations. In the third path called the rotational shear, the soil is subjected to continuous principal stress rotations under undrained conditions. Figure 5 shows typical test results and simulations under triaxial compressions, and they are used to calibrate model parameters, shown in Table 1. Figure 6 and 7 show the test results and model simulations under the second and third stress paths. These two figures indicate that the model predictions are unable to bring the soil to liquefactions.
Figure 3. Test results and predictions of PSR loadings R2 in Miura et al (1986) and the volumetric strain for the additional stress ratio (0.65) with the original base model and the modi-fied new model
3 THE MODIFIED MODEL WITH THE PSR
In the modified model, the stress rate component generating the PSR is treated independently. One can refer to Yang & Yu (2012) for detailed descriptions, and a brief description is presented in this section.
p r
d generated from d ris given as,
r r pr
r r p
r d
f K L
d R 1 ( )R
[image:4.595.307.549.212.583.2]r in a t h r pr p p e c h G p K n n b : ) ( : ) 1 ( 3
2 1/2
0
0 (6)
where Lr is the loading index, Kpr plastic modulus
and Rr flow direction from the PSR. h0r and r are
new model parameters for the PSR plastic modulus. The PSR plastic modulus is similar to that for the
monotonic loading except the addition of r. ris
generally larger than unity, which makes Kpr more
sensitive to the stress ratio.
Figure 4. Measured and predicted non-coaxiality for the PSR loadings at various stress ratios in Gutierrez et al (1991)
Rr is defined as,
I 1- I
b r r r r
r D A
3 1 3 1 n n
R (7)
where Dr is the dilatancy ratio, and Ar is the
dilatan-cy model parameter for the PSR loading. and
b
are the amplitudes of back-stress ratio and
bound-ing back-stress ratio. nr can be approximated to be n
in many cases. The determination of Dr uses the
pos-tulate for the PSR dilatancy rule by Gutierrez et al (1991). Thus, three new PSR related model parame-ters are used in the modified model. They are inde-pendent of the monotonic loading, and can be easily obtained through pure PSR loading paths at different stress ratio levels.
The final task is to determine d r. It is first
de-termined in two dimension (x, y), denoted with .
It can be expressed as d N d
r r
, written in a ma-trix form as,
xy y x J xy J xy y x J xy y x J xy y x J y x J y x J xy y x J y x J y x rxy ry rx d d d t t t t t t t t t d d d 2 2 2 2 2 1 4 ) ( 4 ) ( 2 ) ( 8 ) ( 2 1 8 ) ( 2 1 2 ) ( 8 ) ( 2 1 8 ) ( 2 1 (8)
where 2 2
4 / )
( x y xy
J
t . Similarly, in the space
(y, z) denoted with and (z, x) with , they can be
expressed as d r Nrd and d r Nrd .
Combin-ing d r , r
d and d r , letting
rx d rx d rx
d ,
ry d ry d ry
d and drzdrz drz , one can obtain
r
d in the general stress space,
d Nd
r
r (9)
Figure 5. Test results and model predictions of the monotonic loadings in Chen & Kutter (2009) for Nevada sand
The total stress increment can be expressed as,
( ) ( rp)
p m p d d d d d
d E E (10)
where E represents the elastic stiffness tensor. Using mathematical manipulations and the relationship
ENr 2GNr (11)
One can obtain,
d Eepd
(12) lER lE ER R lN lN ER lER lE ER R lN lN ER E E p r r r r r pr r r pr r ep K B K K
B ( )( ) ( )( ) ( )(* ) ( )( )
* 2 * * 1 (13) Nr 2GNr
* (14) 1 * * 1 r pr p r r pr r K K K B lER lER R lN R lN (15) 1 * * 2
l E R l E R
R lN R lN p r pr r r r pr K K K
B (16)
These equations indicate that the stiffness tensor is independent of stress increments, and the stress and strain increments have a linear relationship. In these
[image:5.595.303.552.63.465.2] [image:5.595.32.271.176.356.2]will be downgraded to the formulations in the classi-cal plasticity.
Figure 6. Test results and model predictions of the torsional shear tests in Chen & Kutter (2009)
Figure 7. Test results and model predictions of the rotational shear tests in Chen & Kutter (2009)
Figures 2 and 3 show the drained predictions us-ing the modified model for the tests in Miura et al (1986). These figures indicate that the new predic-tions have overall better agreements with the test re-sults than the original predictions, especially for the shear and volumetric strains. Figures 6 and 7 show
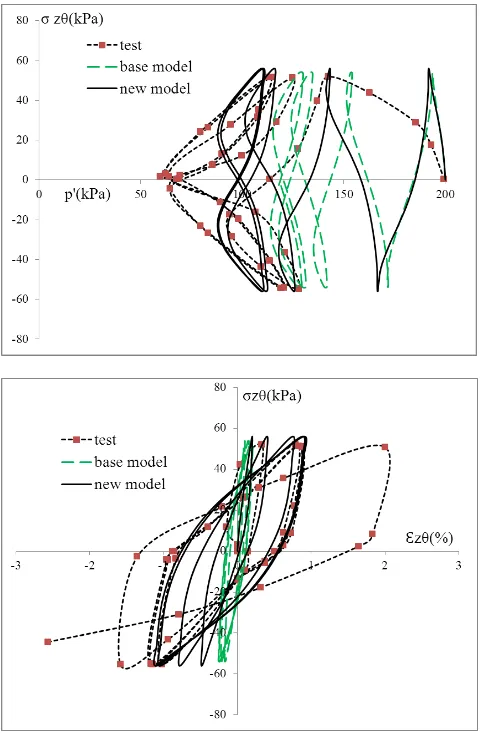
the new undrained predictions for Nevada sand, and they are able to reproduce the liquefaction, reflected by the large displacements.
Figure 8. Predicted pore water pressure and axial strain with different ratios of shear amplitudes in two PSRs
The model performances with two PSRs along different directions are also studied. The tests by Miura et al (1986) are used as a reference. Its initial
isotropic confining pressure is 98 kPa, andxis
in-creased to 196 kPa under the drained condition. The
cyclic shear stresses xy and xzwith different
am-plitudes are then applied under undrained conditions.
xz
is one quarter of a cycle later than xy. The
am-plitude of major shearxy is always 10 kPa, and
three cases of minor shearxz are considered with
their amplitudes of 0, 5 and 10 kPa, giving the ratio of shear amplitudes of 1:0, 2:1, 1:1, respectively. Figure 8 shows the predictions of pore water pres-sures and axial strains by using the modified and original model. There is not a sudden increase of strains in all these three loading cases, and therefore
the liquefaction doesn’t occur by using the original
[image:6.595.32.273.69.436.2] [image:6.595.306.539.80.444.2] [image:6.595.32.274.482.670.2]4 CONCLUSION
The paper first discusses the capability of a well-established kinematic hardening soil model in pre-dicting stress-strain responses of soil under the PSR. It can predict the non-coaxiality very well, but its prediction of volumetric and shear strains is the poorest. The model is modified to independently treat the stress rate component generating the PSR. An additional flow rule and plastic modulus for the PSR stress rate are used, and the predictions are im-proved, especially for the shear strain component and volumetric strain. One important feature of the model is that it is developed in the general stress space with six stress variables, and it can take into account multiple PSRs. Another feature is that it re-tains the linear stress rate-strain rate relationship. Soil responses under multiple PSRs are also studied, and they can bring soil to failure faster than one PSR.
5 PREFERENCES
Chen, Y.R., Kutter, B.L. (2009), Contraction, dilation, and fail-ure of sand in triaxial, torsional, and rotational shear tests, Journal of engineering mechanics, 135(10), 1155-1165 Dafalias, Y.F. & Manzari, M.T. (2004), Simple plasticity sand
model accounting for fabric change effects, Journal of En-gineering Mechanics, ASCE, 130(6), 622-634
Grabe, P.J. & Clayton, C.R.I. (2009), Effects of principal stress rotation on permanent deformation in rail track founda-tions, Journal of Geotechnical and Geoenvironmental En-gineering, ASCE, 555-565
Gutierrez, M., Ishihara, K. & Towhata, I. (1991), Flow theory for sand during rotation of principal stress direction, Soils and foundations, 31(4), 121-132
Ishihara, K. & Towhata, I. (1983), Sand response to cyclic rota-tion of principal stress direcrota-tions as induced by wave loads, Soils and Foundations, 23(4), 11-26
Ishihara, K. (1993), Liquefaction and flow failure during earth-quakes, Geotechnique, 43(3), 351-415
Li, X.S. & Dafalias, Y.F. (2004), A constitutive framework for anisotropic sand including non-proportional loading, Ge-otechnique, 54(1), 41-55
Miura, K., Miura, S. & Toki, S. (1986), Deformation behavior of anisotropic dense sand under principal stress axes rota-tion, Soils and Foundations, 26(1), 36-52
Roscoe, K.H., Bassett, R.H. & Cole, E.R.L. (1967), Principal axes observed during simple shear of sand, Proceedings of the Geotechnical Conference, Oslo, 231-237
Tsutsumi, S. & Hashiguchi, K. (2005), General non-proportional loading behavior of soils, International Jour-nal of Plasticity, 21, 1941-1969
Yang, Y. & Yu, H.S. (2006), A non-coaxial critical state model and its application to simple shear simulations, Internation-al JournInternation-al for NumericInternation-al and AnInternation-alyticInternation-al Methods in Geo-mechanics, 30, 1369-1390