This is a repository copy of Employee trust and workplace performance. White Rose Research Online URL for this paper:
http://eprints.whiterose.ac.uk/76622/
Monograph:
Brown, S., McHardy, J. and Taylor, K. (2013) Employee trust and workplace performance. Research Report. Department of Economics, University of Sheffield ISSN 1749-8368
[email protected] https://eprints.whiterose.ac.uk/
Reuse
Unless indicated otherwise, fulltext items are protected by copyright with all rights reserved. The copyright exception in section 29 of the Copyright, Designs and Patents Act 1988 allows the making of a single copy solely for the purpose of non-commercial research or private study within the limits of fair dealing. The publisher or other rights-holder may allow further reproduction and re-use of this version - refer to the White Rose Research Online record for this item. Where records identify the publisher as the copyright holder, users can verify any specific terms of use on the publisher’s website.
Takedown
If you consider content in White Rose Research Online to be in breach of UK law, please notify us by
Employee Trust and Workplace Performance
Sarah Brown
Jolian McHardy
Karl Taylor
ISSN 1234-5678
SERP no. 2013012
September 2013
Employee Trust and Workplace Performance
Sarah Brown*, Jolian McHardy, and Karl Taylor
Department of Economics University of Sheffield
9 Mappin Street Sheffield S1 4DT
Abstract: We explore the relationship between employee trust and workplace performance. We present a theoretical framework which serves to establish a link between employee trust and firm performance as well as to identify possible mechanisms through which the relationship may operate. We then analyse matched workplace and employee data in order to ascertain whether the average level of employee trust within the workplace influences workplace performance. We exploit the 2004 and 2011 Work Place and Employee Relations Surveys (WERS) to analyse the role of employee trust in influencing workplace performance in both pre and post recessionary periods. Our empirical findings support a positive relationship between three measures of workplace performance (financial performance, labour productivity and product or service quality) and employee trust at both points in time. We then exploit employee level data from the WERS to ascertain the determinants of employee trust as well as how trust is influenced by measures taken by employers to deal with the recent recession. Our findings suggest that restricting paid overtime and access to training potentially erode employee trust. In addition, we find that job or work reorganisation experienced at either the employee or organisation level are associated with lower employee trust.
Key Words: Employee Trust; Financial Performance; Labour Productivity; and Product Quality.
JEL Classification: J20; J50
Acknowledgements: We are grateful to the Data Archive at the University of Essex for supplying data from the 2004 and 2011 Workplace and Employee Relations Surveys. We are also grateful to Anita Ratcliffe, Jennifer Roberts and participants at the Work and Pensions Economics Group Annual Conference, University of Sheffield, July, 2013, for excellent comments. The normal disclaimer applies.
*Corresponding author.
1. Introduction and Background
Given the importance of identifying determinants of firm performance for understanding both
economic growth and productivity at an aggregate level, it is not surprising that a vast
literature exists exploring this issue focusing on a range of measures of firm performance
such as financial performance (see, for example, Machin and Stewart, 1990, McNabb and
Whitfield, 1998, and Munday et al., 2003) and labour productivity (see, for example,
Griliches and Regev, 1995, Oulton, 1998, and Griffiths and Simpson, 2004). Many of the
studies in this area focus on the role of firm level characteristics such as capital and labour
inputs in determining firm performance.
It is apparent that employee behaviour may influence firm level performance given
that many employees have some degree of discretion with respect to how hard they work
(see, for example, Brown et al., 2011, who explore the relationship between worker
commitment and workplace performance). In this paper, we focus on employee trust, which
has attracted limited interest in the economics literature. Trust can be defined as ‘firm belief
in the reliability, truth, or ability of someone or something’ (Oxford English Dictionary,
2013). It may be the case that employee trust in the workplace influences the behaviour of
employees, which in turn affects firm performance. In particular, the extent to which
employees trust that their managers will treat them honestly and fairly may influence the
extent to which employees engage in opportunistic behaviour or otherwise. Thus, the degree
of trust that employees have in their managers may impact upon firm performance.
The role of trust in the economy is being increasingly recognised in the economics
literature at both the macroeconomic level, where there has been debate, for example, on the
relationship between trust and economic growth (see, for example, Knack and Keefer, 1996,
and, more recently, Algan and Cahuc, 2010) and at the microeconomic level, such as in the
relationship between trust and stock market participation). A recent and comprehensive
survey of the literature is provided by Algan and Cahuc (2013). There are an increasing
number of studies in the economics literature exploring the determinants of trust at the
individual level frequently using the standard trust question from the World Values Survey
and the General Social Survey: Generally speaking would you say that most people can be
trusted or that you can’t be too careful in dealing with people? (see, for example, Alesina and
La Ferrara, 2002, and Bellemare and Kröger, 2007). There has also been some interest in the
applied psychology and human resource management literatures, which have tended to
explore the effects of specific workplace practices on employee trust. For example, Mayer
and Davies (1999) explore the effects of a performance appraisal system in one particular
workplace, whilst Blunsdon and Reed (2003), using Australian workplace data, find
significant correlations between HR practices (such as having formalised policies and
procedures) and employee trust in management. There is also some evidence that the degree
of autonomy workers have over their work is associated with increased general trust, see
Grund and Harbring (2009) for European evidence.
There has been less attention paid in the economics literature, however, to the role of
employee trust in the workplace and its implications for firm performance. One interesting
exception is La Porta et al. (1997), who explore Fukuyama’s (1995) argument that high levels
of trust amongst individuals serve to enhance the performance of all institutions in society
including firms. They explore the effect of trust on the performance of large organisations in
40 countries. The relative success of large firms in a country is measured by the sales of the
large firms relative to GNP, where a large positive effect from general trust is found. A recent
contribution in the finance literature by Goergen et al. (2012) focuses on the implications of
intra-firm trust for firm performance and reports empirical evidence of a positive relationship.
communication, profit-sharing, internal promotion, staff turnover and training. Such
measures serve to capture the degree of intra-firm trust somewhat indirectly rather than
employee trust per se. It is apparent that analysis of matched employee and firm level data
may be a fruitful line of enquiry in order to shed further light on the relationship between
firm performance and trust by exploiting more direct measures of employee trust.
This paper seeks to fill this gap in the existing literature. We begin, in Section 2, by
developing a theoretical framework which establishes a link between employee trust and firm
performance as well as indicating possible mechanisms through which the relationship may
operate. In Section 3, we analyse matched workplace and employee data in order to explore
whether employee trust influences workplace performance. To explore the robustness of our
empirical findings, we exploit the 2004 and 2011 Work Place and Employee Relations
Surveys (WERS) in order to analyse the role of employee trust in influencing workplace
performance in both pre and post recessionary periods. Our empirical findings support a
positive relationship between three measures of workplace performance (financial
performance, labour productivity, and product or service quality) and employee trust. In
Section 4, we exploit employee level data in order to ascertain the determinants of employee
trust to shed some light on how such trust is influenced in the workplace. Section 5 concludes
the paper.
2. Theoretical Model
In this section we seek to establish a theoretical basis for our hypothesis of a link between
employee trust and firm performance and to outline possible mechanisms through which the
relationship may operate. We begin by observing that each of our measures of firm
performance (financial performance, labour productivity and service or product quality) can
be enhanced by, amongst other things, eliciting greater employee effort, engagement with
on principal-agent arguments to illustrate how higher levels of employee trust in managers
can help explain improvements in each of these firm performance-enhancing factors.
The principal-agent problem concerns a principal (here the manager), who wishes to
incentivise the agent (here the employee) to undertake an action that is, or may appear to the
agent to be, against their own best interests. We begin by outlining a typical characterization
of the principal-agent problem.
Consider an agent with action set , whose choice of action affects
the value of output, and their own costs, , where . Let be the principal’s
preferred action. Further, assume the principal is unable to observe the agent’s action (there is
asymmetric information), or infer it from observing output (i.e. is not one-to-one). Since
action is costly to the agent and unobservable to the principal, the principal knows the
agent will have an incentive to select action, .
To simplify matters, let be an n-vector of feasible values of ( ). Let
be an n-vector of probabilities, with each element, , being the probability
that is observed given the agent’s action is . Given that the principal employs a payment
contract , we construct the following – linear in cost – von Neumann-Morgenstern
utility function, , for the agent, whom we assume to be risk-averse. We
assume that the principal is risk-neutral, and that their objective is to design a payment
contract to maximize subject to the agent’s incentive compatibility
constraint:
, (1)
and participation constraint, with reservation utility, :
. (2)
We now explore three framings of the principal-agent model to illustrate the potential
us to see how trust can be used to elicit performance-enhancing effort, the second provides
insight into how trust can engender participation and co-operation or reduce costly resistance
to productivity/quality enhancing change, whilst the third demonstrates how trust can
influence worker identity.
2.1 Trust Eliciting Effort1
In this section we let the elements H and L in the agent’s action set represent high ( ) and
low ( ) effort. We also augment the basic model outlined above to include trust. We begin
under a scenario in which the agency problem yields an equilibrium with the agent choosing
action L. As such it is reasonable to assume that the agent knows, through experience, the
rewards and costs associated with action L. The principal, in an effort to resolve the agency
problem, wishes to assure the agent that the costs to action H are no greater than and that,
given this, the contract that it offers, , satisfies the constraints Eqs. (1) and (2).
However, the agent, who has no experience of the actual rewards and costs associated with
action H, may not trust the principal to keep to the contract, and/or, be truthful about the full
costs of action H. Hence the agent has beliefs, , about the distribution of returns and
beliefs, , about the costs, under action , such that and ,
where , represents the level of employee trust, and .
Hence, even if the principal can design a feasible reward contract which satisfies Eqs.
(1) and (2), if employee trust, , is sufficiently low then it will not be possible to resolve the
principal-agent problem. Consequently, since the discount parameters and are
non-decreasing, higher levels of trust can increase the prospect of a given contract resolving the
agency dilemma, yielding effort level H and raising productivity, quality and/or financial
performance.
1
Notice that, given the agent is risk averse, is decreasing with uncertainty.
Hence, higher levels of employee trust can act as a buffer helping to mitigate the effects of
increased uncertainty (for instance during a recession), by increasing and hence
2.2 Trust Inducing Engagement with Training and Re-organisation
In this section we adopt a slightly different principal-agent framework. In this case the
principal can directly observe the action of the agent where H and L now refer, respectively,
to high and low levels of investment/engagement in labour training, firm re-organisation or
changes in working practices (or conversely low and high levels of resistance to training or
re-organisation). Again, the principal’s preferred action is H.
Suppose that the principal wishes to uplift worker skills and/or reconfigure working
practices or the working environment so as to achieve a new, more profitable, organizational
regime. For simplicity, suppose that the principal can only achieve this new regime in a
future period if the agent undertakes action H (high engagement with training and/or low
resistance to change) in the current period. Otherwise, the status quo prevails. Hence we have
two regimes , where represents the new regime and represents the status quo.
With no asymmetry in information about the action of the agent, the principal can set
a determinate reward profile for the agent where is the wage and is the
working environment associated with regime . The principal’s objective is therefore to
design a reward profile so as to maximize subject to an optimality
constraint:
(3)
where is the time-adjusted value of the cost of the organizational change and/or training; an
agent incentive compatibility constraint:
where, is the time-adjusted cost to the agent of the organizational change and/or training;
and a participation constraint, with reservation utility, :
. (5)
However, in the absence of trust the agent may heavily discount the claims of the principal in
terms of the wage and working conditions in the new regime, or anticipate a significant
understatement of the direct costs to the agent of undertaking action H, i.e. the agent may
base its decisions on and instead of and .2 Hence, even if the
principal can devise a feasible reward profile which satisfies Eqs. (3)-(5), if trust is
sufficiently low (i.e. and/or are sufficiently high) then the principal may not be able to
find a reward profile which incentivizes the agent to opt for action H. Again, increasing
employee trust increases the range of contracts which are feasible and satisfy Eqs. (4) and (5)
thereby engendering the high-performance outcome for the firm.
2.3 Trust to Change Worker Identity
Finally, we consider the possibility that building employee trust can yield a change in worker
identity along the lines discussed in Akerlof and Kranton (2005). In this case, the agent’s
utility depends on their identity where agent identity is a function of organizational practices,
or more specifically in the present situation, organizational practices which influence
employee trust.
To illustrate, suppose the agent can have one of two identities, . An agent
with identity x (y) has an associated ‘norm’ under which utility is maximized, in terms of the
principal’s preferred (non-preferred) action in the above models, with action H (L) and
deviation from this action results in loss of utility.3 If the agent’s identity is x then the
2
It is not difficult to see that an employer might have an incentive to cheat on the agent once the agent has undertaken the productivity-enhancing training (especially if training develops firm-specific human capital) or given up their original work-practices, since these changes may be largely irreversible.
3
principal can stimulate action H at a lower wage than if agent identity is y. Replacing the cost
term in Eqs. (1) and (2) with:
where is the agent’s cost under action , represents the utility that the agent
achieves with identity , whilst is a potential penalty incurred due to any
divergence from the agent’s ‘ideal’ action given they have identity . Hence investing to
build employee trust to influence worker’s identity – changing worker identity from type y to
type x – reduces the penalty associated with action H, raising . Since both effects diminish
the ‘net cost’ term, enhancing relative to they increase the
likelihood of H relative to L.
Having motivated the link between employee trust and workplace performance from a
theoretical perspective, and identified potential mechanisms through which this may operate,
the remainder of the paper considers whether an empirical relationship exists between trust
and performance using matched employee-employer data.
3. Empirical Analysis of the Relationship between Trust and Workplace Performance
3.1 Data and Methodology
In order to explore the relationship between employee trust and workplace performance from
an empirical perspective, we analyse data drawn from the Workplace and Employee
Relations Surveys (WERS). The aim of the WERS is to provide nationally representative data
on the state of workplace relations and employment practices in Britain. We focus on data
drawn from the most recent survey, namely the 2011 WERS, which is the sixth in the series.
We also explore the robustness of our findings by analysing the 2004 WERS, which relates to
the pre financial crisis period and, hence, allows us to explore whether the relationship
between employee trust and workplace performance varies with the prevailing economic
with at least 5 employees.4 The sample for the 2011 WERS comprises 2,680 workplaces,
with the sample used in the econometric analysis discussed below being reduced to 1,550
workplaces, once missing values are taken into account. For the 2004 WERS, the sample
comprises 2,295 workplaces, with the sample used for our econometric analysis including
1,432 workplaces due to missing data. The WERS comprises four main sections: the Worker
Representative Questionnaire; the Financial Performance Questionnaire; the Management
Questionnaire; and the Employee Questionnaire. The first three sections yield establishment
level information, whilst the final section (the Employee Questionnaire) provides employee
level information. Our empirical analysis exploits data drawn from the Management and
Employee Questionnaires.
We conduct workplace level analysis in order to explore the determinants of three
measures of relative workplace performance, namely: financial performance, labour
productivity and the quality of service or product. The workplace performance measures are
derived from the following question included in the Management Questionnaire: I now want
to ask you how your workplace is currently performing compared with other establishments
in the same industry. How would you assess your workplace’s (i) financial performance (ii)
labour productivity and (iii) quality of product or service? The management representative
was asked to indicate in which of the following categories financial performance (FP ), w
labour productivity (LP ) and quality of product or service w ) lay: (i) a lot better than
average; (ii) better than average; (iii) about average; (iv) below average or a lot below
average, where w denotes the workplace subscript.
From the responses to these questions, we have constructed three four-point indices
where a value of 3 denotes ‘a lot better than average’, a value of 2 denotes ‘better than
average’, a value of 1 denotes ‘about average’ and a value of zero denotes ‘below or a lot
4
below average’. The distributions of each of the three measures of workplace performance are
given in the table below.
Workplace performance: % in each category
w
FP LPw
% 2004 2011 2004 2011 2004 2011
A lot better than average 11.45 13.09 6.94 9.22 22.41 25.81
Better than average 41.08 39.56 42.05 43.68 55.17 52.44
About average 38.93 40.07 44.90 41.76 19.99 19.67
Below average 8.54 7.29 6.11 5.34 2.43 2.08
These measures of firm performance are clearly subjective and, in addition, the response
rates, which are relatively consistent across 2011 and 2004, also suggest that bias exists
towards responding in the average and above categories.5 It may be the case that the three
workplace performance variables are subject to measurement error (see Bertrand and
Mullainathan, 2001, and Forth and McNabb, 2008). Random measurement error makes it
difficult to explain variations in workplace performance, whilst if the measurement error is
correlated with the explanatory variables, this leads to spurious correlation with the
subjective dependent variables (Brown et al., 2011). Such issues will arguably be mitigated
since the data relating to the key explanatory variables of interest are provided by employees
(i.e. trust, which, as discussed in detail below, is elicited from responses to the Employee
Questionnaire) whereas the subjective workplace performance measures are provided by
management representatives. Less correlation is expected, therefore, between the
measurement error in the measures of workplace performance and the key explanatory
variables.6
5
In the Financial Performance Questionnaire, continuous measures of workplace financial performance, such as sales turnover, are available. However, the sample sizes are greatly reduced (roughly 25 per cent of firms remain for the 2004 WERS), which is likely to lead to a non random sample. Furthermore, Chaplin et al. (2005) state that a relatively high percentage of workplaces declined to take part in this section of the 2004 WERS, with a lower average response rate reported for those firms listed on the stock exchange. Similarly, the response rate for this part of WERS 2011 was somewhat low at 31.8%, providing information on up to only 545 workplaces (van Wanrooy et al., 2013). Consequently, in what follows, we do not analyse the continuous measures of firm performance.
6
The measures of employee trust are derived from the Employee Questionnaire. In the
2011 and the 2004 WERS, up to 25 employees from each workplace were asked to complete
the Employee Questionnaire yielding samples of 18,492 employee-workplace observations in
2011 and 17,532 in 2004, after conditioning on missing data. The Employee Questionnaire
contains information on a number of different measures of employee trust. To be specific,
employees were asked to indicate whether they strongly agree, agree, neither agree nor
disagree, disagree or strongly disagree with the statements: Managers here can be relied
upon to keep their promises ( ); Managers here deal with employees honestly ( );
Managers here treat employees fairly ( ); and Managers here are sincere in attempting to
understand employees’ views ( ). The responses to these four questions are used to create
four trust indices which are increasing in the level of employee trust and run from one
(strongly disagree) to five (strongly agree). We then match averages of the trust measures in
each work place ( and with the workplace performance information to explore
how the average level of employee trust prevailing in the workplace is correlated with
workplace performance. Due to the possibility of co-linearity between the four employee
trust measures, they are included independently rather than simultaneously in the
specification.7 Hence, four ordered probit specifications are modelled for each of the three
measures of workplace performance conditional on each alternative measure of employee
trust, , and other explanatory variables, , as follows:8
(6)
where the unit of analysis is the workplace, w=1,…,W, (in WERS 2011 W=1,550 and in
WERS 2004 W=1,432) in which the continuous latent performance of the workplace, , is
observed in discrete form through a censoring mechanism: if , with j
produce similar results (Forth and McNabb, 2008). Similar evidence is reported by Wall et al. (2004), who explore the validity of subjective measures of firm performance.
7
Indeed, the pairwise correlation coefficients between the four measures of trust are all above 0.7 and are all statistically significant at the 1% level.
8
outcomes and the ’s are unknown parameters to be estimated. Hence, the probability that
alternative j is chosen is the probability that the latent variable, , is between two
boundaries and .
It is interesting to note that, as shown in the table below, the average level of
employee trust within the workplace, i.e. where there are i=1,…,N
employees in workplace w, is similar in the post (2011) and pre (2004) financial crisis
periods. In addition, it is interesting to note the similarity in the mean values of the four
measures of employee trust.
WERS 2011 Mean (Standard Deviation)
WERS 2004 Mean (Standard Deviation) 3.3273 (0.6030) 3.2972 (0.5950) 3.4779 (0.5848) 3.4627 (0.5753) 3.4665 (0.5921) 3.4642 (0.5814) 3.4357 (0.6099) 3.3991 (0.5771)
Number of Observations 1,550 1,432
In each of the ordered probit models of workplace performance, controls in the vector
include: trade union density; firm size; industry (distinguishing between: manufacturing;
electricity, gas and water; construction; wholesale and retail; hotels and restaurants; transport
and communication; financial services; other business services; public administration;
education; health; and other community services); years in operation; the average amount of
training provided to employees; the proportion of experienced staff in the largest
occupational group who had training in past year; the percentage of employees using
computers; whether the workplace competes at the regional (the omitted category), national
or international level; and the percentage of employees by occupation (distinguishing
between: managers and senior officials; professional; associate professional and technical;
administrative and secretarial; skilled trades; caring, leisure and other personal service; sales
3.2 Results
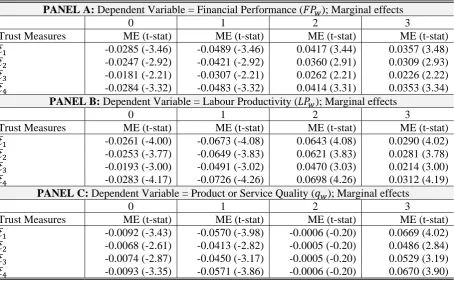
Table 1a presents the marginal effects relating to the effects of the employee trust measures
on each category of the workplace performance measures for the 2011 WERS, whilst Table
1b presents the analogous results for the 2004 WERS.9 Focusing initially on Table 1a, it is
apparent that, for financial performance and labour productivity, trust is inversely related to
being in the ‘about average’ and ‘below average’ categories and positively associated with
being in the ‘a lot better than average’ and ‘better than average’ categories. So higher levels
of employee trust (across all four measures of employee trust) appear to be positively related
to workplace financial performance and labour productivity. With respect to product or
service quality, employee trust is positively associated with being in the ‘a lot better than
average’ category and inversely associated with being in the other three categories, the
positive influence on the probability of reporting the highest level of this measure of
workplace performance being particularly pronounced in terms of magnitude. For example,
focusing on Table 1a panel c, it is evident that each alternative measure of trust, evaluated at
the mean, increases the probability that product or service quality is ‘a lot better than average’
by approximately 8 to 9 percentage points.
Turning to Table 1b, it is evident that the pattern of the results is consistent across the
2011 and the 2004 WERS thereby endorsing the finding that employee trust is positively
associated with higher levels of workplace performance. There are, however, some
differences across the two years in terms of the magnitude of the effect of employee trust on
workplace performance. For example, with the exception of (Managers here are sincere in
attempting to understand employees’ views), the positive effect of employee trust on the
9
probability of reporting the highest category for the financial performance measure (i.e. being
‘a lot better than average’) is higher in 2011 than in 2004. Similarly, and again with the
exception of , the positive effect of employee trust on the probability of reporting the ‘a lot
better than average’ category for the quality of product or service measure is considerably
higher in 2011 as compared to the effect in 2004 by around 2 to 4 percentage points. The
largest differential in terms of magnitude is for whether managers are deemed to treat
employees fairly, , at 4.2 percentage points. Conversely, the positive effect of employee
trust on the probability of reporting the ‘better than average’ category for labour productivity
is much higher in 2004, i.e. pre the economic recession, than in 2011.
Overall, our findings, which support the existence of a statistically significant
relationship between employee trust and workplace performance, with high levels of
employee trust in their managers being associated with higher levels of relative workplace
performance, are consistent with our theoretical priors. Moreover, these findings are robust
across four different measures of employee trust and three different measures of workplace
performance, as well across the 2011 and 2004 surveys. Indeed, it would appear that the
influence of employee trust on workplace performance has become more important during
the recession. Again, this is consistent with our theoretical priors (see Section 2.1).
4. The Determinants of Employee Trust
4.1 Data and Methodology
Given that the findings presented in Section 3 indicate a positive relationship between
employee trust and workplace performance, the natural next step is to ascertain what
influences the degree of employees’ trust in their managers. We therefore analyse employee
level data drawn from the WERS Employee Questionnaire. We focus on the most recent
WERS, i.e. the 2011 survey, since it includes a set of questions relating to whether employees
jobs. Again, in order to analyse the robustness of our findings, we explore the determinants of
the four measures of employee trust (described in Section 3 above).
The distribution of employee trust appears to be consistent across the four measures
as reported in the table below. It is apparent that the majority of the responses across the four
measures fall into the ‘agree’ category, with ‘strongly disagree’ being the least populated
category.
Employee trust measures: % responding in each category
Strongly agree 10.47 12.78 14.93 12.09
Agree 37.30 42.50 41.49 42.70
Neither agree nor disagree 29.76 26.14 23.84 24.48
Disagree 16.13 13.21 12.68 14.96
Strongly disagree 6.34 5.36 7.06 5.77
Given that the trust measures are ordered five-point indices, we use an ordered probit
specification to model each of the four measures of trust as follows:
(7)
where the unit of analysis is the employee, i=1,…,N, in workplace, w=1,…,W. The
continuous latent trust of the employee, , is observed in discrete form through a censoring
mechanism: if , with k outcomes and the ’s are unknown
parameters to be estimated. Standard errors are clustered at the workplace level to account for
the possibility that up to 25 employees may be observed for each workplace.10
With respect to the explanatory variables, we include a set of job and work related
characteristics, , and a set of personal characteristics, . We control for the following
job and work related characteristics: the natural logarithm of the individual’s weekly
contractual hours; the employee’s workplace tenure distinguishing between less than one year
(the omitted category), 1 to less than 2 years, 2 to less than 5 years, 5 to less than 10 years
and 10 years or more; how much training he/she has received during the last 12 months either
10
paid for or organised by the employer (excluding health and safety training), none (the
omitted category), less than 1 day, 1 to less than 2 days, 2 to less than 5 days, 5 to less than
10 days, 10 days or more; trade union membership; and a set of dummy variables indicating
which range that the individual’s weekly gross pay falls into, less than £60 (the omitted
category), £61-£100, £101-£130, £131-£170, £171-£220, £221-£260, £261-£310, £311-£370,
£371-£430, £431-£520, £521-£650, £651-£820, £821-£1050 and £1051 or more.11 With
respect to personal characteristics, we control for gender, age, ethnicity, marital status, health
status, education, number of children and religion.
Our focus on the 2011 WERS relates to the inclusion in the Employee Questionnaire
of the following question: ‘Did any of the following happen to you as a result of the most
recent recession whilst working at this workplace? My workload increased; My job was
re-organised; I was moved to another job; My wages were frozen or cut; My nonwage benefits
were reduced; My contracted working hours were reduced; Access to paid overtime was
restricted; I was required to take unpaid leave; And access to training was restricted. Thus,
we include a set of control variables capturing whether (as well as how) the individual
reported that he/she was affected by the recent recession where these are entered into
equation (7) as binary controls.12 It is apparent from the summary statistics presented in the
final column of Table 2 that 26% of employees felt that their workload had increased as a
result of the recession, with 18% reporting that their work had been re-organised.
Approximately 32% reported that their wages had been frozen or cut, contrasting with only
5% reporting that their non-wage benefits had been reduced. Access to paid overtime and
access to training being restricted were reported by 17% and 12% of employees, respectively.
4.2 Results
11
The equivalent amounts are translated into annual pay in the questionnaire.
12
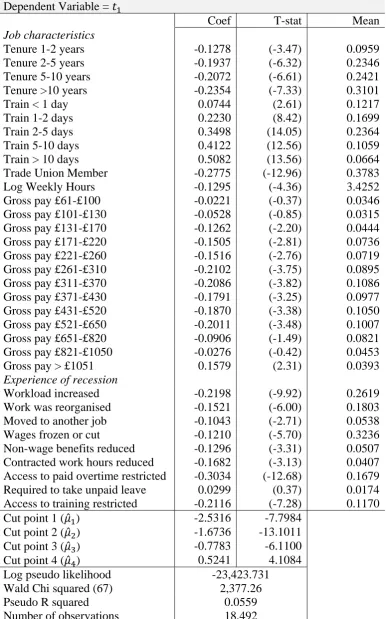
In Table 2, for brevity, we present selected results relating to the coefficients estimated in
modelling , the ordered index capturing the extent to which employees agree with the
statement: Managers here can be relied upon to keep their promises. Given our focus, we
present the estimated coefficients related to the job and work-related characteristics.13 It is
apparent that the amount of training received by employees is positively associated with
employee trust, whereas workplace tenure, hours worked and trade union membership are all
inversely associated with employee trust. With respect to pay, the highest pay category is
positively associated with trust with an inverse association being apparent for the middle
categories relative to being in the lowest pay category.
With respect to the set of variables relating to experiences due to the economic
recession, with the exception of being required to take unpaid leave, it is apparent that the
estimated coefficients are all negative and generally highly statistically significant. The
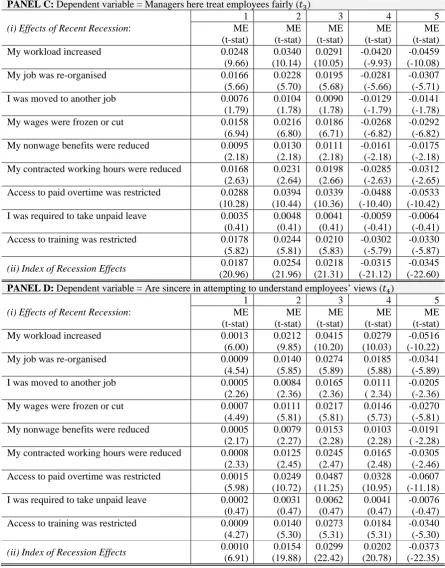
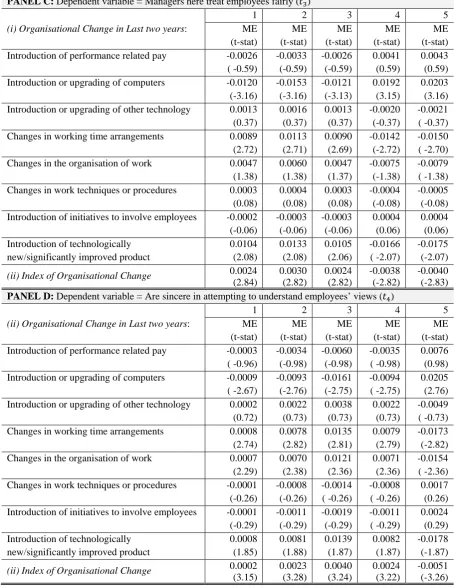
marginal effects relating to this set of variables are presented in Table 3 where it can be seen
that the set of variables capturing whether or not employees have been influenced by the
financial crisis (with the exception of having to take unpaid leave) all have a positive
influence on being in the relatively low employee trust categories and a negative influence on
being in the relatively high employee trust categories. Focusing firstly on , managers here
can be relied upon to keep their promises, it is apparent that restricting access to paid
overtime has a relatively large inverse effect on the probability of responding in the ‘agree’
category, at 7 percentage points, closely followed by the size of the effects of an increased
workload and access to training being restricted, both at around 5 percentage points.
Moreover the effects related to these three variables are highly statistically significant. The
cumulative effect of the recession variables may play an important role in influencing
13
employee trust. Hence, in the second part of the table we present the marginal effects
associated with an index of the number of recession effects reported by the employee which
ranges from zero to nine. The results indicate that a higher value of the index is associated an
increased probability of reporting the lower categories of employee trust.
Similar results are found for and , managers here deal with employees honestly
and managers here treat employees fairly, respectively, with highly significant effects also
found for job re-organisation. A slightly different pattern of marginal effects is found for ,
managers here are sincere in attempting to understand employees’ views, with negative
effects found for category 5 only. The largest inverse effect on reporting category 5 ‘strongly
agree’ was once again associated with restricting access to paid overtime, with highly
statistically significant effects also found for restricting access to training and job
re-organisation. For example, job re-organisation is associated with around a 3 percentage point
lower probability that employees ‘strongly agree’ that managers treat employees fairly (see
panel c). It is noticeable across the four measures of employee trust that being required to
take unpaid leave does not appear to influence employee trust. Such a finding may reflect
differing values placed on having additional time away from work related to the earnings and
effort associated with being at work.14
It is apparent that the changes experienced by employees due to the recession are
changes experienced at the individual level. It is also interesting to explore the influence of
organisational changes introduced at the workplace level on employee trust and whether
the influence of such changes on employee trust varies across the 2004 and 2011 WERS.
14
Hence, we exploit the responses to the following questions which were included in the
Management Questionnaire and hence provide information at the workplace level which
we then match with the employee level data. In the 2004 WERS, management
representatives were asked: over the past two years has management introduced any of the
following changes: introduction of performance related pay; introduction or upgrading of
computers; introduction or upgrading of other technology; changes in working time
arrangements; changes in the organisation of work; changes in work techniques or
procedures; introduction of initiatives to involve employees; and introduction of
technologically new or significantly improved product or service. In the 2011 WERS, the
second and third categories were combined as follows: introduction or upgrading of new
technology (including computers). Hence, seven types of organisational change were
identified in the 2011 WERS as compared to eight in the 2004 WERS.
We exploit this information to explore the relationship between employee trust and
organizational change by re-estimating equation (7) above replacing the variables
associated with changes experienced by employees as a result of the recent recession with
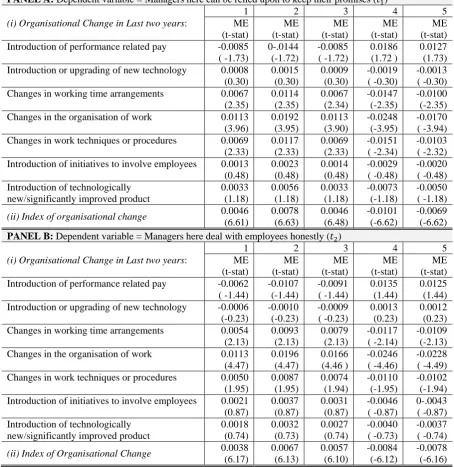
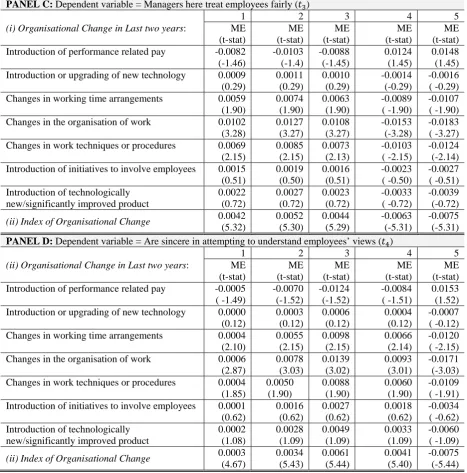
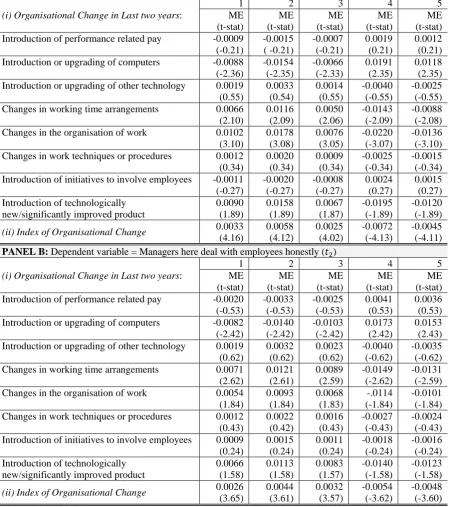
the organisational change variables described above.15 The results are summarised in
Tables 4 and 5 below, which present the marginal effects associated with the organisational
change variables. Table 4 presents the results relating to the 2011 WERS and Table 5
presents the results relating to the 2004 WERS. As above, it may be the case that employee
trust is influenced by the cumulative effects of the various types of organisational change.
Hence, in the second part of each table, we replace the set of organisational change dummy
variables with an index denoting the number of types of change introduced by the
organisation over the last two years. For the 2011 WERS, the index runs from zero to
seven, whilst for the 2004 WERS the index runs from zero to eight.
15
It is apparent that there are only two organisational change variables that achieve
statistical significance in the 2011 WERS across the four measures of employee trust,
namely: changes in working time arrangements and changes in the organisation of work.
These two types of organisational change are generally associated with an increased
probability of reporting trust in the lowest three categories and inversely associated with
reporting trust in the highest two categories. Thus, the findings suggest that this type of
organisational change, in line with the effects of changes associated with the recent
recession, erodes employee trust. These effects are, however, smaller in magnitude than
those capturing the effects of the recent recession. In 2011, none of the other types of
organisational change appear to influence employee trust. For the index of the number of
types of organisational change, across the four measures of employee trust, an inverse
relationship is apparent.
Interestingly, if the set of organisational change variables are included as well as
the set of variables capturing the effects of the recent recession, the pattern of the effects
associated with the effects of the recent recession remains in terms of sign and statistical
significance, although, as expected, some of the marginal effects are slightly smaller in
magnitude. The only organisational change measures to exert statistically significant
influences are once again changes in working time arrangements and changes in the
organisation of work, with the findings suggesting that these changes are associated with
lower employee trust. The estimated magnitudes of these effects are small in comparison to
those associated with the variables capturing the effects of the recent recession.
For the 2004 WERS, it is apparent that changes in working time arrangements are
inversely associated with trust across all four measures of employee trust, whilst changes
in the organisation of work are inversely associated with employee trust for three of the
deal with employees honestly; and mangers are sincere in attempting to understand
employees’ views. Interestingly, in the pre-recession period, there is one type of
organisational change, introduction or upgrading of computers, which is positively
associated with employee trust being inversely associated with reporting the relatively low
levels of trust and positively associated with reporting the high levels of trust. Dolton and
Makepeace (2004) report a substantial wage premium associated with computer use for
some individuals in the UK. Thus, the findings may partially reflect wage increases
experienced or expected with such changes. The findings therefore suggest that certain
types of organisational change may serve to enhance employee trust.16
In Section 2, we set
out a theoretical framework to consider how organisational practices can influence
employee trust and engender workplace performance-enhancing behaviour. The same
framework can be used equally well to explain the reverse situation: practices that damage
trust and reduce workplace performance. In this Section we have found evidence of both
types of practice, although the results relating to the index organisational change suggest
an inverse relationship between employee trust and the number of types of organisational
change introduced.
5. Conclusion
We have explored the relationship between employee trust and workplace performance from
a theoretical and an empirical perspective. Our theoretical framework has established a link
between employee trust and firm performance and has also indicated possible mechanisms
through which such a relationship may operate. Our empirical findings, based on matched
workplace and employee data from the WERS 2004 and 2011, support a positive relationship
between three measures of workplace performance (financial performance, labour
16
productivity and product or service quality) and four measures of employee trust. Our
findings are generally similar across 2004 and 2011 with the exception that the effect of
employee trust on ‘the better than average’ category for labour productivity is much higher in
2004, i.e. pre the economic recession, than in 2011. Our analysis of the determinants of
employee trust highlights the effects of how workplaces have dealt with the recent recession.
It is apparent that restricting paid overtime potentially erodes employee trust, whilst requiring
employees to take unpaid leave appears to have no effect on employee trust. In addition, we
find that job or work reorganisation experienced at either the employee or organisational
level are associated with lower employee trust. Our findings therefore highlight the
importance of employee trust for workplace performance as well as shedding some light on
References
AKERLOF, G. A. and KRANTON, R. E. (2005) ‘Identity and the Economics of
Organizations’, Journal of Economic Perspectives, 19(1), 9-32.
ALESINA, A. and LA FERRARA, E. (2002) ‘Who Trusts Others?’, Journal of Public
Economics, 85, 207-234.
ALGAN, Y. and CAHUC, P. (2010) ‘Inherited Trust and Growth’, American Economic
Review, 100(5), 2060-2092.
ALGAN, Y. and CAHUC, P. (2013) ‘Trust, Growth and Well-being: New Evidence and
Policy Implications’, in the Handbook of Economic Growth edited by P. Aghion and
S. Durlauf, Elsevier.
BELLEMARE, C. and KRÖGER, S. (2007) ‘On Representative Social Capital’, European
Economic Review, 51, 183-202.
BERTRAND, M. and MULLAINATHAN, S. (2001) ‘Do People Mean What They Say?
Implications for Subjective Survey Data’, American Economic Review, 91, 67-72.
BLUNSDON, B. and REED, K. (2003) ‘The Effects of Technical and Social Conditions on
Workplace Trust’, Journal of Human Resource Management, 14(1), 12-27.
BROWN, S., MCHARDY, J., MCNABB, R. and TAYLOR, K. (2011) ‘Workplace
Performance, Worker Commitment and Loyalty’, Journal of Economics and
Management Strategy, 20, 925-955.
BRYSON, A., FORTH, J. and KIRBY, S. (2005) ‘High Involvement Management Practices,
Trade Union Representation and Workplace Performance in Britain’, Scottish Journal of
CHAPLIN, J., MANGLA, J., PURDON, S. and AIREY, C. (2005) ‘The Workplace
Employment Relations (WERS) 2004 Technical Report (Cross-Section and Panel
Surveys)’, Department of Trade and Industry, November 2005.
DOLTON, P. and G. MAKEPEACE, (2004) ‘Computer Use and Earnings in Britain’ The
Economic Journal, 114, C117-C129.
FORTH, J. and R. MCNABB, (2008) ‘Workplace Performance: A Comparison of Subjective
and Objective Measures in the 2004 Workplace Employment Relations Survey’
Industrial Relations, 39, 104–123.
FUKUYAMA, F. (1995) Trust. New York: Free Press.
GOERGEN, M., CHAHINE, S., BREWSTER, C. and WOOD, G. (2012) ‘Trust, Owner Rights,
Employees and Firm Performance’, European Corporate Governance Institute Finance
Working Paper Number 336/2012.
GRILICHES, Z. and REGEV, H. (1995) ‘Firm Productivity in Israeli Industry: 1979-1988’,
Journal of Econometrics, 65(1), 175-203.
GRIFFITH, R. and SIMPSON, H. (2004) ‘Characteristics of Foreign-Owned Firms in British
Manufacturing’, in Creating A Premier League Economy, R. Blundell, D., Card, and
R., Freeman (Editors), Chicago: Chicago University Press.
GRUND, C. and HARBRING, C. (2009) ‘Trust and Control at the Workplace: Evidence
from Representative Sample of Employees in Europe’, IZA working paper number
4297.
GUISO, L., HALIASSOS, M. and JAPPELLI, T. (2002) Household Portfolios. MIT Press.
KNACK, S. and KEEFER, P. (1996) ‘Does Social Capital Have an Economic Payoff? A
LA PORTA, R., LOPEZ-De-SILANES, F., SHLEIFER, A. and VISHNY, R. (1997) ‘Trust
in Large Organizations’, American Economic Review Papers and Proceedings, 87,
333-338.
MACHIN, S. and STEWART, M. (1990) ‘Unions and Financial Performance of British
Private Sector Establishments’, Journal of Applied Econometrics, 5, 327-50.
MAYER, R. C. and DAVIES, J. H. (1999) ‘The Effect of the Performance Appraisal System
on Trust for Management: A Field Quasi-Experiment’, Journal of Applied
Psychology, 84, 123-136.
MCNABB, R. and WHITFIELD, K. (1998) ‘The Impact of Financial Participation and
Employee Involvement on Financial Performance’, Scottish Journal of Political
Economy, 45, 171-87.
MUNDAY, M., PEEL, M. and TAYLOR, K. (2003) ‘The Performance of the
Foreign-Owned Sector of UK Manufacturing: Some Evidence and Implications for UK Inward
Investment Policy’, Fiscal Studies, 24, 501-21.
OULTON, N. (1998) ‘Competition and the Dispersion of Labour Productivity amongst UK
Companies’, Oxford Economic Papers, 50(1), 23-38.
VAN WANROOY, B., BEWLEY, H., BRYSON, A., FORTH, J., FREETH, S., STOKES, L.
and S. WOOD (2013) The 2011 Workplace and Employment Relations Study First
Findings.
WALL, T. D., MICHIE, J., PATTERSON, M., WOOD, S. J., SHEEHAN, M., CLEGG, C.
W. and WEST, M. (2004) ‘On the Validity of Subjective Measures of Company
Performance’, Personnel Psychology, 57(1), 95-119.
TABLE 1A: Workplace Performance and Employee Trust; Ordered Probit Analysis; WERS 2011
PANEL A: Dependent Variable = Financial Performance ( ); Marginal Effects
0 1 2 3 Trust Measures ME (t-stat) ME (t-stat) ME (t-stat) ME (t-stat)
-0.0260 (-4.02) -0.0577 (-4.07) 0.0396 (4.00) 0.0440 (4.11) -0.0262 (-3.95) -0.0581 (-3.99) 0.0399 (3.93) 0.0444 (4.03) -0.0233 (-3.61) -0.0514 (-3.65) 0.0353 (3.60) 0.0394 (3.68) -0.0204 (-3.15) -0.0448 (-3.17) 0.0307 (3.14) 0.0344 (3.19) PANEL B: Dependent Variable = Labour Productivity ( ); Marginal Effects
0 1 2 3 Trust Measures ME (t-stat) ME (t-stat) ME (t-stat) ME (t-stat)
-0.0191 (-3.59) -0.0575 (-3.69) 0.0473 (3.66) 0.0293 (3.67) -0.0157 (-2.90) -0.0470 (-2.95) 0.0386 (2.93) 0.0241 (2.94) -0.0152 (-2.86) -0.0452 (-2.91) 0.0372 (2.90) 0.0232 (2.90) -0.0156 (-2.94) -0.0466 (-3.00) 0.0383 (2.98) 0.0239 (2.99) PANEL C: Dependent Variable = Product or Service Quality ( ); Marginal Effects
0 1 2 3 Trust Measures ME (t-stat) ME (t-stat) ME (t-stat) ME (t-stat)
-0.0113 (-4.23) -0.0679 (-5.31) -0.0090 (-2.30) 0.0881 (5.40) -0.0116 (-4.24) -0.0703 (-5.31) -0.0093 (-2.30) 0.0912 (5.40) -0.0107 (-4.11) -0.0644 (-5.06) -0.0085 (-2.28) 0.0837 (5.14) -0.0110 (-4.20) -0.0670 (-5.21) -0.0088 (-2.29) 0.0868 (5.30)
TABLE 1B: Workplace Performance and Employee Trust; Ordered Probit Analysis; WERS 2004
PANEL A: Dependent Variable = Financial Performance ( ); Marginal effects
0 1 2 3 Trust Measures ME (t-stat) ME (t-stat) ME (t-stat) ME (t-stat)
-0.0285 (-3.46) -0.0489 (-3.46) 0.0417 (3.44) 0.0357 (3.48) -0.0247 (-2.92) -0.0421 (-2.92) 0.0360 (2.91) 0.0309 (2.93) -0.0181 (-2.21) -0.0307 (-2.21) 0.0262 (2.21) 0.0226 (2.22) -0.0284 (-3.32) -0.0483 (-3.32) 0.0414 (3.31) 0.0353 (3.34) PANEL B: Dependent Variable = Labour Productivity ( ); Marginal effects
0 1 2 3 Trust Measures ME (t-stat) ME (t-stat) ME (t-stat) ME (t-stat)
-0.0261 (-4.00) -0.0673 (-4.08) 0.0643 (4.08) 0.0290 (4.02) -0.0253 (-3.77) -0.0649 (-3.83) 0.0621 (3.83) 0.0281 (3.78) -0.0193 (-3.00) -0.0491 (-3.02) 0.0470 (3.03) 0.0214 (3.00) -0.0283 (-4.17) -0.0726 (-4.26) 0.0698 (4.26) 0.0312 (4.19) PANEL C: Dependent Variable = Product or Service Quality ( ); Marginal effects
0 1 2 3 Trust Measures ME (t-stat) ME (t-stat) ME (t-stat) ME (t-stat)
[image:29.595.74.530.410.691.2]TABLE 2: Determinants of Employee Trust; Ordered Probit Analysis of
Employee Level Data; WERS 2011
Dependent Variable =
Coef T-stat Mean Job characteristics
Tenure 1-2 years -0.1278 (-3.47) 0.0959 Tenure 2-5 years -0.1937 (-6.32) 0.2346 Tenure 5-10 years -0.2072 (-6.61) 0.2421 Tenure >10 years -0.2354 (-7.33) 0.3101 Train < 1 day 0.0744 (2.61) 0.1217 Train 1-2 days 0.2230 (8.42) 0.1699 Train 2-5 days 0.3498 (14.05) 0.2364 Train 5-10 days 0.4122 (12.56) 0.1059 Train > 10 days 0.5082 (13.56) 0.0664 Trade Union Member -0.2775 (-12.96) 0.3783 Log Weekly Hours -0.1295 (-4.36) 3.4252 Gross pay £61-£100 -0.0221 (-0.37) 0.0346 Gross pay £101-£130 -0.0528 (-0.85) 0.0315 Gross pay £131-£170 -0.1262 (-2.20) 0.0444 Gross pay £171-£220 -0.1505 (-2.81) 0.0736 Gross pay £221-£260 -0.1516 (-2.76) 0.0719 Gross pay £261-£310 -0.2102 (-3.75) 0.0895 Gross pay £311-£370 -0.2086 (-3.82) 0.1086 Gross pay £371-£430 -0.1791 (-3.25) 0.0977 Gross pay £431-£520 -0.1870 (-3.38) 0.1050 Gross pay £521-£650 -0.2011 (-3.48) 0.1007 Gross pay £651-£820 -0.0906 (-1.49) 0.0821 Gross pay £821-£1050 -0.0276 (-0.42) 0.0453 Gross pay > £1051 0.1579 (2.31) 0.0393 Experience of recession
Workload increased -0.2198 (-9.92) 0.2619 Work was reorganised -0.1521 (-6.00) 0.1803 Moved to another job -0.1043 (-2.71) 0.0538 Wages frozen or cut -0.1210 (-5.70) 0.3236 Non-wage benefits reduced -0.1296 (-3.31) 0.0507 Contracted work hours reduced -0.1682 (-3.13) 0.0407 Access to paid overtime restricted -0.3034 (-12.68) 0.1679 Required to take unpaid leave 0.0299 (0.37) 0.0174
Access to training restricted -0.2116 (-7.28) 0.1170 Cut point 1 ( ) -2.5316 -7.7984
Cut point 2 ( ) -1.6736 -13.1011 Cut point 3 ( ) -0.7783 -6.1100 Cut point 4 ( ) 0.5241 4.1084 Log pseudo likelihood -23,423.731 Wald Chi squared (67) 2,377.26 Pseudo R squared 0.0559 Number of observations 18,492
TABLE 3: Employee Trust and the Recent Financial Recession; Ordered Probit Analysis; WERS 2011
PANEL A: Dependent variable = Managers here can be relied upon to keep their promises ( )
1 2 3 4 5
(i) Effects of Recent Recession: ME
(t-stat) ME (t-stat) ME (t-stat) ME (t-stat) ME (t-stat)
My workload increased 0.0218
(9.37) 0.0413 (9.87) 0.0242 (9.52) -0.0539 (-9.82) -0.0335 (-9.65)
My job was re-organised 0.0151
(5.95) 0.0286 (5.96) 0.0167 (5.90) -0.0373 (-5.99) -0.0231 (-5.94)
I was moved to another job 0.0103
(2.71) 0.0196 (2.71) 0.0115 (2.68) -0.0256 (-2.71) -0.0159 (-2.70)
My wages were frozen or cut 0.0120
(5.74) 0.0227 (5.67) 0.0133 (5.52) -0.0296 (-5.69) -0.0184 (-5.63)
My nonwage benefits were reduced 0.0129
(3.28) 0.0243 (3.31) 0.0142 (3.29) -0.318 (-3.31) -0.0197 (-3.29) My contracted working hours were reduced 0.0167
(3.10) 0.0316 (3.12) 0.0185 (3.13) -0.0412 (-3.11) -0.0256 (-3.13) Access to paid overtime was restricted 0.0301
(12.00) 0.0571 (12.44) 0.0334 (11.71) -0.0744 (-12.55) -0.0462 (-12.02) I was required to take unpaid leave -0.0030
(-0.37) -0.0056 (-0.37) -0.0033 (-0.37) 0.0073 (0.37) 0.0046 (0.37) Access to training was restricted 0.0210
(7.17) 0.0398 (7.21) 0.0233 (7.11) -0.0519 (-7.20) -0.0322 (-7.25)
(ii) Index of Recession Effects 0.0179
(21.74) 0.0336 (24.40) 0.0197 (19.86) -0.0438 (-24.68) -0.0274 (-22.39) PANEL B: Dependent variable = Managers here deal with employees honestly ( )
1 2 3 4 5
(i) Effects of Recent Recession: ME
(t-stat) ME (t-stat) ME (t-stat) ME (t-stat) ME (t-stat)
My workload increased 0.0197
(9.74) 0.0382 (10.35) 0.0328 (10.22) -0.0490 (-10.22) -0.0416 (-10.25)
My job was re-organised 0.0161
(7.27) 0.0313 (7.30) 0.0269 (7.30) -0.0403 (-7.32) -0.0341 (-7.32)
I was moved to another job 0.0089
(2.62) 0.0172 (2.62) 0.0148 (2.61) -0.0222 (-2.62) -0.0188 (-2.61)
My wages were frozen or cut 0.0115
(6.42) 0.0223 (6.37) 0.0192 (6.32) -0.0287 (-6.38) -0.0243 (-6.38)
My nonwage benefits were reduced 0.0078
(2.30) 0.0151 (2.31) 0.0130 (2.30) -0.0194 (-2.31) -0.0164 (-2.30) My contracted working hours were reduced 0.0109
(2.33) 0.0212 (2.34) 0.0182 (2.34) -0.0273 (-2.33) -0.0231 (-2.34) Access to paid overtime was restricted 0.0215
(9.78) 0.0417 (10.15) 0.0358 (9.97) -0.0536 (-10.12) -0.0454 (-10.01) I was required to take unpaid leave 0.0115
(6.42) 0.0223 (6.37) 0.0192 (6.32) -0.0287 (-6.38) -0.0243 (-6.38) Access to training was restricted 0.0078
(2.30) 0.0151 (2.31) 0.0130 (2.30) -0.0194 (-2.31) -0.0164 (-2.30)
(ii) Index of Recession Effects 0.0153
TABLE 3: Employee Trust and the Recent Financial Recession; Ordered Probit Analysis;
WERS 2011 (Continued)
PANEL C: Dependent variable = Managers here treat employees fairly ( )
1 2 3 4 5
(i) Effects of Recent Recession: ME
(t-stat) ME (t-stat) ME (t-stat) ME (t-stat) ME (t-stat)
My workload increased 0.0248
(9.66) 0.0340 (10.14) 0.0291 (10.05) -0.0420 (-9.93) -0.0459 (-10.08)
My job was re-organised 0.0166
(5.66) 0.0228 (5.70) 0.0195 (5.68) -0.0281 (-5.66) -0.0307 (-5.71)
I was moved to another job 0.0076
(1.79) 0.0104 (1.78) 0.0090 (1.78) -0.0129 (-1.79) -0.0141 (-1.78)
My wages were frozen or cut 0.0158
(6.94) 0.0216 (6.80) 0.0186 (6.71) -0.0268 (-6.82) -0.0292 (-6.82)
My nonwage benefits were reduced 0.0095
(2.18) 0.0130 (2.18) 0.0111 (2.18) -0.0161 (-2.18) -0.0175 (-2.18) My contracted working hours were reduced 0.0168
(2.63) 0.0231 (2.64) 0.0198 (2.66) -0.0285 (-2.63) -0.0312 (-2.65) Access to paid overtime was restricted 0.0288
(10.28) 0.0394 (10.44) 0.0339 (10.36) -0.0488 (-10.40) -0.0533 (-10.42) I was required to take unpaid leave 0.0035
(0.41) 0.0048 (0.41) 0.0041 (0.41) -0.0059 (-0.41) -0.0064 (-0.41) Access to training was restricted 0.0178
(5.82) 0.0244 (5.81) 0.0210 (5.83) -0.0302 (-5.79) -0.0330 (-5.87)
(ii) Index of Recession Effects 0.0187
(20.96) 0.0254 (21.96) 0.0218 (21.31) -0.0315 (-21.12) -0.0345 (-22.60) PANEL D: Dependent variable = Are sincere in attempting to understand employees’ views ( )
1 2 3 4 5
(i) Effects of Recent Recession: ME
(t-stat) ME (t-stat) ME (t-stat) ME (t-stat) ME (t-stat)
My workload increased 0.0013
(6.00) 0.0212 (9.85) 0.0415 (10.20) 0.0279 (10.03) -0.0516 (-10.22)
My job was re-organised 0.0009
(4.54) 0.0140 (5.85) 0.0274 (5.89) 0.0185 (5.88) -0.0341 (-5.89)
I was moved to another job 0.0005
(2.26) 0.0084 (2.36) 0.0165 (2.36) 0.0111 ( 2.34) -0.0205 (-2.36)
My wages were frozen or cut 0.0007
(4.49) 0.0111 (5.81) 0.0217 (5.81) 0.0146 (5.73) -0.0270 (-5.81)
My nonwage benefits were reduced 0.0005
(2.17) 0.0079 (2.27) 0.0153 (2.28) 0.0103 (2.28) -0.0191 ( -2.28) My contracted working hours were reduced 0.0008
(2.33) 0.0125 (2.45) 0.0245 (2.47) 0.0165 (2.48) -0.0305 (-2.46) Access to paid overtime was restricted 0.0015
(5.98) 0.0249 (10.72) 0.0487 (11.25) 0.0328 (10.95) -0.0607 (-11.18) I was required to take unpaid leave 0.0002
(0.47) 0.0031 (0.47) 0.0062 (0.47) 0.0041 (0.47) -0.0076 (-0.47) Access to training was restricted 0.0009
(4.27) 0.0140 (5.30) 0.0273 (5.31) 0.0184 (5.31) -0.0340 (-5.30)
(ii) Index of Recession Effects 0.0010
TABLE 4: Employee Trust and Organisational Change; Ordered Probit Analysis; WERS
2011
PANEL A: Dependent variable = Managers here can be relied upon to keep their promises ( )
1 2 3 4 5
(i) Organisational Change in Last two years: ME
(t-stat) ME (t-stat) ME (t-stat) ME (t-stat) ME (t-stat) Introduction of performance related pay -0.0085
( -1.73) 0-.0144 (-1.72) -0.0085 ( -1.72) 0.0186 (1.72 ) 0.0127 (1.73) Introduction or upgrading of new technology 0.0008
(0.30) 0.0015 (0.30) 0.0009 (0.30) -0.0019 ( -0.30) -0.0013 ( -0.30) Changes in working time arrangements 0.0067
(2.35) 0.0114 (2.35) 0.0067 (2.34) -0.0147 (-2.35) -0.0100 (-2.35) Changes in the organisation of work 0.0113
(3.96) 0.0192 (3.95) 0.0113 (3.90) -0.0248 (-3.95) -0.0170 ( -3.94) Changes in work techniques or procedures 0.0069
(2.33) 0.0117 (2.33) 0.0069 (2.33) -0.0151 ( -2.34) -0.0103 ( -2.32) Introduction of initiatives to involve employees 0.0013
(0.48) 0.0023 (0.48) 0.0014 (0.48) -0.0029 ( -0.48) -0.0020 ( -0.48) Introduction of technologically
new/significantly improved product
0.0033 (1.18) 0.0056 (1.18) 0.0033 (1.18) -0.0073 (-1.18) -0.0050 ( -1.18)
(ii) Index of organisational change 0.0046
(6.61) 0.0078 (6.63) 0.0046 (6.48) -0.0101 (-6.62) -0.0069 (-6.62) PANEL B: Dependent variable = Managers here deal with employees honestly ( )
1 2 3 4 5
(i) Organisational Change in Last two years: ME
(t-stat) ME (t-stat) ME (t-stat) ME (t-stat) ME (t-stat) Introduction of performance related pay -0.0062
( -1.44) -0.0107 (-1.44) -0.0091 ( -1.44) 0.0135 (1.44) 0.0125 (1.44) Introduction or upgrading of new technology -0.0006
(-0.23) -0.0010 (-0.23) -0.0009 ( -0.23) 0.0013 (0.23) 0.0012 (0.23) Changes in working time arrangements 0.0054
(2.13) 0.0093 (2.13) 0.0079 (2.13) -0.0117 ( -2.14) -0.0109 (-2.13) Changes in the organisation of work 0.0113
(4.47) 0.0196 (4.47) 0.0166 (4.46 ) -0.0246 ( -4.46) -0.0228 ( -4.49) Changes in work techniques or procedures 0.0050
(1.95) 0.0087 (1.95) 0.0074 (1.94) -0.0110 (-1.95) -0.0102 (-1.94) Introduction of initiatives to involve employees 0.0021
(0.87) 0.0037 (0.87) 0.0031 (0.87) -0.0046 ( -0.87) 0-.0043 ( -0.87) Introduction of technologically
new/significantly improved product
0.0018 (0.74) 0.0032 (0.73) 0.0027 (0.74) -0.0040 ( -0.73) -0.0037 ( -0.74)
(ii) Index of Organisational Change 0.0038
TABLE 4: Employee Trust and Organisational Change; Ordered Probit Analysis; WERS
2011 (Continued)
PANEL C: Dependent variable = Managers here treat employees fairly ( )
1 2 3 4 5
(i) Organisational Change in Last two years: ME
(t-stat) ME (t-stat) ME (t-stat) ME (t-stat) ME (t-stat) Introduction of performance related pay -0.0082
(-1.46) -0.0103 (-1.4) -0.0088 (-1.45) 0.0124 (1.45) 0.0148 (1.45) Introduction or upgrading of new technology 0.0009
(0.29) 0.0011 (0.29) 0.0010 (0.29) -0.0014 (-0.29) -0.0016 ( -0.29) Changes in working time arrangements 0.0059
(1.90) 0.0074 (1.90) 0.0063 (1.90) -0.0089 ( -1.90) -0.0107 ( -1.90) Changes in the organisation of work 0.0102
(3.28) 0.0127 (3.27) 0.0108 (3.27) -0.0153 (-3.28) -0.0183 ( -3.27) Changes in work techniques or procedures 0.0069
(2.15) 0.0085 (2.15) 0.0073 (2.13) -0.0103 ( -2.15) -0.0124 (-2.14) Introduction of initiatives to involve employees 0.0015
(0.51) 0.0019 (0.50) 0.0016 (0.51) -0.0023 ( -0.50) -0.0027 ( -0.51) Introduction of technologically
new/significantly improved product
0.0022 (0.72) 0.0027 (0.72) 0.0023 (0.72) -0.0033 ( -0.72) -0.0039 (-0.72)
(ii) Index of Organisational Change 0.0042
(5.32) 0.0052 (5.30) 0.0044 (5.29) -0.0063 (-5.31) -0.0075 (-5.31) PANEL D: Dependent variable = Are sincere in attempting to understand employees’ views ( )
1 2 3 4 5
(ii) Organisational Change in Last two years: ME
(t-stat) ME (t-stat) ME (t-stat) ME (t-stat) ME (t-stat) Introduction of performance related pay -0.0005
( -1.49) -0.0070 (-1.52) -0.0124 (-1.52) -0.0084 ( -1.51) 0.0153 (1.52) Introduction or upgrading of new technology 0.0000
(0.12) 0.0003 (0.12) 0.0006 (0.12) 0.0004 (0.12) -0.0007 ( -0.12) Changes in working time arrangements 0.0004
(2.10) 0.0055 (2.15) 0.0098 (2.15) 0.0066 (2.14) -0.0120 ( -2.15) Changes in the organisation of work 0.0006
(2.87) 0.0078 (3.03) 0.0139 (3.02) 0.0093 (3.01) -0.0171 (-3.03) Changes in work techniques or procedures 0.0004
(1.85) 0.0050 (1.90) 0.0088 (1.90) 0.0060 (1.90) -0.0109 ( -1.91) Introduction of initiatives to involve employees 0.0001
(0.62) 0.0016 (0.62) 0.0027 (0.62) 0.0018 (0.62) -0.0034 ( -0.62) Introduction of technologically
new/significantly improved product
0.0002 (1.08) 0.0028 (1.09) 0.0049 (1.09) 0.0033 (1.09) -0.0060 ( -1.09)
(ii) Index of Organisational Change 0.0003