R E S E A R C H A R T I C L E
Open Access
Association between body mass index
and health-related quality of life, and
the impact of self-reported long-term
conditions
–
cross-sectional study from the
south Yorkshire cohort dataset
Benjamin Kearns
*, Roberta Ara, Tracey Young and Clare Relton
Abstract
Background:We sought to quantify the relationship between body mass index (BMI) and health-related quality (HRQoL) of life, as measured by the EQ-5D, whilst controlling for potential confounders. In addition, we
hypothesised that certain long-term conditions (LTCs), for which being overweight or obese is a known risk factor, may mediate the association between BMI and HRQoL. Hence the aim of our study was to explore the association between BMI and HRQoL, first controlling for confounders and then exploring the potential impact of LTCs. Methods:We used baseline data from the South Yorkshire Cohort, a cross-sectional observational study which uses a cohort multiple randomised controlled trial design. For each EQ-5D health dimension we used logistic regression to model the probability of responding as having a problem for each of the five health dimensions. All continuous variables were modelled using fractional polynomials. We examined the impact on the coefficients for BMI of removing LTCs from our model. We considered the self-reported LTCs: diabetes, heart disease, stroke, cancer, osteoarthritis, breathing problems and high blood pressure.
Results:The dataset used in our analysis had data for 19,460 individuals, who had a mean EQ-5D score of 0.81 and a mean BMI of 26.3 kg/m2. For each dimension, BMI and all of the LTCs were significant predictors. For overweight or obese individuals (BMI≥25 kg/m2), each unit increase in BMI was associated with approximately a 3% increase in the odds of reporting a problem for the anxiety/depression dimension, a 8% increase for the mobility dimension, and approximately 6% for the remaining dimension s. Diabetes, heart disease, osteoarthritis and high blood pressure were identified as being potentially mediating variables for all of the dimensions.
Conclusions:Compared to those of a normal weight (18.5 < BMI < 25 kg/m2), overweight and obese individuals had a reduced HRQoL, with each unit increase in BMI associated with approximately a 6% increase in the odds of reporting a problem on any of the EQ-5D health dimensions. There was evidence to suggest that diabetes, heart disease, osteoarthritis and high blood pressure may mediate the association between being overweight and HRQoL.
Keywords:Obesity, Overweight, Underweight, EQ-5D, Co-morbidities, Regression analysis, Confounding, Mediating
* Correspondence:b.kearns@sheffield.ac.uk
School of Health and Related Research, University of Sheffield, Sheffield, UK
© 2013 Kearns et al.; licensee BioMed Central Ltd. This is an open access article distributed under the terms of the Creative Commons Attribution License (http://creativecommons.org/licenses/by/2.0), which permits unrestricted use, distribution, and reproduction in any medium, provided the original work is properly cited.
Background
For adults, body mass index (BMI [kg/m2]) is
recom-mended as a way of classifying their weight as being either underweight (BMI < 18.5), healthy weight (BMI 18.5 to 24.9), overweight (BMI 25 to 29.9) or obese (BMI > 29.9) [1]. Deviations away from the healthy weight range are associated with a lower health-related quality of life (HRQoL) [2-4].
Of the non-healthy weights, the effects of being over-weight or obese have received the most attention in the literature, with reports that their prevalence has reached epidemic levels in many countries [5,6]. Being over-weight or obese is a major risk factor for many diseases including diabetes, hypertension, coronary heart disease, cancer and stroke [7-9]. There are also substantial cost implications for society; for example it is estimated that in 2007 the economic costs of overweight and obesity were £16 billion in England alone [10], with direct costs to the National Health Service of £3.2 billion [11].
The association between BMI and HRQoL is poten-tially confounded by the complex biological and social frameworks that cause deviations away from healthy weight [12]. Age, gender, ethnicity, deprivation, educa-tion and lifestyle choices such as smoking and activity levels are all potential confounders or mediators that have been explored in the literature [13-15].
The South Yorkshire Cohort (SYC) study [16], is a large observational study which uses a cohort multiple randomised controlled trial design [17]. It collects data on a range of socio-demographics, socio-economics, co-morbidities, health resource use and HRQoL and pro-vides an opportunity to study the impact of a wide range of factors that may confound or mediate any assess-ments of the association between BMI and HRQoL. For our study we hypothesised that socio-demographic and social-economic variables may confound the association between BMI and HRQoL, whilst certain comorbidities (those for which unhealthy weight is a known risk fac-tor) may mediate the association between BMI and HRQoL (that is, being overweight causes the long-term condition, which in turn causes a reduction in HRQoL). Hence the aim of our study was to use the baseline results from the SYC to explore the association between BMI and HRQoL, first controlling for confounders and then explo-ring the potential impact of long-term conditions.
Methods
The South Yorkshire cohort
South Yorkshire is an English metropolitan county in the Yorkshire and Humber region. It has a population of about 1.29 million spread across the city of Sheffield and three metropolitan boroughs (Barnsley, Rotherham, Doncaster). Rates of obesity vary from 23.7% in Sheffield to 29% in Doncaster [18].
The methods employed for the SYC study have been previously described in depth [16]. It employs a two-stage sampling method, first recruiting general practitioners and then individuals aged between 16 and 85 years registered with these practices.
Questionnaire
The SYC questionnaire included information on a wide-range of variables. A copy of the questionnaire is available online [16]. The study uses data from the participants who filled-in the consent form as agreeing for their information to be used for research purposes. Ethical approval for the SYC was obtained from Leeds East NHS Research Ethics Committee (09/H1306/97).
Measurement of health-related quality of life
Information on health related quality of life was collected using the EuroQoL (5D) questionnaire [19]. The EQ-5D is a widely used generic instrument which contains five attributes of health status: mobility, self-care, usual activ-ities, pain/discomfort and anxiety/depression. Each of the attributes is measured by a question with three possible responses: no problem, some problems, or extreme prob-lems. The different combinations of responses lead to a total of 243 (3^5) possible health states. A sample of these health states were weighted by the United Kingdom ge-neral public using time trade-off techniques and the resulting algorithm was used to calculate the preference-based health state utility values used in the current study [20]. EQ-5D scores range from 1 (perfect health) through
0 (dead) to −0.594 with scores less than zero denoting
states worse than dead.
Measurement of socio-demographics and socio-economics
Data were collected on the respondent’s age, gender, eth-nicity, deprivation score, highest level of education and work status. Ethnicity was based on the 2001 England and Wales Census ‘5 + 1’ categories: ‘Asian,’ ‘Black’, ‘Mixed’, ‘White’ ‘Chinese or Other’, and‘Not Stated’ [21]. Missing responses were coded as ‘Not Stated’. Deprivation score was a continuous variable from the 2007 indices of mul-tiple deprivation [22], based on the respondent’s postcode. Work status was classified into one of five occupations, based on the National Statistic’s Socio-economic Classi-fication (NSSEC) [23]. An additional category was also included for individuals who did not provide informa-tion on this.
Measurement of comorbidities and lifestyle
(LTCs): diabetes, heart disease, stroke, cancer, osteo-arthritis, breathing problems, and high blood pressure.
All LTCs were binary variables of the form ‘absent/
present’ and were chosen as they may be potentially
mediating comorbidities [25].
Statistical analysis
For this analysis we developed separate regression models for each of the five individual health dimensions of the EQ-5D. Due to the very small numbers reporting an‘extreme problem’for any of the dimensions we used
logistic regression, with the outcome being ‘any
prob-lem’. Models were built using backwards selection (with the least significant variable removed one at a time). Va-riables were removed if their p-value (based on likelihood ratio tests) was less than 0.157, as this has been shown to produce good results [26].
STATA version 10.1 [27] was used for all analyses. Age, BMI and deprivation were the only continuous va-riables; these were modelled using fractional polyno-mials; the use of these allows a systematic framework for identifying any non-linear associations [26]. Briefly, each continuous variable is represented by a combination of polynomials (typically one or two), where the powers for the polynomials are estimated from the data and taken from the set {−2, -1, -½, 0, ½, 1, 2, 3}, or the logarithm of the variable is selected.
The ability of the models to correctly classify patients was summarised by their ‘area under the
receiver-operating-characteristic curve’ (AUROC). The AUROC can take a
[image:3.595.304.539.111.310.2] [image:3.595.56.291.115.719.2]value between 0 and 1, with values between 0.7 to 0.8 indi-cating acceptable discrimination, values between 0.8 to 0.9 indicating excellent discrimination, and values above 0.9 indicating outstanding discrimination [28].
Table 1 Distribution of variables and their average values for BMI, EQ-5D and age
Variable Count Mean Mean Median Mean
BMI EQ-5D EQ-5D Age
Age
Under 25 1,142 23.45 0.92 1 20.06
25 to 34 1,870 25.02 0.90 1 29.76
35 to 44 2,614 25.94 0.87 1 39.85
45 to 54 3,219 26.53 0.84 0.88 49.66
55 to 64 4,387 27.02 0.80 0.81 59.89
65 to 74 4,159 26.99 0.76 0.80 69.14
75plus 2,069 26.22 0.70 0.73 78.98
Gender
Male 8,562 26.64 0.81 0.85 56.20
Female 10,898 26.04 0.82 0.85 52.77
Ethnic group
White 18,735 26.32 0.81 0.85 54.81
Mixed 102 25.76 0.85 1 39.39
Asian 387 25.83 0.83 1 38.88
Black 147 26.93 0.82 0.92 44.27
Chinese or other 89 24.81 0.83 0.85 42.91
Highest education
Degree/NVQ4-5 5,734 25.33 0.89 1 49.31
A-levels/NVQ3 2,434 25.81 0.85 1 45.18
GCSEs/NVQ1-2 5,155 26.52 0.83 0.85 51.02
None 1,237 27.15 0.76 0.80 64.72
Other 4,900 27.24 0.70 0.76 65.41
Smoking status
Current smoker 2,540 25.78 0.75 0.80 48.71
Former smoker 6,628 26.90 0.79 0.80 59.75
Never smoked 10,292 25.98 0.85 1 51.83
Deprivation quintile
Least deprived 3,881 25.32 0.87 1 54.22
Low deprivation 3,894 25.85 0.85 0.92 56.10
Average 3,863 26.22 0.84 0.85 55.01
High deprivation 3,896 26.82 0.79 0.85 53.62
Most deprived 3,926 27.29 0.73 0.80 52.46
NSSEC
Manager & professional 8,149 25.85 0.87 1 52.59
Intermediate 1,976 26.10 0.84 0.85 51.08
Small employers/etc. 1,185 26.47 0.82 0.85 56.81
Lower supervisory/etc. 1,451 26.84 0.79 0.80 56.20
Semi-routine & routine 2,051 26.73 0.79 0.80 52.01
Missing 4,648 26.78 0.73 0.80 58.37
Table 1 Distribution of variables and their average values for BMI, EQ-5D and age(Continued)
Alcohol consumption
None 6,690 26.92 0.75 0.80 54.91
Moderate 10,648 25.89 0.85 0.88 54.37
Hazardous 1,961 26.30 0.86 0.88 51.92
Harmful 161 27.33 0.76 0.80 51.50
LTCs
Diabetes 1,268 30.06 0.66 0.73 64.82
Heart disease 1,248 28.02 0.62 0.69 70.05
Stroke 413 27.25 0.58 0.69 69.70
Cancer 557 26.82 0.70 0.71 66.86
Osteoarthritis 1,849 28.15 0.56 0.69 67.79
Breathing problems 2,107 27.42 0.66 0.73 59.14
High blood pressure 3,736 28.59 0.71 0.76 66.28
No LTCs 7,526 25.08 0.94 1 46.41
Kearnset al. BMC Public Health2013,13:1009 Page 3 of 11
Being overweight or obese is a known risk factor for the LTCs explored in this analysis. Because of this, in a regression model that includes any of the LTCs, the as-sociation between BMI and HRQoL (as estimated by the regression coefficients) will be attenuated because some of this association is ascribed to the LTCs. However, some respondents will also have developed LTCs which were not caused by changes in their BMI. Regression models excluding the LTCs will ignore the association between LTCs and HRQoL that is independent of BMI. The approach adopted for this analysis was to consider LTCs for inclusion in models, but to measure the pro-portion of the association between BMI and HRQoL that is attenuated (explained) by the inclusion of each LTC in the models.
For the initial exploratory analysis, observed associa-tions between the variables were tested for statistical significance. T-tests were used to compare continuous variables between binary categories, and linear regres-sion was used to compare the association between two continuous variables. It should be noted that these comparisons were not defined a priori, and so the p-values should be interpreted with caution. References to statistical significance are always at the 5% level. Pairwise Pearson’s correlation coefficients (‘r’) were also calculated.
The effect of comorbidities
It was hypothesised that the comorbid LTCs included in our study may mediate the association between BMI and HRQoL; that is having an unhealthy BMI may result in both developing the LTC and reduced HRQoL. If this is the case then including LTCs in the model may not al-ways be appropriate, as some of the association between BMI and HRQoL would be erroneously attributed to the LTC. However, without longitudinal data this hypothesis cannot easily be tested. Instead our study’s analysis was repeated, but without the LTCs. If the hypothesis is cor-rect then removing the LTCs would be expected to in-crease the beta coefficient for BMI. The change in the BMI beta coefficient when an LTC is removed (mea-sured as a proportion of the beta coefficient when the LTC is included) is known as the proportion of treat-ment explained (PTE).
Results
Initial exploratory analysis
The dataset contains data for 20,710 individuals. Indivi-duals were dropped if they had missing data for age (251, 1.2%), deprivation (70, 0.3%) or gender (3, 0.01%), ethnicity (91, 0.4%) or BMI (831, 4.0%). Four individuals also had BMI values of 11.9, 71.1, 72.3 and 78.4 that were deemed to be implausible. These 1,250 individuals
were excluded from subsequent analysis, leaving 19,460 individuals, who had a mean EQ-5D score of 0.81 and a
mean BMI of 26.3 kg/m2. There were some missing data
for each EQ-5D health dimension; mobility 245 (1.3%), self-care 372 (1.9%), usual activities 255 (1.3%), pain/ discomfort 324 (1.7%), anxiety/depression 489 (2.5%). Missing responses for the LTCs were assumed to repre-sent the condition being abrepre-sent.
The distributions of the variables and their mean values of BMI and EQ-5D are shown in Table 1. As many out-comes, including HRQoL, are correlated with age [29] mean values of age are also shown.
In general, higher levels of BMI were associated with lower levels of EQ-5D and increased age. In particular, people with a LTC, no education qualification, or miss-ing NSSEC details were on average older, had higher BMI and had lower HRQoL than the rest of the sample (all p < 0.001). There were exceptions to these associa-tions; for example current smokers had a lower quality of life than people who had never smoked (p < 0.001), despite being younger (p < 0.001) and having a lower BMI (p = 0.072). Similarly, increasing levels of deprivation were associated with an increase in BMI, but a decrease in both age and HRQoL (all p < 0.001). Of note, moderate and hazardous drinkers had both a lower BMI and higher
HRQoL than those who didn’t consume alcohol in the
past week (all p < 0.001). Correlation coefficients for these associations are provided in the Additional file 1.
The variable NSSEC had high levels of missing re-sponses (30.1%). This variable was suspected a priori to have a strong correlation with deprivation. This was con-firmed by exploratory analysis (for example, the‘Manager and Professional’category had a mean deprivation score of 16.95 whilst the‘semi-routine and routine’category had a mean score of 28.42), and so the variable NSSEC was not included in any regression models.
The distributions of responses to each of the EQ-5D health dimensions are presented in Table 2. For each di-mension over half of the sample responded as having no problems, whilst only a very small number responded as having extreme problems. A total of 8,508 respondents (44%) reported no limitations on any of the five dimen-sions (and so their EQ-5D value = 1).
The proportion of individuals who responded as ha-ving a problem (either some or extreme) in each health dimension is shown in Table 3, broken down by BMI (weight) group. Compared with the normal weight group, all of the non-healthy weight groups are associated with an increasing tendency to report a problem for each dimension.
Univariable associations between BMI and EQ-5D
an association, with deviations from a healthy weight having a lower EQ-5D score, there was also a high de-gree of scatter, and the distributional features of the overall EQ-5D score that make it problematic to analyse (bounded, skewed and tri-modal) were noticeable.
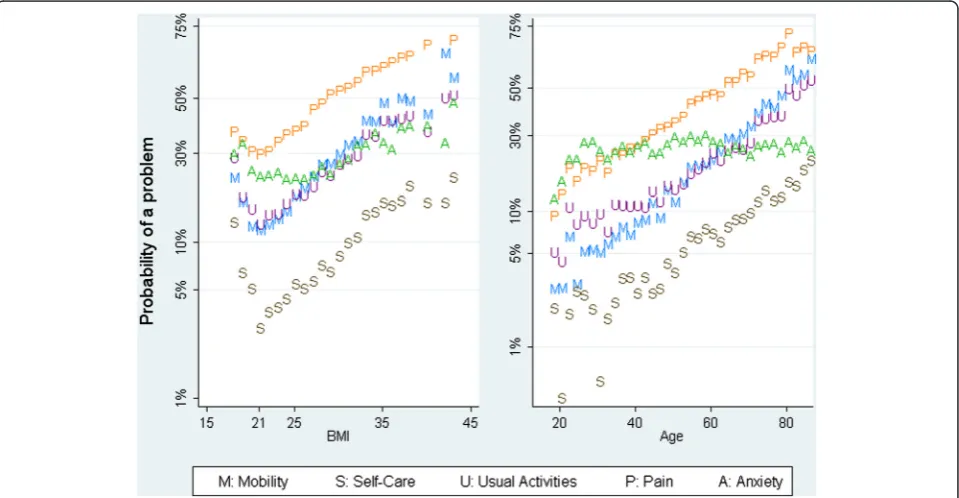
Figure 2 shows the association between the probability of a problem (for each EQ-5D health dimension) and BMI (left-panel) and age (right-panel). With the exception of
the anxiety/depression dimension–which showed at best
a weak association with both BMI and age–the nature of the association with BMI seemed to be constant across the health dimensions, whilst the association with age ap-peared to be linear, with possible slight curvature for some health dimensions. Because of this, a common fractional polynomial was chosen for BMI (powers−2, -1), whilst for age a fractional polynomial with one power was chosen. For deprivation, a fractional polynomial with two powers was chosen. For the anxiety/depression regression model all three continuous variables were modelled using frac-tional polynomials of two powers.
Multivariable associations between BMI and EQ-5D
For this analysis all of the covariates were considered for inclusion in the logistic regression models. The resulting models are displayed in Table 4. These models may be used to predict EQ-5D scores for individuals; worked examples of predictions are included in Additional file 1.
Results for the four health dimensions mobility, self-care, usual activities and pain were all very similar to each other, whilst those for anxiety/depression were different to the other four dimensions.
Each unit increase in BMI above normal weight was as-sociated with an approximate increase in the odds of ha-ving a problem of between 4% and 12% for the dimensions
mobility, self-care, usual activities and pain. For anxiety/ depression the increase was lower, at about 3%. The esti-mated odds ratios for obese individuals were very similar to those for overweight individuals, but were estimated with more precision (had shorter confidence intervals). All of the associations for obese individuals were statisti-cally significant (p < 0.05), whilst only three of the five associations were statistically significant for overweight individuals, and none were for underweight individuals. However, the point-estimates were all above 1, sugges-ting a possible‘U-shaped’association between BMI and HRQoL.
The estimated odds for deprivation and for age were both consistent across all of the health dimensions, with the notable exception of pain, for which age has a much larger impact. The odds for male were of borderline sig-nificance for the first four dimensions (this variable was dropped by the stepwise method for the usual activity and pain dimensions), but very significant for the anx-iety/depression dimension. The effect for anxiety/depres-sion was also in the opposite direction to that observed for the other dimensions.
[image:5.595.57.542.100.170.2]The presence of any of the LTCs was associated with a statistically significant increase in the odds of reporting a problem. With the exception of the model for anxiety/ depression, the presence of osteoarthritis was associated with the largest increase in odds amongst the LTCs. The estimated odds ratios for osteoarthritis were often much larger than those for the other LTCs. For example, the odds of reporting a problem on the pain domain are 12.8 for people with osteoarthritis. This value is more than 4.5 larger than any of the odds reported for any of the other LTCs. The remaining LTCs could be roughly grouped into two, with heart disease, stroke and breathing
Table 3 Proportion of respondents (%) indicating a problem on the EQ-5D dimensions sub-grouped by BMI group
Underweight Normal Overweight Obese All
responders (BMI < 18.5) (BMI 18.5 to 24.9) (BMI 25 to 29.9) (BMI > 29.9)
Mobility 20.5 14.8 24.9 41.5 23.5
Self-care 11.1 4.4 6.4 14.7 7.2
Usual activities 24.2 16.0 22.4 36.5 22.2
Pain/discomfort 35.2 34.7 47.3 61.4 44.2
Anxiety/depression 32.4 23.8 24.8 35.2 26.4
Total (count) 302 8,459 7,078 3,621 19,460
Table 2 Proportion of responses (%) for each level of the EQ-5D health dimensions
Mobility Self-care Usual activities Pain/discomfort Anxiety/depression
No problems 76.5 92.8 77.8 55.8 73.6
Some problems 23.4 6.8 20.4 39.5 24.2
Extreme problems 0.1 0.3 1.8 4.8 2.2
Total (count) 19,217 19,090 19,207 19,134 18,973
Kearnset al. BMC Public Health2013,13:1009 Page 5 of 11
[image:5.595.58.539.622.733.2]problems having odds ratios in the range of 1.4 to 2.8 (across the five models), whilst diabetes, cancer and high blood pressure had odds ratios in the range of 1.2 to 2.1. In comparison, the range of odds for smokers (compared to non-smokers) is 1.2 to 2.1 across the five models, whilst the range for those with no education (compared to those with a degree or NVQ4-5) is 1.5 to 2.4.
In general odds ratios from models fitted to the anxiety/ depression dimension were smaller than corresponding odds ratios from the other models, suggesting that some of the variables that explain why people report problems
for the anxiety/depression dimension are not in the final model. This suggestion was supported by the area under the receiver operating characteristic curve (AUROC) measure. The AUROC for the anxiety/depression dimen-sion (0.656) was 16% lower than the next smallest (Pain; 0.778) and 23% lower than the highest (Self-care; 0.849). Using the classifications recommended by Hosmer and Lemeshow the mobility, self-care and usual activities models show excellent discrimination, the pain model shows acceptable discrimination, whilst the anxiety/ depression model only shows weak discrimination [28].
For each long-term condition, the proportion of treat-ment explained is presented in Table 5. The PTE was calcu-lated separately for overweight/obese and for underweight individuals (using the groupings described in the footnote to Table 4). As the association between BMI and HRQoL was not statistically significant for those underweight, the PTE was only calculated for the overweight group.
[image:6.595.57.291.89.248.2]Results were similar across all five dimensions, with dia-betes, heart disease, osteoarthritis and high blood pressure explaining a statistically significant amount of the associ-ation between BMI and HRQoL for all the dimensions. There was little evidence to suggest that stroke, cancer or breathing problems explained any of the association be-tween BMI and HRQoL, with point-estimates often less than 1%. The one exception is breathing problems which explained a statistically significant amount of the associ-ation between BMI and the probability of having a prob-lem in the anxiety/depression dimension.
[image:6.595.59.539.456.705.2]Figure 2The probability of responding as having a problem for each EQ-5D health dimension.Left-panel: by BMI, right panel: by age. Probabilities are displayed on the logit scale.
Table 4 Logistic regression models for the health dimensions mobility, self-care, activities, pain and anxiety
Beta coefficients Mobility Self-care Activities Pain Anxiety/Depression†
Sample size (n) 19,217 19,090 19,207 19,134 18,973
BMI-2 19.13 (10.58 to 34.54) 19.26 (9.47 to 39.17) 13.24 (7.67 to 22.83) 8.4 (5.05 to 13.97) 8.65 (4.15 to 18.01)
BMI-1 0.06 (0.04 to 0.09) 0.07 (0.04 to 0.13) 0.1 (0.06 to 0.15) 0.13 (0.09 to 0.2) 0.06 (0.02 to 0.15)
Age* 1.04 (1.04 to 1.04) 1.02 (1.01 to 1.02) 1.02 (1.02 to 1.03) 3.82 (3.39 to 4.26) 0.56 (0.49 to 0.63)
Deprivation 1.01 (1.01 to 1.02) 1.02 (1.01 to 1.02) 1.01 (1.01 to 1.02) 1.01 (1.01 to 1.01) 1.01 (1.01 to 1.01)
Male gender 1.21 (1.11 to 1.32) 1.27 (1.11 to 1.45) 0.70 (0.96 to 0.97)
Non-white ethnicity 0.87 (0.97 to 1.01)
Alcohol status
Moderate drinker 0.64 (0.59 to 0.7) 0.53 (0.47 to 0.61) 0.66 (0.61 to 0.73) 0.76 (0.7 to 0.82) 0.76 (0.96 to 0.98)
Heavy drinker 0.57 (0.49 to 0.67) 0.36 (0.28 to 0.48) 0.58 (0.5 to 0.67) 0.76 (0.67 to 0.84) 0.85 (0.97 to 1)
Highest education
A-levels / NVQ3 1.4 (1.2 to 1.65) 1.48 (1.12 to 1.97) 1.17 (1.01 to 1.36) 1.58 (1.4 to 1.77) 1.3 (1.01 to 1.04)
GCSE / NVQ1-2 1.34 (1.19 to 1.52) 1.38 (1.09 to 1.73) 1.17 (1.04 to 1.32) 1.58 (1.45 to 1.73) 1.34 (1.02 to 1.04)
Other 1.65 (1.39 to 1.95) 2.51 (1.92 to 3.25) 1.46 (1.23 to 1.73) 1.79 (1.55 to 2.08) 1.31 (1.01 to 1.04)
None 1.9 (1.67 to 2.16) 2.41 (1.93 to 2.97) 1.57 (1.38 to 1.77) 2.03 (1.84 to 2.25) 1.45 (1.03 to 1.05)
Smoking status
Current 2.01 (1.77 to 2.27) 2.08 (1.73 to 2.48) 2.08 (1.84 to 2.34) 1.52 (1.38 to 1.68) 1.75 (1.05 to 1.07)
Former 1.25 (1.13 to 1.36) 1.17 (1.02 to 1.36) 1.26 (1.15 to 1.38) 1.27 (1.17 to 1.36) 1.17 (1.01 to 1.02)
Long-term conditions
Diabetes 1.62 (1.39 to 1.88) 1.26 (1.04 to 1.52) 1.4 (1.22 to 1.63) 1.22 (1.05 to 1.4) 1.25 (1.01 to 1.04)
Heart disease 2.36 (2.03 to 2.75) 1.92 (1.6 to 2.27) 2.75 (2.39 to 3.19) 1.67 (1.43 to 1.95) 1.45 (1.02 to 1.05)
Stroke 2.27 (1.75 to 2.94) 2.53 (1.93 to 3.32) 2.8 (2.18 to 3.6) 1.43 (1.11 to 1.86) 1.48 (1.02 to 1.06)
Cancer 1.92 (1.55 to 2.36) 1.9 (1.46 to 2.46) 2.12 (1.73 to 2.61) 1.55 (1.27 to 1.9) 1.35 (1.01 to 1.05)
Osteoarthritis 5.81 (5.16 to 6.62) 3.35 (2.89 to 3.86) 4.31 (3.86 to 4.85) 12.81 (10.49 to 15.49) 1.6 (1.04 to 1.06)
Breathing problems 2.53 (2.27 to 2.86) 2.36 (2.03 to 2.72) 2.64 (2.34 to 2.94) 1.82 (1.63 to 2.05) 1.65 (1.04 to 1.06)
High blood pressure 1.27 (1.16 to 1.4) 1.28 (1.12 to 1.49) 1.23 (1.12 to 1.36) 1.16 (1.05 to 1.27) 1.15 (1.01 to 1.02)
Constant −2.33 (−2.46 to−2.21) −3.85 (−4.06 to−3.63) −2.07 (−2.18 to−1.96) −0.86 (−0.95 to−0.77) −1.37 (−1.57 to−1.17)
BMI value for minimum problems. 20.73 22.49 22.15 20.98 23.94
AUROC 0.844 0.849 0.801 0.778 0.656
Kearns
et
al.
BMC
Public
Health
2013,
13
:1009
Page
7
o
f
1
1
http://ww
w.biomedce
ntral.com/1
471-2458/13/100
(0.025), diabetes (0.018) pressure (0.002) Highest education; other, diabetes, stroke (all 0.001), cancer (0.002), high blood pressure (0.003)
Approximate odds-ratios (95% confidence interval) per unit change**:
Underweight 1.09 (0.91 to 1.29) 1.21 (0.98 to 1.48) 1.10 (0.94 to 1.29) 1.01 (0.88 to 1.16) 1.05 (0.93 to 1.20)
Overweight 1.08 (1.03 to 1.13) 1.04 (0.97 to 1.13) 1.06 (1.01 to 1.11) 1.12 (1.75 to 1.16) 1.03 (0.99 to 1.07)
Obese 1.08 (1.06 to 1.10) 1.06 (1.03 to 1.08) 1.06 (1.04 to 1.08) 1.05 (1.03 to 1.07) 1.03 (1.01 to 1.05)
AUROC–Area under the receiver operating characteristic curve, BMI: Body mass index. Values in brackets are 95% confidence intervals.
The constant term applies to 54.28 year old white females who do not smoke, have not consumed alcohol in the last week, hold a degree or NVQ4-5, have no long-term conditions, a deprivation score of 27.05 and a BMI of 26.29. *Age is linear for Mobility, Self-Care and Activities and Ln(Age/10) for Pain. All continuous variables are centred; additionally the two BMI variables have been scaled (divided by 10). Odds ratios are per 0.1 increase.
†The continuous variables BMI and Age are modelled differently for anxiety/depression. The term‘BMI-2’
is replaced with‘BMI-0.5’
. The stated coefficient for age corresponds to (Age/10)-1
. An additional term for age is also necessary; (Age/10)0.5. This has odds ratio 0.86 (0.83 to 0.89). For anxiety/depression the two odds ratios for age are per 0.1 increase.
**These odds ratios were estimated by assuming separate linear trends amongst those underweight, overweight, and obese. These values should not be used when making predictions. To increase numbers in the underweight category, a BMI value < 20 was taken as being underweight.
BMC
Public
Health
2013,
13
:1009
Page
8
o
f
1
1
ntral.com/1
471-2458/13/100
[image:8.595.61.710.68.186.2]Discussion
We found that being overweight was associated with sta-tistically significant reductions in HRQoL, with each unit increase in BMI associated with approximately a 6% in-crease in the odds of reporting a problem on any of the EQ-5D dimensions. We also found an association between being underweight and HRQoL, but this association was not statistically significant.
We explored the impact on the overweight and HRQoL association of seven self-reported LTCs; diabetes, heart disease, stroke, cancer, osteoarthritis, breathing problems and high blood pressure. These were chosen because be-ing overweight is a known risk factor for their develop-ment. We found evidence to suggest that diabetes, heart disease, osteoarthritis and high blood pressure may medi-ate the association between being overweight and HRQoL, as controlling for them in our models led to a statistically significant reduction in the coefficient for BMI. This po-tentially mediating association for diabetes and high blood pressure is slightly surprising given that their odds ratios were generally quite small, being in the range of 1.2 to 1.3 for high blood pressure and 1.2 to 1.6 for diabetes. In con-trast, there was little evidence of potential mediation for breathing problems (range of odds ratios: 1.6 to 2.6) or for stroke (range: 1.4 to 2.8).
Using the fitted fractional polynomials it is possible to calculate, for each dimension, the value at which the reported number of problems is at a minimum. These values all lie between 20 kg/m2and 24 kg/m2, lending support to the suggestion that having a BMI in the normal range is asso-ciated with relatively higher HRQoL.
The results of our study support the existing literature by showing the association between deviations away from a healthy weight and reduced HRQoL, as measured using the EQ-5D. Studies that measured HRQoL using the summary EQ-5D score found that being overweight or obese resulted in a statistically significant reduction in HRQoL; this has been observed in representative samples from both the United Kingdom [15] and United States [13], as well as in a sample from the United States
of individuals with diabetes, or at risk of diabetes [14]. When looking at the individual health dimensions we found that being obese was associated with reporting a statistically significantly higher proportion of problems for each of the health dimensions. Similar associations were observed for being overweight, although these were not significant for the self-care and the anxiety/depres-sion domains. In contrast, a study based in the United Kingdom [2], reported that the only statistically signifi-cant associations were with the mobility dimension for overweight individuals, and with the mobility and pain dimensions for obese individuals. A study using an Asian population from Singapore [31] that considered the mobility and usual activities dimensions did not find any significant associations for those overweight, and only the mobility dimension was significant for obese individuals.
We also found evidence to suggest that being under-weight was associated with reduced HRQoL, although this association did not reach statistical significance. A
‘U-shaped’ association between BMI and HRQoL has
been reported in a number of studies [2,3,13,31-33], sug-gesting that the lack of association observed in this study was due to the small number of underweight individuals.
[image:9.595.58.539.100.211.2]We found that the presence of an LTC was associated with a decrease in HRQoL. Of the LTCs considered, osteoarthritis had the largest association, followed by heart disease, stroke and breathing problems, which all had roughly the same impact on HRQoL. There have been a number of studies looking at the impact of LTCs on HRQoL [34-36], but less that have done so whilst also assessing the impact of BMI. Two studiesincluded both LTCs and BMI in regression models, but did not report the coefficients for the LTCs [2,37] Another two studies showed that there was an association between HRQoL and the number of LTCs, but they did not look at the impact of individual LTCs [38]. Our results are similar to a study from the United States, which showed that heart disease and stroke had a larger impact on HRQoL than diabetes and hypertension (high blood pressure
Table 5 Proportion (%) of association explained, with 95% confidence intervals
Individuals with BMI≥25 kg/m2 Mobility Self-care Usual activities Pain Anxiety/depression
Diabetes 6.78 (5.29 to 8.51) 9.87 (6.11 to 15.40) 9.15 (6.78 to 12.81) 4.25 (2.77 to 5.99) 11.48 (6.37 to 20.02)
Heart disease 2.88 (1.21 to 4.63) 6.89 (3.89 to 11.98) 6.08 (2.98 to 9.51) 2.24 (1.25 to 3.36) 5.12 (2.51 to 11.15)
Stroke −0.28 (−1.37 to 0.68) 0.28 (−2.83 to 3.35) −0.003 (−2.08 to 1.71) −0.08 (−0.62 to 0.49) 0.18 (−1.62 to 2.15)
Cancer 0.06 (−0.69 to 0.76) 0.75 (−0.54 to 2.65) 0.30 (−1.11 to 1.58) 0.08 (−0.45 to 0.59) 0.22 (−0.74 to 1.92)
Osteoarthritis 6.65 (3.51 to 10.10) 14.33 (8.97 to 23.04) 13.14 (8.62 to 18.68) 8.14 (4.05 to 11.68) 9.90 (5.49 to 17.47)
Breathing problems 0.10 (−2.05 to 1.86) 1.11 (−3.24 to 4.71) 1.35 (−2.00 to 4.58) 0.94 (−0.41 to 2.49) 3.52 (0.48 to 8.45)
High blood pressure 8.08 (6.22 to 10.45) 13.82 (9.23 to 20.12) 12.06 (8.97 to 15.98) 6.52 (4.52 to 8.77) 13.44 (7.73 to 25.76)
Generated using a single LTC (on its own, with no other LTCs) in the models detailed in Table4. Confidence intervals are bias-corrected, based on 1000 bootstrap replications of the data (implemented in STATA using the program described by Vittinghoff et al. [30]). Values in italics represent results for which the 95% confidence interval excludes zero.
Kearnset al. BMC Public Health2013,13:1009 Page 9 of 11
in our study) [13]. However, there is some differences be-tween our results, which showed a relatively small impact of cancer, to that of another United Kingdom study, which showed that the impact of cancer on HRQoL was greater than that for diabetes, heart problems, and respiratory problems [3].
Ours is the only study that we are aware of that explores the potentially mediating effect of LTCs on the association between BMI and HRQoL.
We found that the estimated odds ratios for overweight and for obese individuals were very similar. However, the odds were estimated with more precision for the latter group, even though they were a much smaller sample. This suggests that the association between BMI and HRQoL is stronger amongst obese individuals. The association for underweight individuals was estimated with much less pre-cision. However, when considering this uncertainty, there was some evidence to suggest that the effect of each unit increase in BMI below normal weight was similar to the effect of each unit increase in BMI above normal weight.
Particular strengths of our study were that we employed a systematic framework (fractional polynomials) for ex-ploring and modelling any non-linear relationship be-tween BMI and HRQoL, and that we also quantified the proportion of this relationship that may be due to the ef-fects of LTCs for which being overweight or obese is a known risk factor. Another strength of our study was the ability to control for a wide variety of potentially con-founding factors. The associations of these factors with BMI or HRQoL may also be of interest in their own right, for example the finding that respondents with moderate or hazardous alcohol consumption are less likely to report a problem for any of the health dimensions than respon-dents with no alcohol consumption (in the past week).
There are limitations to this work. For example, all of the measurements and outcomes are self-reported and so may be subject to bias. For example, it has been shown that the self-reporting diseases is not 100% accurate [5]. In addition, there may be some shrinkage of reported BMI values, as individuals may be less likely to report height and weight values that lead to extremely high or extremely low BMI values. It is unclear if such shrinkage would be associated with a bias in the reporting of HRQoL, but it seems likely that any shrinkage of self-reported BMI would lead to an attenuation of the observed association between BMI and HRQoL.
The cross-sectional nature of the data means that the associations that we have reported may not be causal as-sociations. In addition, the model for the anxiety/depres-sion dimenanxiety/depres-sion did not appear to perform as well as the other models; having poorer discrimination, with shrink-age of many odds ratios towards unity. The association between BMI and HRQoL also appeared to be different for this dimension (compared to all of the other health
dimensions); further research exploring predictors of responses to this dimension may be beneficial.
Of the variables originally considered for analysis, we did not use NSSEC due to high levels of missing data. The usefulness of this variable in future postal surveys needs to be investigated. As an alternative we used deprivation score as a proxy measure because this could be derived from the patient’s postcode. In addition, model building, using backwards selection, used a p-value for removal of 0.157. This value was chosen because it approximates model selection using Akaike’s Information Criteria [26]. Whilst there is no consensus over the p-value to be used, the results of this study are fairly robust to the choice of p-value. For example, if a smaller p-value for removal of 0.05 is used, this leads to diabetes being removed from the model for Self-Care, and ethnicity being removed from the Anxiety/Depression model.
Conclusion
There is a large evidence base looking at the association between BMI and HRQoL. Using the results of a large cohort study we have added to this evidence base. We have confirmed that there is a non-linear association be-tween BMI and HRQoL, and have showed how fractional polynomial modelling may be used to capture this type of association. We have also explored the impact of LTCs on this association. We have shown that only some of the LTCs are potential mediators, it would be useful for fur-ther research, using longitudinal data, to explore this fin-ding in more depth.
In conclusion, our work represents a valuable addition to the literature as we have been able to estimate the associ-ation between BMI and HRQoL using powerful statistical techniques, whilst also being able to control for a wide variety of variables and measure the potential impact of LTCs on this association.
Additional file
Additional file 1:Worked example of predicting EQ-5D scores.
Abbreviations
AUROC:Area under the receiver operating characteristic curve; BMI: Body mass index; HRQoL: Health-related quality of life; LTC: Long-term condition; NSSEC: National statistic’s socio-economic classification; PTE: Proportion of treatment explained; SYC: South Yorkshire Cohort.
Competing interests
The authors declare that they have no competing interests.
Authors’contributions
Acknowledgements
We are grateful to all the patients who took part in this study and their GPs in help recruiting them and the whole SYC team as well as the South Yorkshire CLAHRC, the University of Sheffield and Sheffield Hallam University. This publication is the work of BK, RA, TY and CR, and does not necessarily reflect the views of the SYC Management Team & South Yorkshire Cohort Steering Committee. This paper presents independent research by the National Institute for Health Research Collaboration for Leadership in Applied Health Research and Care for South Yorkshire (NIHR CLAHRC SY). The views and opinions expressed are those of the authors, and not necessarily those of the NHS, the NIHR or the Department of Health. CLAHRC SY would also like to acknowledge the participation and resources of our partner organisations. Further details can be found at www.clahrc-sy.nihr.ac.uk.
Received: 28 January 2013 Accepted: 25 September 2013 Published: 25 October 2013
References
1. World Health Organization:World Health Organization: Global Database on Body Mass Index; 2012. http://www.who.int/bmi.
2. Sach T, Barton G, Doherty M, Muir K, Jenkinson C, Avery A:The relationship between body mass index and health-related quality of life: comparing the EQ-5D, EuroQol VAS and SF-6D.Int J Obes (Lond)2006,31:189–196. 3. Soltoft F, Hammer M, Kragh N:The association of body mass index and health-related quality of life in the general population: data from the 2003 health survey of England.Qual Life Res2009,18:1293–1299. 4. Ara R, Blake L, Gray L, Hernandez M, Crowther M, Dunkley A,et al:What is
the clinical effectiveness and cost-effectiveness of using drugs in treating obese patients in primary care? A systematic review.Health Technol Assess2012,16:1–197.
5. Blissmer B, Riebe D, Dye G, Ruggiero L, Greene G, Caldwell M:Health-related quality of life following a clinical weight loss intervention among overweight and obese adults: intervention and 24 month follow-up effects.Health Qual Life Outcomes2006,4:43.
6. Scottish Intercollegiate Guidelines Network:SIGN National Clinical Guideline 115: Management of Obesity.Manage Obes2010,115. http://www.sign.ac.uk/ pdf/sign115.pdf.
7. Field A, Coakley E, Must A, Spadano J, Laird N, Dietz W,et al:Impact of overweight on the risk of developing common chronic diseases during a 10-year period.Arch Intern Med2012,161:1581–1586.
8. Wilson P, D'Agnostino R, Sullivan L, Parise H, Kannel W:Overweight and obesity as determinants of cardiovascular risk: the Framingham experience.Arch Intern Med2002,162:1867–1872.
9. Kopelman P:Health risks associated with overweight and obesity. Obes Rev2007,8:S13–S17.
10. Department of Health. Healthy Lives, Healthy People: A Call to Action on Obesity in England; 2011. https://www.gov.uk/government/publications/ healthy-lives-healthy-people-a-call-to-action-on-obesity-in-england. 11. Allender S, Rayner M:The burden of overweight and obesity-related ill
health in the UK.Obes Rev2007,8:467–473.
12. Butland B, Jebb S, Kopelman P, McPherson K, Thomas S, Mardell J,et al: Foresight. Tackling obesities.Future choices2007. http://www.bis.gov.uk/ assets/foresight/docs/obesity/17.pdf.
13. Jia H, Lubetkin E:The impact of obesity on health-related quality-of-life in the general adult US population.J Public Health2005,27:156–164. 14. Grandy S, Fox K:EQ-5D visual analog scale and utility index values in
individuals with diabetes and at risk for diabetes: findings from the study to help improve early evaluation and management of risk factors leading to diabetes (SHIELD).Health Qual Life Outcomes2008,6:18. 15. Kinge J, Morris S:Socioeconomic variation in the impact of obesity on
health-related quality of life.Soc Sci Med2010:1–9.
16. Relton C, Bissell P, Smith C, Blackburn J, Cooper C, Nicholl J,et al:South yorkshire cohort: a‘cohort trials facility’study of health and weight - protocol for the recruitment phase.BMC Public Health2011,11:640.
17. Relton C, Torgerson D, O’Cathain A, Nicholl J:Rethinking pragmatic randomised controlled trials: introducing the“cohort multiple randomised controlled trial”design.Br Med J2010,340:963–967. 18. National Obesity Observatory. NOO e-Atlas: Adult Obesity, Determinants and
Associated Diseases.http://www.noo.org.uk/visualisation/eatlas. 19. EuroQol. EuroQol.http://www.euroqol.org/.
20. Dolan P:Modeling valuations for EuroQol health states.Med Care1997, 35:1095–1108.
21. Department of Health:National standards for ethnic group and related matters; 2012. http://webarchive.nationalarchives.gov.uk/+/www.dh.gov.uk/ en/publicationsandstatistics/publications/publicationspolicyandguidance/ browsable/dh_5319155.
22. HM Government. Index of Multiple Deprivation (IMD) 2007 - Datasets.http:// data.gov.uk/dataset/index_of_multiple_deprivation_imd_2007.
23. Office for National Statistics:The National Statistics Socio-economic Classification (NS-SEC). http://www.ons.gov.uk/ons/guide-method/classifications/current-standard-classifications/soc2010/soc2010-volume-3-ns-sec– rebased-on-soc2010–user-manual/index.html.
24. Purshouse R, Meier P, Brennan A, Taylor K, Rafia R:Estimated effect of alcohol pricing policies on health and health economic outcomes in England: an epidemiological model.Lancet2010,375:1355–1364. 25. National Audit Office:Tackling Obesity in England.http://www.nao.org.uk/
report/tackling-obesity-in-england/.
26. Royston P, Sauerbrei W:Multivariable model-building: a pragmatic approach to regression analysis based on fractional polynomials for modelling continuous variables.Chichester: John Wiley & Sons; 2008.
27. STATACORP:Stata Statistical Software: Release 10. [10].TX: StataCorp LP. College Station; 2007.
28. Hosmer David W, Stanley L:Applied Logistic Regression.John Wiley & Sons; 2000.
29. World Health Organization:GPE Discussion Paper Series: Age Standardization Of Rates: A New Who Standard.http://www.who.int/healthinfo/paper31.pdf. 30. Vittinghoff E, Glidden DV, Shiboski SC, McCulloch CE:Regression methods in biostatistics: linear, logistic, survival, and repeated measures models.New York: Springer; 2011.
31. Wee H-L, Cheung Y-B, Loke W-C, Tan C-B, Chow M-H, Li S-C,et al: The association of body mass index with health-related quality of life:an exploratory study in a multiethnic asian population.Value Health2008, 11:S105–S114.
32. Dixon S, Currie C, McEwan P:Utility values for obesity and preliminary analysis of the health outcomes data repository.Future Drugs2004, 4(6):657–65.
33. Groessl EJ, Kaplan RM, Barrett-Connor E, Ganiats TG:Body mass index and quality of well-being in a community of older adults.Am J Prev Med2004, 26:126–129.
34. Fortin M, Lapointe L, Hudon C, Vanasse A, Ntetu AL, Maltais D:Multimorbidity and quality of life in primary care: a systematic review.Health Qual Life Outcomes2004,2:51.
35. Alonso J, Ferrer M, Gandek B, Ware JE Jr, Aaronson NK, Mosconi P,et al: Health-related quality of life associated with chronic conditions in eight countries: results from the international quality of life assessment (IQOLA) project.Qual Life Res2004,13:283–298.
36. Moussavi S, Chatterji S, Verdes E, Tandon A, Patel V, Ustun B:Depression, chronic diseases, and decrements in health: results from the world health surveys.Lancet2007,370:851–858.
37. Vasiljevic N, Ralevic S, Marinkovic J, Kocev N, Maksimovic M, Milosevic GS,et al: The assessment of health-related quality of life in relation to the body mass index value in the urban population of Belgrade.Health Qual Life Outcomes2008,6:106.
38. Doll HA, Petersen SE, Stewartâ€Brown SL:Obesity and physical and emotional well-being: associations between body mass index, chronic illness, and the physical and mental components of the SF-36 questionnaire.Obes Res2000,8:160–170.
doi:10.1186/1471-2458-13-1009
Cite this article as:Kearnset al.:Association between body mass index and health-related quality of life, and the impact of self-reported long-term conditions–cross-sectional study from the
south Yorkshire cohort dataset.BMC Public Health201313:1009.
Kearnset al. BMC Public Health2013,13:1009 Page 11 of 11