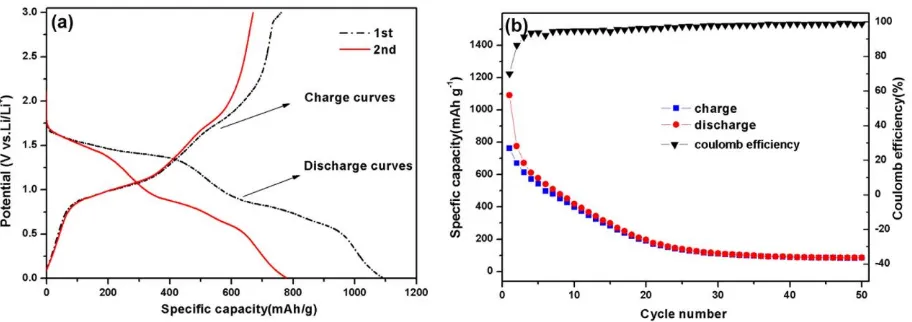
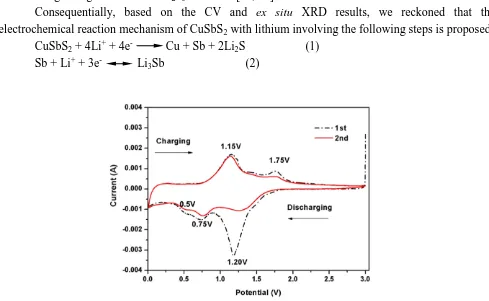
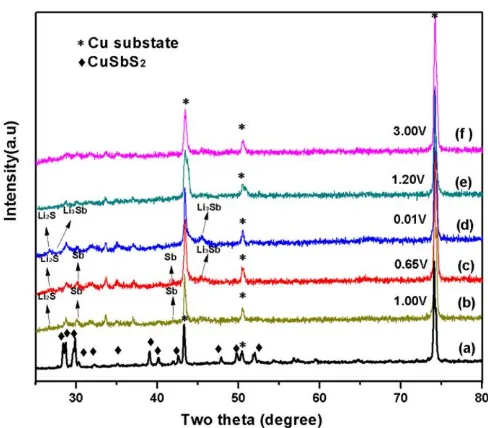
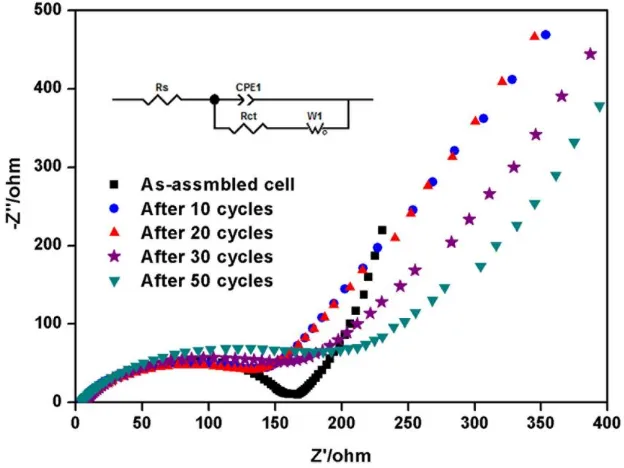
CuSbS2 Nanobricks as Electrode Materials for Lithium Ion Batteries
Full text
Figure


Related documents
This communication contains general information only, and none of Deloitte Touche Tohmatsu Limited (“DTTL”), its global network of member firms or their related entities
Requesting COVID-19 Vaccine Through Centura Health App Centura is now accepting patients 70 and older for sign up.. Navigate to www.centura.org, a pop up window should open,
The study was carried out in a mixed scheme: 3 (valence of the emotional charge of the word: negative vs neutral vs positive; within-subjects factor) × 3 (origin of the emotional
everything which has been made available to the public anywhere in the world by means of written disclosure (including drawings and other illustrations) and
Paper I: Plant resource utilisation, Palynology and Biostatistics M.M. Q.1 will be compulsory based on Units I - IV. Two questions will be set from each unit of which one
Random Time Interval Generator will not only trigger an LSA Update but it will also listen to receive LSA Updates from other routers within the network within the specified window
The court of the first instance, acting in accordance with provisions of Paragraph 5 Part 1 Article 148 of the Arbitrazh Procedure Code of the Russian Federation, said: Sony
Figure 4 Latent and lytic EBV genes are co-expressed in gastric cancer. A portion of the heat map from Figure 1 is displayed in high contrast to decipher relative expression levels
