E
CONOMIC
P
OLICY
R
ESEARCH
I
NSTITUTES
W
ORKINGP
APERN
O. 11/A
UGUST2002
I
NTERDEPENDENT
G
ROWTH IN THE
EU:
T
HE
R
OLE OF
T
RADE
M
ARÍAG
ARCIA-V
EGA ANDJ
OSÉA. H
ERCEISBN 92-9079-392-9
T
HE
R
OLE OF
T
RADE
ENEPRI W
ORKINGP
APERN
O. 11
M
ARÍAG
ARCIA-V
EGA∗∗ ANDJ
OSÉA. H
ERCE♣♣Abstract
After properly modelling growth externalities and using spatial econometric techniques we investigate whether economic integration promotes interdependent growth among countries. We conclude that this has been indeed the case for advanced OECD countries and that, for those countries belonging to the EU, through successive enlargements, the effect has been even stronger. More precisely, if every (trade) partner of a given country experiences an extra growth of 1 percentage point, this economy will profit from an extra 0.5 point, and if this country belongs to the EU it will have an additional increase of its rate of growth of 0.2 points. Both figures can be interpreted as growth externalities with the latter suggesting that an integration process like the one followed by the EU has an (positive) effect on growth.
JEL classification: F15, F43, O47, R11
∗ Universidad Complutense de Madrid, Spain (e-mail: [email protected]).
T
HE
R
OLE OF
T
RADE
ENEPRI W
ORKINGP
APERN
O. 11
M
ARÍAG
ARCIA-V
EGA ANDJ
OSÉA. H
ERCE1. Introduction
Trade can promote growth in industrial countries by enhancing competition, promoting product differentiation, specialisation and economies of scale. Romer (1990), Grossman and Helpman (1991), Griliches (1995), Lichtenberg and van Pottelsberghe (1996), Coe and Helpman (1995), among others, have investigated thoroughly the effects of learning-by-doing, accumulation of human capital, spillovers and diffusion of knowledge. The prediction of some of those theoretical models is that trade can induce convergence of growth rates across countries when there are technological externalities such as international knowledge diffusion (Grossman and Helpman, 1991; Rivera-Batiz and Romer, 1991).
While there is a large literature1 on measuring productivity spillovers (Bernstein
and Mohnen, 1998; Branstetter, 2001; Coe et al., 1997; Eaton and Kortum, 1996; Meyer, 2001), few studies have specifically examined the importance of trade-driven interdependent growth. In this paper we explore dynamic relations between OECD countries’ rates of growth and trade amongst them. In particular, we focus our attention on whether the EU process, through trade, has made the growth rates of its members more interdependent. Some studies before ours have studied the existence of links among different sectors of the economy. Miller and Spencer (1977) and Grinols (1984) use general equilibrium approaches to reflect interdependence, from an empirical point of view, De Bressons (1996) measures sectoral interdependence in firms. However these papers do not consider an explicit relationship among countries, by instance through trade. The paper that is closest in spirit to ours is Goicolea et al. (1998) which shows that trade among Spanish regions enhance their mutual growth. We adopt their approach to apply it to the EU integration process.
European economic integration provides an interesting case study in this regard. Garcia-Vega and Herce (2001) showed that EU countries have increased their trade and rearranged their trade patterns becoming more EU-focused over time. This fact can provide information about the nature and size of effects of the EU upon productive structures. In particular we found that EU countries have relatively increased their flows of trade with new and (geographically) closer
1
EU partners. Has this had any influence on the interdependence of growth patterns in the EU? This question is important mainly for two reasons: first of all, with the launch of the euro the monetary policies are tied up for EU countries. As the debate on the policy implications of asymmetric shocks for monetary unions has illustrated, it is of the utmost interest to promote policies that enhance interdependence in countries forming these unions. Secondly, more interrelated markets mean bigger and freer markets for firms what may induce greater growth due to an increase in the demand, larger scale economies, etc.
Our approach in this paper consists in using spatial econometric techniques in order to examine how trade dependence between EU countries incites their mutual growth. As an empirical tool, spatial econometrics (Anselin, 1988) based on the multidirectional dependence present among observations in cross-sectional data sets, links very naturally with the idea that EU integration generates more economic relationships and therefore more trade, and how growth in any particular EU country affects growth in other country depending on the trade links between them. We show that there is evidence of this, and that the EU process has played a role making the rates of growth of its members more interrelated.
The rest of the paper is organised as follows. Section 2 contains a simple model of interdependent growth. The estimation of interdependent growth externalities using spatial econometrics is carried out in Section 3. This section contains the paper’s central result concerning trade, growth and economic integration. Finally, Section 4 summarises the results obtained.
2. Interdependence in a standard growth equation
Our theoretical framework follows closely that of Garcia-Vega and Herce (2001). We consider the standard growth model. Suppose that there are J
countries indexed i=1,....,J , at any time t=1,...,N; this model states that
output in country i at period t,
Y
it, is produced using technology,A
it, capital,it
K
and labour,L
it:
= it it it it
Y A K Lα γ (1)
We assume that interdependence among countries can be expressed as follows:
1
i ijt
J it it jt
j
A
Y
ρ ω
η
=
=
where
A
it reflects both technology for country i, throughη
it , and a “thickmarkets” externality,
i ijt
jt
Y
ρω, that emerges as markets expand. This part of equation (2) thus implies that output in country i benefits from the fact that the market is growing, as well as bilateral relationships, as economic integration proceeds. This positive effect is due to the fact that markets are larger and more densely populated by firms and consumers and display a larger variety of goods and services and, as countries trade more, they become more interrelated what
reinforces the previous effect. Also in equation (2),
ρ
i translates a growthexternality that becomes larger the larger bilateral relationships are, measured
through
ω
ijt (trade, investment flows, distance, etc).The externality set-up assumed in (2) has been proposed by Bertola (1992) where interdependence is established through private capital. It is also retaken in Goicolea et al. (1998) where output (market) in other regions or countries replaces capital as the explicit context where externalities emerge and bilateral relationships constitute the channel though which they flow.
Replacing (2) into (1) and taking logarithms one obtains:
1
log +
J
ijt jt it it j
yit ηit ρi ω y α k γl
=
= +
∑
+; with
j i
≠
(3)where
y
it=
log
Y k
it;
it=
log
K l
it;
it=
log
L
it. Taking differences in (3)we get:
1 J
yit i ijt yit kit lit it j
g
c
ρ
w g
α
g
γ
g
ε
=
= +
∑
+
+
+
; with
j i
≠
(4)where
g
yit=
y y
it-
it−1,g
kit= -
k k
it it−1,g
lit=
-
l l
it it−1,1
log
-log
it it it
c
+
ε
=
η
η
− , with c being a (constant) technological growthaverage of
ω
ijt over the medium run adopted in order to simplify the procedureto obtain equation (4)2. This variable will be given a more precise role latter on.
Equation (4) applies to every country i. If we furthermore assume that
i i
ρ = ∀ρ we end up with a general formulation for an interdependent growth
equation of the sort:
y y k l
g
= +
c
ρ
Wg
+
α
g
+
γ
g
+
ε
(5)
where c is a constant term
(
1×NJ)
column vector;g
y,g
k , andg
l are(
1
×
NJ
)
column vectors for output, capital and labour growth rates for all
years and countries;
ρ
,α
andγ
are parameters and W is a block diagonal(
NJ NJ×)
matrix with the following structure:1 2 0 0 0 0 0 0 t N W W W W W = M M
M M M
M
where each Wt is a
(
J J
×
)
matrix of bilateral trade flows for that particularyear whose elements are defined as follows:
1 if 0 if ijt J ist ijt s x i j x w i j = ≠ = =
∑
where
x
ijt are exports from country i to country j. Note that the weights havebeen normalised (dividing by the total exports that country i has with the rest of the countries) in order to avoid biases due to the absolute size of trade flows or
2
We could have assumed
ω
ijt to be independent of time. This can be true in the short runvariation of their measurement unit across time. The arrangement of the W matrix implies that only contemporary spatial dependence is assumed (the elements out of the main diagonal are null).
There are basically two reasons for considering such specification. First, it makes explicit how relationships among countries generate a pattern of interdependent growth. Second, it permits the application of spatial econometric techniques to a specification based on a theoretical model. Spatial econometric techniques (Anselin, 1988), permit to study cross-section data with dependency relationships in space. This spatial dependence can be caused by measurement problems or because there exist complex dependence and interrelations in the studied phenomena based on “physical transfer of commodities, people, information”, “background geography” or “relates to more volatile levels of
spatial regularity” (Haining, 1986). In particular, the parameter ρ measures the
importance of the “spatial lagged variable” (in spatial econometrics that makes reference to the variable that is the product of the weights matrix W with the dependent variable) or in our case the strength of the influence of trade dependence on growth. In other words, it indicates the extent of trade autocorrelation, after the other variables have been controlled for. Therefore, following this specification we test whether there is growth dependence among
countries due to trade interactions.3
3. Interdependent growth among EU countries
We estimate equation (5) for EU countries (fourteen countries, Belgium and Luxembourg have been added all through this paper) using labour and gross fixed capital investment data from 1970 to 1997 (388 observations) from the OECD “Statistical compendium”. Data for capital are obtained using the
perpetual inventory method.4 A first step is to test whether there is spatial
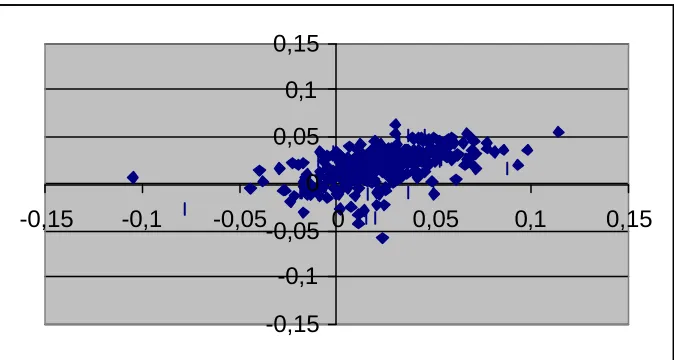
dependence for the data of trade and growth. This can be done using the scatterplot of Moran (Vayá et al., 2000) shown in Figure 1. In this graph the
dependent variable,
g
yit is plotted in the x axis whereas the explanatory
3
We explored different ways to construct these weights without significatively different results. Some of the alternatives where indicative that, below a certain level, trade does not influence growth patterns.
4
Perpetual inventory method measures the stock of capital (Kt) in year t as follows:
(
)
1 1t t t
K + =K −δ +I , where δ is the rate of depreciation of the capital (we assumed 5%;
variable,
Wg
yt, is plotted in the y axis. One can determine whether there is spatial dependence in the data and its structure is as follows. If the observations are dispersed in the four quadrants, there is not spatial dependence. On the contrary, if the set of points lies mainly in the upper-right and lower-left regions this indicates that there is a positive spatial correlation.Figure 1. Moran scatterplot for EU countries:Growth in any one country against trade-weighted growth in the rest of the countries
-0,15 -0,1 -0,05 0 0,05 0,1 0,15
-0,15 -0,1 -0,05 0 0,05 0,1 0,15
From Figure 1 one can observe that there is indeed positive spatial correlation. Consequently the next step is the estimation of the interdependent growth equation (5). However in our specification we can overestimate the parameter of the interdependent growth term if we do not control by other characteristics that are similar among EU countries. EU countries arguably can be in similar stage of development and they can be growing faster until their arrival to their technological frontier. In order to control by those convergence issues, we add to
the regression the term y−1, that is the logarithm of per capita GDP lagged one
year. One would expect that the parameter β has a negative sign indicating that,
other things equal, richer countries grow less rapidly than poorer ones. Equation (5) can then be rewritten as:
1
y y k l
g
= +
c
ρ
Wg
+
α
g
+
γ
g
+
β
y
−+
ε
(6)Table 1. Estimation of the interdependent growth spillover for EU countries (t-statistics between brackets)
(i) (ii) (iii) (iv) (v) (vi)
Intercept 0.01 (3.3) 0.008 (6.2) -0.003 (-1.3) 0.02 (2.6) -0.004 (-1.7) 0.01 (2.3)
Capital stock 0.73
(8.4) 0.54 (7.8) 0.58 (8.4) 0.57 (8.0) 0.60 (8.5) Labour 0.36 (7.9) 0.32 (10.3) 0.32 (10.5) 0.30 (9.6) 0.30 (9.9)
Growth spillover ρAll 0.75
(16.1) 0.60 (10.9) 0.57 (10.3) 0.52 (7.8) 0.51 (7.8) Growth spillover for EU
membersρEU
0.11 (1.5)
0.08 (1.1) Growth spillover for EFTA
membersρEFTA
0.14 (1.6)
0.12 (1.5)
Convergence term β -0.01
(-3.4)
-0.01 (-3.3)
Adjusted R2 0.32 0.28 0.46 0.47 0.46 0.47
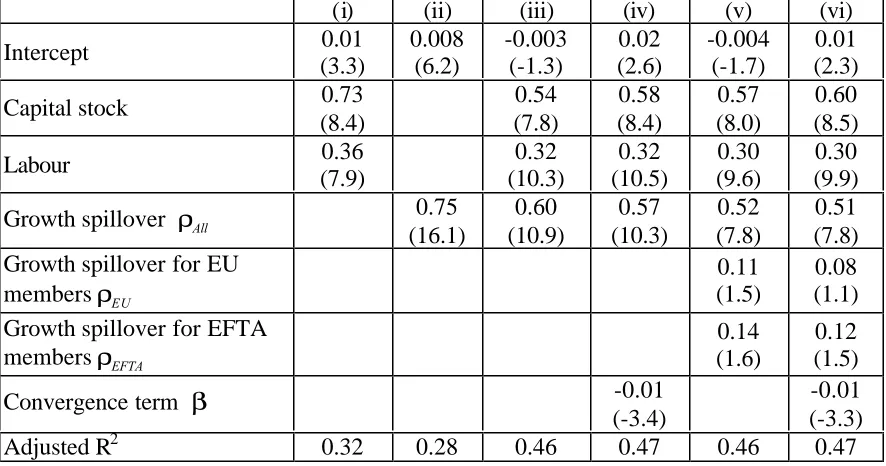
We find that the “growth externality”
ρ
has a positive and statisticallysignificant influence whether we include controls or not, confirming that there are trade-driven linkages across countries in the EU. This growth dependence among EU countries, enhanced by trade, enters with a coefficient of around 0.6. This suggests that if every trade partner of a given country experiences an extra growth of 1 percentage point, this country’s economy will grow around an extra
0.6 point as implied by the value of ρ in the third column of Table 1. While the
main result in Table 1 indicates that trade interactions affect the pattern of growth for countries of the EU, we cannot deduce an effect from the EU process itself. Of course, one can conclude that as the EU process has helped to increase trade amongst its members it has also promoted interdependent growth for a
natural interpretation of the ρW coefficient of the
g
yindependent variable isthat it increases with trade.5
In order to assess the influence of the EU process more precisely, we include dummy variables in the estimation to account for the fact that, along the period analysed, more and more countries have become members of the EU. We consider that growth interdependence among countries could happen in a
5
We performed alternative estimations of equation (6) where W was split into various dummy
reinforced way if, among other factors, any two countries belong to the same economic block, the EU in our case. This idea can be formally expressed modifying expression (2) as follows:
( ) ,
,
1
R i Rijt J
it it jt
R j
A Y
ρ ω
η
=
=
∏ ∏
; with
i
≠
j
and R All EU and EFTA= , 2’)where the different regimes of R refer to all countries, those belonging to the EU
and those belonging to the EFTA6.
After replacing (2’) into (1) and following the same process leading to expression (5) we obtain:
y All All y EU EU y EFTA EFTA y k l
g = +c ρ W g +ρ W g + ρ W g +αg + γg + ε
(5’)
where
W
EU and WEFTA are block diagonal matrices like W and where:,
, ,
1
if and both and belongto at year
0 otherwise
R ijt J
R ijt R ijt
s
x
i j i j R t
x w
=
≠
=
∑
The results of estimation of equation (5’) are reported in columns (iv) and (v) of Table 1. The results indicate that belonging to the EU or EFTA increases the growth dependence of its members. This effect seems to be greater for EFTA countries. The coefficients are, however, not very significantly different from
zero due to the fact that the variables W g W gAll y, EU y andWEFTA yg present high
correlation amongst them.
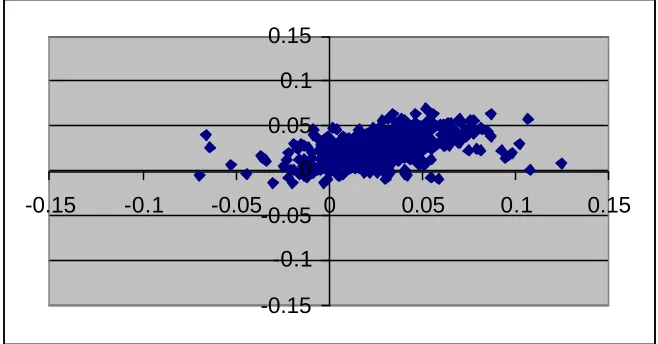
To solve that, we re-estimate equation (5’) including other non EU OECD countries: the United States, Canada, Japan, Norway, Switzerland, Australia and New Zealand. We have in this case 588 observations (21 countries and 28 years). The Moran scatterplot for this new set of countries (Figure 2) shows that there is again spatial dependence for the data.
6
Figure 2. Moran scatterplot for OECD countries: Growth in any one country against trade-weighted growth in the rest of the countries
-0.15 -0.1 -0.05 0 0.05 0.1 0.15
-0.15 -0.1 -0.05 0 0.05 0.1 0.15
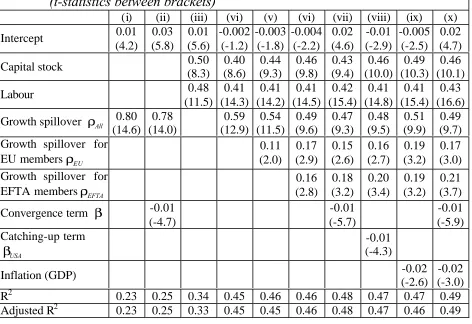
The results of re-estimating equation (5’) for this larger set of countries are shown in Table 2. As in the previous estimation for EU countries, we find that trade relations promote interdependent growth. We find also evidence that belonging to a trade club or other type of union, the EU or EFTA, affects the growth of the country members. Our estimates suggest (column vi in Table 2) that that if every trade partner of a given country experiences an extra growth of 1 percentage point, this country’s economy will grow around an extra 0.5 point
as implied by the value of ρAll . Moreover, if this country belongs to the EU there
is an additional 0.17 percentage point of growth added to the previous figure or an additional 0.16 point if it belongs to the EFTA. The collinearity problem we detected in the previous estimation has now almost disappeared. The overall growth externality seems now to be larger when more countries are added to the sample, with this increase due to a larger “club effect”. Without losing significance, these results hardly change when we control by convergence issues7 (columns ii, viii, ix and x).
In columns (ix) and (x) we added an inflation variable (GDP deflator) to the regressors in order to control for other unobserved characteristics of a club of countries, in particular that there has been co-ordination of macroeconomic policy amongst them, particularly in the case of the EU. The results show that growth externalities remain statistically significant and at about the same size previously found.
7
The parameter β measures the convergence of the country to its technological frontier,
whereas βUSA measures the catching-up with the US This last variable is defined as the
Table 2. Estimation of the interdependent growth spillover for OECD countries (t-statistics between brackets)
(i) (ii) (iii) (vi) (v) (vi) (vii) (viii) (ix) (x)
Intercept 0.01 (4.2) 0.03 (5.8) 0.01 (5.6) -0.002 (-1.2) -0.003 (-1.8) -0.004 (-2.2) 0.02 (4.6) -0.01 (-2.9) -0.005 (-2.5) 0.02 (4.7)
Capital stock 0.50
(8.3) 0.40 (8.6) 0.44 (9.3) 0.46 (9.8) 0.43 (9.4) 0.46 (10.0) 0.49 (10.3) 0.46 (10.1) Labour 0.48 (11.5) 0.41 (14.3) 0.41 (14.2) 0.41 (14.5) 0.42 (15.4) 0.41 (14.8) 0.41 (15.4) 0.43 (16.6)
Growth spillover ρAll 0.80 (14.6) 0.78 (14.0) 0.59 (12.9) 0.54 (11.5) 0.49 (9.6) 0.47 (9.3) 0.48 (9.5) 0.51 (9.9) 0.49 (9.7) Growth spillover for
EU membersρEU
0.11 (2.0) 0.17 (2.9) 0.15 (2.6) 0.16 (2.7) 0.19 (3.2) 0.17 (3.0) Growth spillover for
EFTA membersρEFTA
0.16 (2.8) 0.18 (3.2) 0.20 (3.4) 0.19 (3.2) 0.21 (3.7)
Convergence term β -0.01
(-4.7) -0.01 (-5.7) -0.01 (-5.9) Catching-up term USA
β (-4.3)-0.01
Inflation (GDP) -0.02
(-2.6)
-0.02 (-3.0)
R2 0.23 0.25 0.34 0.45 0.46 0.46 0.48 0.47 0.47 0.49
Adjusted R2 0.23 0.25 0.33 0.45 0.45 0.46 0.48 0.47 0.46 0.49
3. Conclusion
This paper uses bilateral trade data for EU and other OECD countries to measure trade related spillovers on growth. Several channels may be efficient to transmit spillovers, as our growth model shows, although we have opted for trade: namely, more trade interactions promotes interdependent growth. In our estimations we also allow for the effect of belonging to the EU, or any other club, to show up as a factor that reinforces this growth externality. Our empirical results show that an integration process like the one followed by the EU has an effect on the growth pattern of the country members. Although we have not strictly shown that integration (through trade) has increased the rate of growth in the EU, our results clearly indicate that deeper integration between countries leads to larger trade exchanges and to more interdependent growth patterns. As long as trade promotes interdependent growth, integration (through other policies) also promotes mutual growth.
externalities concentrate and what has been the effect of the EU process on the productive structure of its members.
References
Aghion, P. and P. Howitt (1998) Endogenous growth theory, MIT Press.
Anselin, Luc (1988) Spatial Econometrics: Methods and Models. Kluwer Academic Publishers.
Baldwin, R. (1993), “On the measurement of dynamic effects of integration”, Empirica 20.
Bernstein, J. and P. Mohnen (1998) “International R&D Spillovers between U.S. and Japanese R&D Intensive sectors”, Journal of International Economics 44:315-38
Bertola, G. (1992) “Models of economic integration and localised growth”, Discussion Paper 651 CEPR.
Bottazzi, L. and G. Peri, (2001) “Innovation and Spillovers in Regions: Evidence from European Patent Data” in www.econ.ucdavis.edu/faculty/gperi/Papers/euspill_final.pdf
Branstetter, L. (2001) “Are knowledge spillovers national or international in scope?. Microeconomic evidence from the U.S. and Japan”, Journal of International Economics 53:53-79.
Coe, D. and Helpman, E. (1995) “International R&D spillovers”, European Economic Review, 39:859-887.
Coe, D., E. Helpman, and A. Hoffmaister (1997) “North-South spillovers”, Economic Journal 107:134-149.
De Bresson, S. (1996) Economic interdependence and innovative activity: an input-output analysis. Aldershot, Edgar.
Eaton, J., and S. Kortum (1996) “Trade in ideas: patenting and productivity in the OECD”, Journal of International Economics 40:251-278.
Frankel, J.A. and D. Romer (1996) “Trade and growth: An empirical investigation”, NBER Working Paper 5476.
Garcia-Vega, M., and J. A. Herce (2002) “Integration and growth in the EU: the role of trade”, Información Comercial Española (Forthcoming).
Goicolea, A., J. A. Herce and J. J. de Lucio (1998) “Regional integration and growth: The Spanish case”, FEDEA DT 98-14.
Grinols, L. (1984) “A thorn in the lion’s paw: Has Britain paid too much for Common Market membership?”, Journal of International Economics, 16.
Grossman, G. and E. Helpman (1991) Innovation and growth in the global economy, Cambridge MA, MIT Press.
Haining, R. (1986) “Income diffusion and regional economics”, in Transformations through space and time, edited by Griffith and Haining Dordrecht. Martinus Nijhoff.
Helpman, E. and P. Krugman (1985) Market structure and foreign trade. Cambridge. MIT Press.
Keller, W. (2001) “International technology diffusion”, at: http://www.eco.utexas.edu/~keller/s110901.pdf
Lichtenbert, F., and B. van Pottelsberghe de la Potterie (1996) “International R&D spillovers: A re-examination”, NBER working paper #5688.
Meyer, J. (2001), “Technology diffusion, human capital and economic growth in developing countries”, UNCTAD working paper #154, Geneva, June.
Miller, M. and J. Spencer (1977) “The static economic effects of the UK joining the EEC: A general equilibrium approach”, Review of Economic Studies, 44.
Prewo, W. (1974) “Integration effects in the EEC”, European Economic Review, vol. 5.
Romer, P. (1990) “Endogenous technological change”, Journal of Political Economy 98:S71-S102.
Rivera-Batiz, L., and P. Romer (1991) “Economic integration and endogenous growth”, Quaterly Journal of Economics 106:531-555.
No. 12 Internal Migration in Regions of Germany: A Panel Data Analysis, Ashok Parikh and Michiel Van Leuvensteijn, September 2002
No. 11 Interdependent Growth in the EU: The Role of Trade, María
Garcia-Vega and José A. Herce, September 2002
No. 10 Equilibrium Rates and Wage Flexibility in Europe, R.C.M.H. Douven,
August 2002
No. 9 Midlife Caregiving and Employment: An Analysis of Adjustments in Work
Hours and Informal Care for Female Employees in Europe, C. Katharina Spiess and Ulrike Schneider, February 2002
No. 8 Turkey’s Performance in Attracting Foreign Direct Investment:
Implications of Enlargement, Henry Loewendahl and Ebru Ertugal-Loewendahl, November 2001
No. 7 Is the ECB sufficiently accountable and transparent? Lorenzo
Bini-Smaghi and Daniel Gros, September 2001
No. 6 Maastricht and the Choice of Exchange Rate Regime in Transition
Countries during the Run-Up to EMU, György Szapáry, September 2001
No. 5 What drove relative wages in France? Structural Decomposition Analysis
in a General Equilibrium Framework, 1970-1992, Sébastien Jean and Olivier Bontout, September 2001
No. 4 Foreign Direct Investment and Corporate Income Taxation in Europe,
Agnès Bénassy-Quéré, Lionel Fontagné, and Amina Lahrèche-Révil, April 2001
No. 3 European Labour Markets and the Euro: How much flexibility do we
really need?, Michael Burda, March 2001
No. 2 Asymmetric Labour Markets in a Converging Europe: Do differences
matter? Ray Barrell and Karen Dury, January 2001
No. 1 Fiscal federalism in Western European and selected other countries:
Centralisation or decentralisation? What is better for economic growth?,