Int. J. Electrochem. Sci., 8 (2013) 4610 - 4630
International Journal of
ELECTROCHEMICAL
SCIENCE
www.electrochemsci.org
Electrochemical Behavior of Titanium in Saline Media
Containing alga Dunaliella Salina and Its Secretions
F. El-Taib Heakal1,*, M.M. Hefny1, A.M. Abd El-Tawab2
1
Chemistry Department, Faculty of Science Cairo University, Giza 12613, Egypt
2
Egyptian Salts and Minerals Company (EMISAL), Egypt
*
E-mail: fakihaheakal@yahoo.com
Received: 15 January 2013 / Accepted: 25 February 2013 / Published: 1 April 2013
The present work shows how to make use of cell biology in corrosion control of technical titanium in highly saline solutions. Besides, it opens the door towards correlating cell secretions with corrosion parameters when live cells are adsorbed on the surface. Generally, the corrosion current density (jcorr,
μA/cm2) decreases in media containing alga Dunaliella Salina over the density range of ρ
c =
0.1-1.0×10⁵
cell/ml and then appears to approach a stabilized value. Results on the effect of glycerol and β–carotene secreted by the alga revealed that glycerol has no effect on the corrosion performance of technical titanium, while β–carotene can effectively mitigate the dissolution process of the sample. The increase in the total resistance (Rt/Ω cm2) of the film assigns the inhibition extent due to sealing effect
of the surface by β–carotene molecules and hence higher corrosion resistance for titanium. The inhibition mechanism is likely occurred via physical adsorption on the electrode surface following Temkin isotherm. This mostly happens through the conjugate system of the double bonds in the inhibitor molecular formula. Effect of pH of sulfate solution on the degree of surface coverage by β– carotene indicated that a maximum inhibition efficiency of ~ 90% is achieved at pH around 7.0.
Keywords: Technical titanium; Alga Dunaliella Salina; β–carotene; EIS; Neutral and acidic corrosion
1. INTRODUCTION
petrochemical and biomaterial industries. These are because titanium alloys have light weight, excellent corrosion resistance and superior biocompatibility coupled with good strength [1]. On the other hand, owing to their high heat transfer coefficient combined with moderate to high strength, hardness, wear resistance and good fatigue properties most heat exchanger equipments are made from titanium alloys. Unfortunately, these equipments are prone to severe corrosion when they are used in factories for the production of several salts from the highly aggressive hyper saline water, such that of the Lake Quaroun (Fayioum, Egypt) having salt concentration of more than 10 wt.% [2]. This is one of the reasons why corrosion protection methods should be used. The most practical method for protecting metals and alloys against harmful degenerative influence of a strong corrosive medium is the use of organic inhibitors [3]. Also, it is of prime importance that inhibitors must be added to alleviate or prevent the corrosive action of acids on metal surfaces during pickling, cleaning and de-scaling of heat exchangers [4]. Inhibitors for acid corrosion of titanium materials are rare and badly needed for many industrial applications.
Nowadays, beside the efficiency of the inhibitor, it should be nontoxic, biodegradable and readily available. In this respect, many of the natural products had been found to be effective [2,5,6]. All these make investigating the electrochemical behavior of technical titanium alloy in artificial high saline media containing the caroteniod alga Dunaliella Salina, and in sulphate solutions containing natural β–carotene an important subject worthy for systematic studies. The tested alga secrets a relatively massive amount of the precious compound β–carotene (Scheme 1), which is a useful biological material. The present investigation showed that it (and expectedly compounds with similar structures) can act as a corrosion inhibitor for titanium alloys. This result looks promising because non-toxic and environmentally benign corrosion inhibitors for titanium materials in highly saline solutions are scarce [7]. Additionally, the present study is of interest primarily due to the fact that natural products are environmentally friendly and ecologically acceptable.
Scheme 1. Structure formula of β–carotene.
Scheme 2. The alga Dunaliella Salina photographed from R.W. Butcher [8].
Although the corrosion behavior of titanium and its alloys have been the subject of extensive studies, yet the acid corrosion inhibitors for titanium materials concerning the acid de-scaling of heat exchanger are rarely found for industrial applications [7]. These inhibitors are important to be added in the acid de-scaling of heat exchangers. Moreover, titanium is often performed well in media that cause pitting and crevice corrosion for stainless steel (e.g. seawater, wet chlorine, organic chlorides). While titanium is resistant in these media, it is not immune and can be susceptible to pitting and crevice attack at elevated temperature causing a serious problem. Crevice damage is a localized form of corrosion. Under creviced conditions, the occurrence of film flaws is the key process leading to the development of acidity and the initiation of creviced corrosion [10].
Titanium and its alloys owe their excellent corrosion resistance to the formation of passive TiO2 films on their surfaces at room temperature. The poor adherence of the film, which reduce its
protection, as well as the other detrimental features of the surface film depend on its formation conditions and the composition of the forming medium, especially in the presence of adsorbed materials such as natural biomasses [11]. This film provides chemical inertness to the metallic substrate in many aqueous media and assures its biocompatibility as a biomaterial. However, in their native form TiO2 films have poor mechanical properties and they are easily fractured under fretting
Specific environments can cause the breakdown of passivity of this system. These environments could be inorganic, organic or biological [16].
2. EXPERIMENTAL DETAILS
2.1. Solutions
Analytical grade chemicals and triple distilled water were used throughout for the preparation of different solutions. A stock 1.0 M H2SO4 solution was used to adjust the pH of 1.0 M Na2SO4 (pH
7.0) test solution to the desired pH value. The solution pH was checked by a sensitive pH-meter, model 15 Denver, USA. Artificial highly saline solution (free media) in which the alga can survive, was prepared by sequential additive of 175.5 g NaCl, 42.6 g Na2SO4 and 36.1 g MgSO4.7H2O, to less
than one liter of distilled water. To ensure complete dissolution of the different salts, the solution was boiled, and then cooled to the room temperature. Calculated amounts from the minor components, namely, urea, potassium dihydrogen phosphate, iron-EDTA and sodium bicarbonate were added to get the recommended final concentrations of 0.1, 0.2, 0.002 and 2.0 mM, respectively. Finally the solution was completed to one liter with distilled water and became ready for being used as homogeneous salt media for the various experimental tests.
2.2. Culturing of the alga
time t/d
2 4 6 8 10 12 14
c
(N
c
/ m
l)
0.0 0.1 0.2 0.3 0.4 0.5 0.6 0.7
-carotene (
g/m
l)
0 2 4 6 8 10 12 14 16 18 20
alga cell
[image:4.596.168.431.448.693.2]-carotein
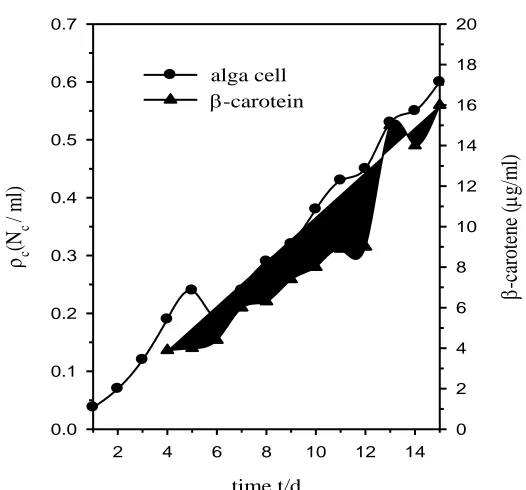
Figure 1. Changes in alga Dunaliella Salina cell number (Nc) density (ρc = Nc/ml) and its secreted
A crop of the alga Dunaliella Salina was supplied from SRI, China. A volume of 250 ml of the crop solution with a cell density of 1.5×10⁵
cell/ml, was added to each liter of the media in a tank. It was kept under net shade exposed to sun light and moved to a cool place when the atmospheric temperature exceeds 35 oC and vice versa, being shaken once each hour during day-time. This culture was diluted with proper amounts of the media according to the growth rate so that the volumetric cell number density does not exceed 20×105
cell/ml. Also, it was diluted with distilled water to compensate for evaporation, thereby keeping the salinity constant [17]. Changes in cell density and β-carotene content in μg/ml with the growth time (t/d) were recorded daily in saline media over an extended time period of 15 d, and the results are given in Fig. 1.
2.3. Extraction of β-carotene
The extraction of β-carotene from a culture of the alga Dunaliella Salina was made using 90% (by volume) acetone. The separation was carried out by manual shaking until two layers were formed, where the upper layer contained the β-carotene. The concentration was then determined using a manual operating spectrophotometer Perkin Elimar of (USA) at a wave length of 450 μm [18]. The same instrument has been used for the determination of chlorophyll, which was extracted from the solution layer attached to the electrode surface exposed to a solution of alga Dunaliella Salina. This has been achieved by leaching and dissolving the layer in 80% (by volume) acetone solution [19].
2.4. Specimen preparation
The tested technical titanium sample was supplied from Wah Chang Co., Belgium. The heat exchangers in EMISAL Company (Egypt) have been manufactured from this material, which has the following chemical composition in mass percent: 0.30 Fe, 0.25 O, 0.06 C, 0.03 N, 0.015 H and balance Ti. The working electrode used was machined in the form of a rod with 2.0 cm length and 0.24 cm2 cross sectional area. Electrical connection was achieved by mechanical jamming a stout copper wire of 1 mm diameter and 20 cm in length to the upper end of the electrode. The rod was then fixed by epoxy resin in a Pyrex glass tube with an appropriate diameter leaving only the base cross sectional area to face the test solution. Before each experiment the electrode surface was mechanically ground with successive finer grades of emery papers (600-1200 grit) until the surface appeared free from any scratches and other apparent defects. It was then rubbed with a smooth polishing cloth, washed with ultra pure water and transferred quickly to the electrolytic cell.
2.5. Measurements
data were recorded using an electrochemical workstation IM6e Zahner-elektrik, GmbH, (Kronach, Germany) controlled by a personal computer provided with Thales software. The EIS were carried out by first stabilization at open circuit potential (OCP) until a steady-state potential value was reached (usually after 30 min immersion in the test solution), with a perturbation signal of 10 mV amplitude. The method involves direct measurements of the absolute impedance (|Z|, in ohm) and the phase shift (Ø, in degree) over a frequency domain from 100 kHz down to 0.10 Hz, which is the measuring limit of our instrument. All potentials were measured against and referred to the saturated calomel electrode (SCE), ESCE = 0.241 V vs. SHE. Finally, potentiodynamic curves were recorded by increasing the
potential at a scan rate of 3 mV/s starting from -1.0 V to +0.3 V.
3. RESULTS AND DISCUSSION
3.1. Open circuit potential behavior
Time t/s
0 200 400 600 800 1000
E(t)
/V
(v
s. SCE)
-0.62 -0.60 -0.58 -0.56 -0.54 -0.52 -0.50
free salt media with c= 0.5x10⁵ cell/ml
with c=1.0x10⁵ cell/ml
[image:6.596.226.374.318.505.2](a)
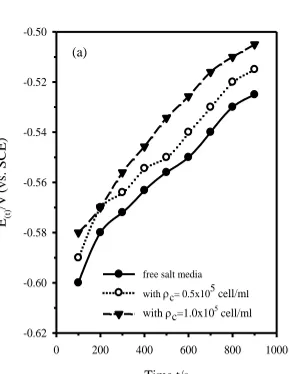
Figure 2a. Evolution of the OCP (E(t)) of technical titanium with immersion time (t/s) in salt media
free or containing the alga cell.
(b)
log (t/s)
2.0 2.2 2.4 2.6 2.8 3.0
E(t
)/V (v
s. SC
E)
-0.62 -0.60 -0.58 -0.56 -0.54 -0.52 -0.50
free salt media with c = 0.5x10
5
cell ml-1
with c =1.0x10 5
cell ml-1
[image:6.596.227.375.557.739.2]
(c)
(10-5x c) cell/ml
0 1 2 3 4 5 6
Ep
/V
(v
s.
SCE)
-0.525 -0.523 -0.521 -0.519 -0.517 -0.515 -0.513 -0.511 -0.509 -0.507 -0.505
[image:7.596.206.377.82.267.2]Ep = E(t) at t = 15 min
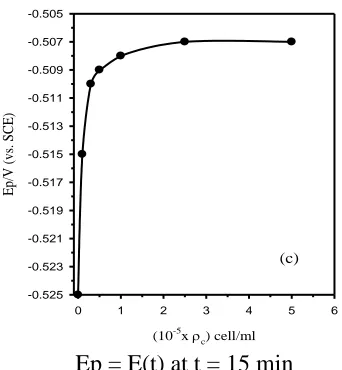
Figure 2c. Variation of the steady potential (Ep = E(t) at t = 15 min) of technical titanium with the
alga cell density (ρc).
Fig. 2a shows the evolution of open circuit potential E(t) of technical titanium electrode in salt media free or containing different occlusions of algae Dunaliella Salina. As can be seen, E(t) shifts with time in the more electropositive direction of potential indicating spontaneous passivation, possibly due to continuous healing and growth of a certain barrier film on the electrode surface [20,21]. The rate of potential change seems to increase a little with increasing exposure time. By considering the variation of E(t) with log (t/s) two intersecting linear segments are obtained, as depicted in Fig. 2b. Such behavior indicates that the growing surface film has a duplex nature [20,22,23].
Table 1. Values of b1 and b2 (for the inner and outer layers) of titanium surface film and its potential
(Ep) after 1h immersion in salt media free or containing different alga densities
Alga density (aρc cell/ml)
b
b1
(V/decade)
b
b2
(V/decade)
c
Ep
(VSCE)
Free media 0.033 0.090 -0.510
0.5×10⁵
0.068 0.300 -0.508
1.0×10⁵
0.090 0.300 -0.507
a
ρc: cell number (Nc)/ml. b
b1 and b2: slopes of the linear relation segments in Fig. 2b. c
Ep: Ep = E(t) at t = 3600 s.
According to the literature [24] the film on titanium materials has a bi-layered structure consisting of a barrier inner layer formed probably by thickening of the pre-immersion native TiO2
logarithm law (Eq.1), for which the formation process is likely the rate-limiting step in the dissolution-precipitation mechanism [25,26]:
E = Eo + b log (t/s) (1)
where Eo is the initial potential and b is the slope of the linear plot in V/decade.
Table 1 lists some b values as a function of the alga cell density (ρc) per ml (ρc = Nc/ml, Nc being
the cell number). Moreover, Fig. 2c reveals clearly that after immersing technical titanium in the media for 30 min, its free steady potential (Ep/V vs. SCE) moves continuously towards more noble values
with increasing the alga cell density quickly at first and then slowly when ρc exceeds 0.5 × 10⁵ cell/ml
until reaching an almost fixed value of -0.507 V (vs. SCE). At an ultimate alga density level of ~2.5×10⁵
cell/ml the metal surface is supposed to be completely covered by a protective physical barrier, most likely due to the formation of an adsorbed biofilm containing the alga cell [27]. This causes retardation of the anodic process by blocking the active anodic sites on the corroding surface. The formation of the biofilm was confirmed by stripping and analyzing the surface layer. In an experiment performed by slicing and microbiological analysis of the part of solution adjacent to the metal revealed accumulation of the alga cells at the electrode surface. The density of the alga cell was found to be mostly ten percent higher than that in the bulk of the test media. Furthermore, spectroscopic investigation [2] of that solution part showed the presence of β-carotene which is the major secreted substance from Dunaliella Salina. Thus, enhanced positive shift of the free potential (Ep) in the presence of alga Dunaliella Salina cell can be attributed to several factors, including its
accumulation at the electrode surface, adsorption of its secreted β-carotene, as well as production of oxygen due to the alga metabolic and the photosynthesis processes caused by the scattered light [28].
[image:8.596.158.412.517.717.2]3.2. Potentiodynamic polarization behavior
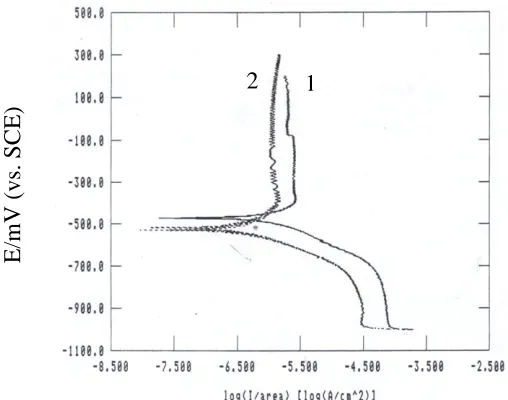
Figure 3. Poteniodynamic polarization curves of technical titanium: (1) in free salt media and (2) in presence of the alga at ρc = 1.0×10⁵ cell/ml.
1 2
E/mV (vs. SC
(10-4xc) cell/ml
0 10 20 30 40 50
jco
rr
(
A
/cm
2 )
[image:9.596.194.383.83.317.2]1.2 1.4 1.6 1.8 2.0 2.2 2.4
Figure 4. Dependence of the corrosion current density (jcorr) on the alga cell density (ρc /ml) in the salt
media.
Typical examples of cathodic and anodic potentiodynamic scans for technical titanium obtained in salt media without or with alga density of 1.0×10⁵
cell/ml are shown in Fig. 3.
In general, the polarization curves have similar shape in both cases, but with different values, where at any given potential the polarizing current density is always lower in the media containing the alga.
(a)
Anodization potential / V (vs.SCE)
0.0 0.2 0.4 0.6 0.8 1.0
Es/V (
v
s.
SC
E)
-0.60 -0.55 -0.50 -0.45 -0.40 -0.35 -0.30 -0.25
free salt media
with c =1.0x10⁵ cell/ml
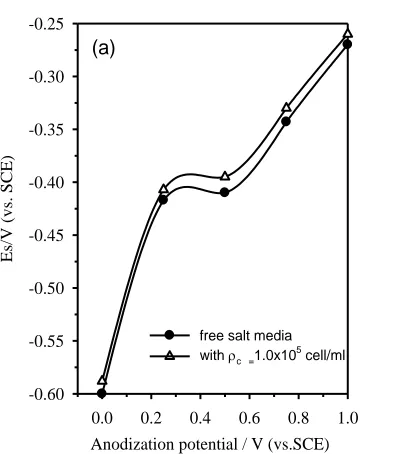
Figure 5a. Dependence of the steady potential (Es/V vs.SCE) after 1 h immersion on the forming
[image:9.596.201.399.474.701.2]
(b)
Anodization potential/V (vs.SCE)
0.0 0.2 0.4 0.6 0.8 1.0
jcorr
(
A/cm
2 )
0.0 0.5 1.0 1.5 2.0 2.5
free salt media
c=1.0x0 5
cell/ml
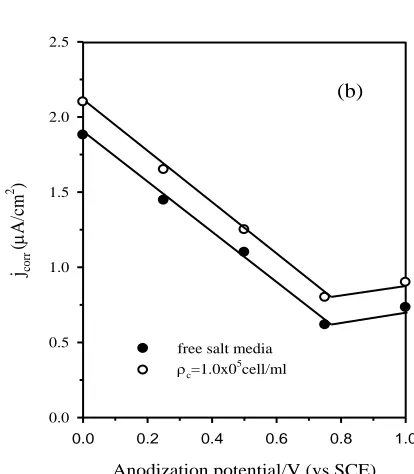
Figure 5b. The decrease in the corrosion current density (jcorr) with the forming anodizing potential of
modified titanium surfaces in the absence and presence of the alga cell at ρc = 1.0×10⁵ /ml in
salt media.
The value of the corrosion current density (jcorr, μA/cm2) in each solution was estimated using
the software provided with the electrochemical workstation, and represented graphically as a function of the alga cell density (ρc) in Fig. 4. The action mechanism of Dunaliella Salina via biofilm formation
has the general feature of an adsorption process, i.e. upon complete coverage (saturation) of the surface by the alga at a density of ~1.0×10⁵
cell/ml, the effect of alga concentration on jcorr value becomes
negligible. This trend is also evident from the change in the value of the free steady potential (Ep)
shown in Fig. 2c. It is likely that alga Dunaliella Salina cell is adsorbed preferentially on the defective anodic and cathodic sites of the metallic substrate and thus enhances passive film formation on its surface.
Furthermore, the inhibitive effect of Dunaliella Salina towards modified titanium surfaces obtained by anodizing the metal up to different potential values, have been also investigated. Anodization is a useful technique which affords oxide films with various controlled thicknesses on the metal, thereby having different surface properties [29]. It is notable that thickness and electrical properties of anodic oxide films on titanium are both strongly dependent on the formation potentials [30,31]. Fig. 5a indicates that the steady potential (Es/V vs. SCE) of the modified electrode measured
after its steeping in salt media for 1 h, is always more electropositive in the presence of the alga at ρc =
1.0×10⁵
cell/ml than in its absence for any anodized surface, suggesting that alga cell can stimulate the formation of better passive films. The improved metal performance is further confirmed by the results presented in Fig.5b, where the corrosion rate in term of the corrosion current density (jcorr) for a given
[image:10.596.184.391.75.312.2]
for the anodized surface than for the abraded one. Another explanation for the inhibition activity of alga Dunaliella Salina may be due to stimulating film healing and thickening by increase the level of oxygen in the media resulting from its metabolic processes. On the other hand, change in the susceptibility of the oxide films towards chemical dissolution can also be ignored in the present study, because alga Dunaliella Salina does not have any ability to change the pH of the medium by absorbing CO2, due to the auto buffering action of the highly saline media used. In addition, the influence of the
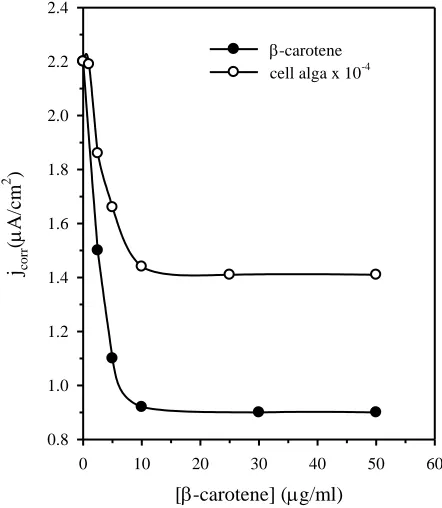
other secreted substances glycerol and β-carotene was also investigated using the same techniques. The conclusion drawn from the obtained results was that glycerol has no influence on the corrosion behavior of technical titanium, whereas β-carotene has almost the same effect as the tested alga. Fig. 6 shows that the decrease in the corrosion current density of technical titanium with β-carotene is much higher than the decrease due to the presence of the whole alga cell at various concentrations. This confirms that the effective material in the inhibition mechanism is β-carotene.
[-carotene] (g/ml)
0 10 20 30 40 50 60
jco
rr
(
A
/cm
2 )
0.8 1.0 1.2 1.4 1.6 1.8 2.0 2.2 2.4
[image:11.596.186.407.300.554.2]-carotene cell alga x 10-4
Figure 6. Change of corrosion current density (jcorr) of technical titanium with β-carotene addition in
μg/ml; the results with the alga are given for comparison.
3.3. Electrochemical impedance spectroscopy
of β-carotene inhibition against corrosion of technical titanium. It is also well known that corrosion inhibitors for titanium materials are rare, and if any they are not significant probably because of the good corrosion resistance of titanium and its alloys in aqueous environments [34]. Thus, searching for efficient inhibitors to control the corrosion of titanium materials is beneficial with regard to acid de-scaling and salt laden media. In the following series of experiments EIS was used to investigate the role of β-carotene as a corrosion inhibitor for technical titanium in sulfate media of different pH. The β-carotene inhibitor used was extracted from the unicellular alga Dunaliella Salina as described and referred to before in the experimental section.
[image:12.596.158.442.273.459.2]3.3.1. Behavior in 1.0 M H2SO4
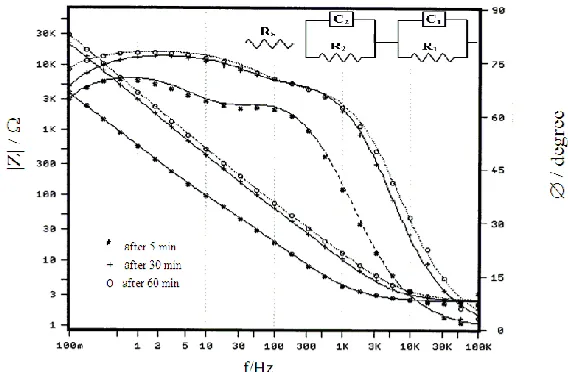
Figure 7a. Bode plots for the measured and fitted EIS data of technical titanium in free 1.0 M H2SO4
as a function of the immersion time. The inset represents the equivalent circuit model with two series time constants used to fit the experimental results ( Rt =
(b)
Time t/min
10 20 30 40 50 60
Rt
/ k
cm
2
20 40 60 80 100 120 140
1
/C
t
(cm
2/
F)
0.000 0.005 0.010 0.015 0.020 0.025 0.030 0.035
Rt 1/Ct
Figure 7b. Variation of Rt and 1/Ct with the immersion time for technical titanium in free 1.0 M
H2SO4 solution.
[image:12.596.220.379.532.696.2]
H2SO4 solution at different immersion periods. As can be noted, all impedance diagrams show a
distinct capacitive behavior, typical of passive materials, at mid to low frequencies as inferred by a very broad phase peak, indicating the presence of a highly stable passive layer on the electrode surface [20,22,24,35]. The figure reveals that the increase in the immersion time leads to increase of the impedance modulus (|Z|) at 0.1 Hz, which is dominated by the properties of the barrier layer. In addition, the broadness of the phase peak becomes more evident with time. This behavior demonstrates spontaneous passivation due to the development of a more resistive corrosion product film on the sample surface, which grows by a dissolution-precipitation mechanism [31]. On the other hand, the behavior tends to be resistive at higher frequency region, where the phase angle (Ø/degree) after any elapsed period falling rapidly to zero with increasing frequency. This impedance limit corresponds to the solution resistance.
In fact, each obtained wide phase peak confirms the presence of two interlacing time constants, the one at high frequencies is determined by the kinetics of the corrosion process, while that at low frequencies is determined by the dielectric properties of the film [2]. Therefore, analysis of the obtained results was made by fitting the impedance data to the appropriate equivalent electrical circuit (EEC) drawn as inset in Fig. 7a. This electronic model takes into account the presence of a duplex surface film, and was found to give the best fitment with the experimental impedance spectra, as depicted in Fig. 7a, and the similar ones with an average error of less than 3% for the whole frequency range. The suitability of an EEC was evaluated based on the quality of the fit to the experimental data, the relative error in each parameter and the physical meaning attributable to each circuit element. In all of the present Bode plots the points represent the measured values and the respective continuous curve represents the simulating results according to the suggested model. The successful proposed model consists of a capacitance and resistance parallel combination (C1R1) assigns to the inner barrier layer of
the surface film serial connected to another parallel combination (C2R2) related to the capacitance and
resistance of the outer porous layer, and the two circuits are in series connection with the solution and other uncompensated ohmic resistance (Rs). The fitment procedure was carried out using Thales
software provided with the impedance workstation, where the following dispersion formula representing the electrode impedance was used in the fitment process [36-38]:
) 2 ( ) ( 1 ) ( 1 ) ( 2 1 2 2 2 1 1 1 n n s j C R R j C R R R Z
In this transfer complex function (Eq. 2) the two empirical exponents n1 and n2 varying
Table 2. Equivalent circuit parameters for technical titanium in 1.0 M H2SO4 at various immersion
times
Time R1 C1 α1 R2 C2 α2 Rs
(t/min) (kΩ cm2)
(μF/cm2
) (kΩ cm2) (μF/cm2) (Ω cm2)
5 26.51 97.10 0.87 2.96 308.59 0.82 0.53
30 64.48 79.40 0.88 3.48 194.63 0.79 0.54
60 122.27 32.10 0.82 4.85 701.36 0.80 0.52
At the low frequency limit, it can be seen that n1 ~ 0.8, indicating that the corrosion process is
not controlled by diffusion. Furthermore, evolution of the corrosion process leads to increase the inner layer thickness as inferred from the decrease of C1 value; C is being inversely proportional to the oxide
thickness (d/cm) [20,22,31,35,41] following the expression for a parallel plate capacitor: C = εoεr/d,
where εo and εr are the vacuum permittivity (8.85×10⁻¹² μF/cm) and relative dielectric constant of the
oxide layer, respectively. On the other hand, C2 increases indicating that the outer layer thickness of the
surface oxide film decreases with time. Regarding the bulk of the oxide, it becomes more impervious as it grows since R1 andR2 are both increased [35]. Fig.7b presents as well the variation of total film
resistance (Rt = R1 + R2) and its total relative thickness (1/Ct = 1/C1 + 1/C2) in 1.0 M H2SO4 as a
function of the exposure time (t/min). The results reveal that, both of the two parameters increase with time evolution, suggesting continuous improvement in the corrosion performance of technical titanium in the tested medium.
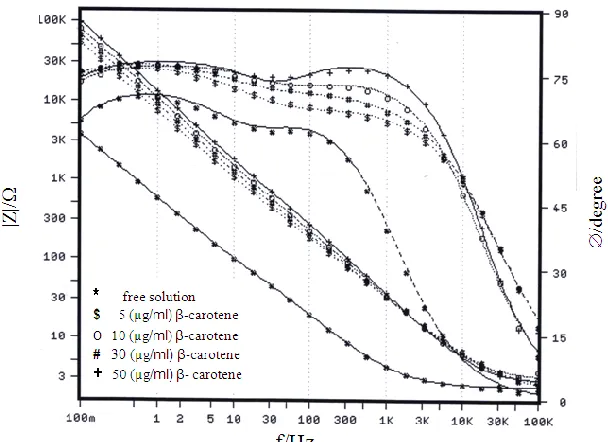
3.3.2. Effect of β-carotene
[image:14.596.99.496.112.202.2] [image:14.596.141.445.495.716.2]
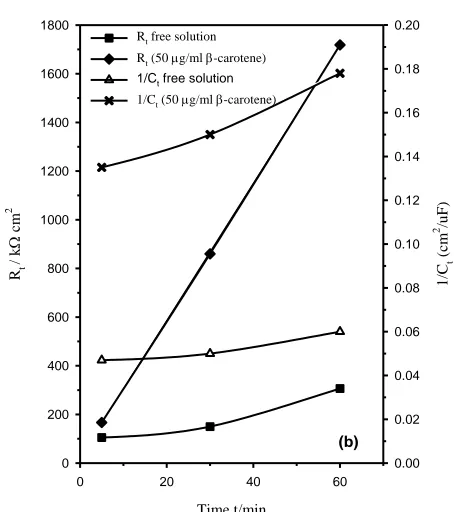
Figure 8b. Increase of Rt and 1/Ct with the exposure time for technical titanium in 1.0 M Na2SO4
solution (pH = 7.0) free or containing 50 μg/ml β-carotene.
In these experiments, EIS Bode plots of technical titanium were recorded after 60 min exposure in 1.0 M H2SO4 solutions containing different additions of β-carotene in μg/ml as presented
in Fig. 8a. All spectra reflect qualitatively the same features, indicating that β-carotene does not modify the mechanism of corrosion but merely decreases the corrosion rate of the sample, so the absolute impedance (|Z|) at the low frequency limit increases with increasing β-carotene level [42]. As revealed in Fig. 8b the increase in both Rt and 1/Ct values with the immersion time is more remarkable in the
presence β-carotene, which likely indicates an increase in the growth rate of oxide formation, or a decrease in the rate of its dissolution. Thus, the role of β-carotene refers to sealing of the surface by an adsorbed layer incorporated the oxide film and hence higher resistance to corrosion, where at any immersion time both C1 and C2 values decrease with increasing the inhibitor concentration.
Subsequently, one can calculate the degree of surface coverage (θ) from the relation [38,43]:
θ = 1- Ro
t / Rt (3)
where Rt and Rot are the total resistance of the surface film in the presence of β-carotene and in
its absence, respectively. Fig. 9a shows the dependence of θ on the inhibitor concentration, while Fig. 9b confirms the obedience to Temkin isotherm of the adsorption behavior of β-carotene on technical Ti as expected for a rough surface [44]. The Temkin isotherm can be written in its simplified version as follows:
(b)
Time t/min
0 20 40 60
Rt
/ k
cm
2
0 200 400 600 800 1000 1200 1400 1600 1800
1
/C
t
(
cm
2 /u
F)
0.00 0.02 0.04 0.06 0.08 0.10 0.12 0.14 0.16 0.18 0.20 Rt free solution
Rt (50g/ml -carotene)
[image:15.596.189.416.79.335.2]
log θ = y + x log Cinh (4)
where y and x are two empirical constants and Cinh is the equilibrium adsorbent concentration in
solution, y is equal to log θ at unit Cinh and x is the slope of the linear relationship between log θ and
log Cinh.
(a)
[-carotine] (g/ml)
0 10 20 30 40 50 60
[image:16.596.149.401.165.362.2]0.0 0.1 0.2 0.3 0.4 0.5 0.6 0.7
Figure 9a. Adsorption isotherm of β-carotene on technical titanium in 1.0 M H2SO4 solution at 30 oC.
(b)
log ([-carotene] (g/ml))
0.6 0.8 1.0 1.2 1.4 1.6 1.8
log
-0.36 -0.34 -0.32 -0.30 -0.28 -0.26 -0.24 -0.22 -0.20
Figure 9b. log θ-log (β-carotene, μg/ml) plot for technical titanium in 1.0 M H2SO4 solution to fit
Temkin isotherm (Eq. 4).
[image:16.596.186.399.409.621.2]
3.3.2. Effect of pH
Figure 10. Bode plots for the measured and fitted EIS data of technical titanium after 60 min immersion in 1.0 M Na2SO4 solution with pH 7.0 containing different β-carotene additions.
Table 3. Equivalent circuit parameters for technical titanium at various immersion times in 1.0 M Na2SO4 solution of pH 3.0free or containing different additions of β-carotene
Time (t/min)
R1
(kΩ cm2
)
C1
(μF/cm2
)
α1 R2
(kΩ cm2
)
C2
(μF/cm2
)
α2 Rs
(Ω cm2
)
Free solution
5 41.02 36.16 0.80 39.80 97.05 0.63 1.84 30 97.91 31.75 0.89 55.22 70.41 0.67 1.88 60 180.63 29.80 0.89 69.12 53.23 0.71 1.88 5 μg/ml β-carotene
5 34.80 39.36 0.87 33.33 66.36 0.62 1.70 30 101.53 33.55 0.88 57.29 45.50 0.66 1.71 60 183.22 29.32 0.87 55.31 41.82 0.60 1.73 10 μg/ml β-carotene
5 29.23 40.87 0.86 52.58 38.44 0.63 1.73 30 121.90 32.09 0.87 66.11 30.24 0.67 1.76 60 218.44 28.61 0.86 72.71 26.13 0.68 1.78 30 μg/ml β-carotene
5 243.93 36.23 0.93 0.323 3.15 0.83 3.78 30 264.42 34.87 0.87 0.024 114.36 0.74 2.17 60 355.13 34.67 0.87 0.025 116.77 0.74 2.18 50 μg/ml β-carotene
[image:17.596.152.444.114.317.2] [image:17.596.88.511.420.739.2]
Table 4. Equivalent circuit parameters for technical titanium at two immersion periods in 1.0 M Na2SO4 solution of pH 7.0free or containing different additions of β-carotene
Time R1 C1 α1 R2 C2 α2 Rs
(t /min) (kΩ cm2) (μF/cm2) (kΩ cm2) (μF/cm2) (Ω cm2) Free solution
5 48.93 32.72 0.87 56.31 58.30 0.70 1.83 60 231.71 30.33 0.88 74.83 36.91 0.72 1.70 5 μg/ml β-carotene
5 42.60 22.28 0.82 88.42 11.82 0.60 1.61 60 381.03 36.16 0.83 70.74 17.11 0.73 2.01 10 μg/ml β-carotene
5 69.21 30.94 0.75 47.22 26.52 0.62 1.70 60 550.24 18.68 0.82 88.10 15.20 0.67 1.71 30 μg/ml β-carotene
5 79.62 26.70 0.82 51.41 32.81 0.73 1.92 60 716.90 20.57 0.82 62.73 27.11 0.74 2.01 50 μg/ml β-carotene
5 92.33 21.67 0.78 74.82 11.20 0.64 1.70 60 1624.54 14.67 0.79 94.10 9.10 0.66 1.84
The effect of β-carotene concentration on the sample behavior observed in 1.0 M Na2SO4
solutions of pH 3.0 and 7.0 was also investigated by EIS at various immersion periods. Fig. 10 shows a typical example for the results obtained after 60 min exposure in sulfate solution of pH 7.0. The theoretical impedance parameters derived from the fitment analysis of the experimental data using the EEC model shown as inset in Fig. 7a are all summarized in Tables 3 and 4.
(a)
pH
0 2 4 6 8
Rt
/ k
cm
2
0 500 1000 1500 2000
1
/C
t
(
cm
2/
F)
0.00 0.02 0.04 0.06 0.08 0.10 0.12 0.14 0.16 0.18
Rt (50 g /ml -carotene) Rt free solution
[image:18.596.81.514.111.348.2]1/Ct (50 g/ml -carotene) 1/Ct free solution
Figure 11a. Variation of Rt and 1/Ct for technical titanium with the pH of (1.0 M Na2SO4 + 50 μg/ml
[image:18.596.167.428.471.701.2]
(b)
pH
0 2 4 6 8
60 70 80 90
Figure 11b. Variation of inhibition efficiency (θ%) with the pH of (1.0 M Na2SO4 + 50 μg/ml
β-carotene) solution.
From these data and the results of Figs. 11 and 12, it is worthy to note the following:
(a) In free sulfate solution both Rt and 1/Ct values increase with pH, being at a slightly
higher rate over the pH range 0.0-3.0 than afterward.
(b) On the other hand, in β-carotene containing solutions the two same mentioned parameters decrease slightly up to pH 3.0 followed by an abrupt increase in their values at higher pH. Thus, at pH 7.0 and after 60 min exposure Rt reaches 1.72 MΩ cm2 and 1/Ct becomes equal to 0.178
cm2/μF compared to 306.5 kΩ cm2 and 0.060 cm2/μF, respectively in the free 1.0 M Na2SO4 solution.
(c) Adsorption of β-carotene decreases both C1 and C2 capacitances of the interface. It is
well established that the extent of adsorption depends on the charge of the surface, being a maximum at the isoelectric point of the electrode surface [45] for the adsorption of neutral species. The solubility of a substance in water is significant as well, in the sense of the chemical compatibility between the water and the solute. Generally, the more hydrophilic a substance the less likely it is to be adsorbed. Conversely, a hydrophobic substance will more likely be adsorbed [42].
(d) The inhibition efficiency (θ%) of β-carotene increases with pH first at a high rate over the acidic pH range and then tends to stabilize in neutral solution, reaching ~ 90% at almost pH 7.0.
4. CONCLUSIONS
[image:19.596.173.422.71.305.2]
technical titanium in highly saline media can be significantly improved in the presence of alga Dunaliella Salina or its secreted β–carotene compound. However, the decrease in the corrosion rate due to β–carotene addition is much greater than the decrease due to the presence of the whole alga cell at various concentrations. Moreover, the decrease in the corrosion rate for the modified anodized titanium surface is higher compared to the non-modified abraded one, suggesting that alga cell can be also adsorbed on the oxidized titanium surface. The obtained EIS data showed that the total resistance (Rt) of the surface film in sulphate solution, as well as its relative thickness (1/Ct) are both increased
appreciably with immersion time specially when β–carotene is in solution. The dependence of surface coverage (θ) on β–carotene concentration indicates an adsorption mechanism for its inhibitive action in accordance to Temkin isotherm. Additionally, the percentage inhibition (θ%) was found to increase with increasing the pH of the test medium, and its value tends to stabilize in the neutral sulfate solution reaching ~ 90% at pH 7.0.
References
1. D.w. Shoesmith, J.J. Noël, Corrosion of titanium and its alloys, in Shreir’s Corrosion Fourth Edition, Volume 3, Academic Press, New York, 2010, p. 2042.
2. F. El-Taib Heakal, M.M. Hefny, A.M. Abd El-Tawab, J. Alloys Compd. 491 (2010) 636-642. 3. D.A. Jones, Principles and prevention of corrosion, Macmillan, New York, 1992.
4. X. Li, S. Deng, H. Fu, Corrs. Sci. 62 (2012) 163-175.
5. B.E.A. Rani, B.B.J. Basu, Int. J. Corros. (2012) Article ID 380217. doi 10.1155/2012/380217. 6. P.C. Okafor, M.E. Ikpi, I.E. Uwah, E.E. Ebenso, U.J. Ekpe, S.A. Umoren, Corros. Sci. 50 (2008)
2310-2317.
7. A.M. Abd El-Tawab, Ph.D. Thesis, Cairo University, 2009. 8. R.W. Butcher, Fish Invest Lond. Ser. IV ( 1959) 1-74.
9. J. Steiu (Ed.), Handbook of physiological methods-culture methods and growth measurements. Cambridge University, Cambridge, 1975.
10.X.H. He, J.J. Noël, D.W. Shoesmith, J. Electrochem. Soc. 149 (2002) B440-B449. 11.M. Long and H.J. Rack, Biomaterials 19 (1998)1621-1639.
12.M.M. Pariona , I.L. Müller, J. Braz. Chem. Soc. 8 (1997) 137-142.
13.S. Faghihi, A.P. Zhilyaev, J.A. Szpunar, F. Azari, H. Vali, M. Tabrizian, Adv. Mater. 19 (2007) 1069–1073.
14.R.Z. Valiev R.K. Islamgaliev, I.V. Alexandrov, Prog. Mater. Sci. 45 (2000) 103-189. 15.M. Naka, K. Hashimoto, T. Masumoto, J. Non-Cryst. Solids 30 (1978) 29-36.
16.T.Honma, T.Isano, T.Satow, Gakkaishi (in Japanese) 38 (1972) 242-146.
17.A.B. Amotz, M. Avron, Algal and Cynnobacteria Biotechnology, in: R.C. Cresswell, T.A.V. Reos, N. Shah, (Eds.) Longman Scientific and Technological Press, UK, 1982, p. 90.
18.I.L. Finar, Organic Chemistry, Vol. 2, 5th ed., Longmans, London, 1975.
19.China National Salt Corporation, SRI Co., Co-operation Report Study with EMISAL, 2003, pp.1-30.
20.F. El-Taib Heakal, A.A. Ghoneim, A.S. Mogoda, Kh.A. Awad, Corros. Sci. 53 (2011) 2728-2737. 21.N.T.C. Oliveira, A.C. Guastaldi, Corros. Sci. 50 (2008) 938-945.
22.F. El-Taib Heakal, Kh.A. Awad, Int. J. Electrochem. Sci. 6 (2011) 6483-6502. 23.D.D. Macdonald, Pure Appl. Chem. 71 (1999) 951-978.
24.S. Luiz de Assis, S. Wolynec, I. Costa, Electrochim. Acta 51 (2006) 1815-1819.
26.F. El-Taib Heakal, A.M. fekry, M.Z. Fatayerji, J. Appl. Electrochem. 39 (2009) 583-591. 27.W.F. McCoy, J.D. Bryers, J. Robbins, J.W. Costerton, Can. J. Microbiol. 27 (1981) 910-917. 28.A.A. Dardir, A.M. El-Tawab, Egypt. J. Aquat. Res. 31 (2005) 341-351.
29.A.A. Ghoneim, F. El-Taib Heakal, A.S. Mogoda, Kh.A. Awad, Surf. Interface Anal. 42 (2010) 1695-1701.
30.T. Shibata, Y.C. Zhu, Corros. Sci. 37 (1995) 253-270.
31.F. El-Taib Heakal, A.S. Mogoda, A.A. Mazhar, M.S. El-Basiouny, Corros. Sci. 27 (1987) 453-462. 32.F. El-Taib Heakal, S. Haruyama, Corros. Sci. 20 (1980) 887-898.
33.J.R. Scully, Corrosion 56 (2000) 199-217.
34.L. Kinani, R. Najih, A. Chtaini, Leonardo J. Sciences 12 (2008) 243-250.
35.A.A. Ghoneim, A.S. Mogoda, Kh.A. Awad, F. El-Taib Heakal, Int. J. Electrochem. Sci. 7 (2012) 6539-6554.
36.E.M. Patrito, V.A. Macagno, J. Electroanal. Chem. 375 (1994) 203-211.
37.F. El-Taib Heakal, N.S. Tantawy, O.S. Shehata Mater. Chem. Phys. 130 (2011) 743-749. 38.F. El-Taib Heakal, N.S. Tantawy, O.S. Shehata, Corros. Sci. 64 (2012) 153-163.
39.F. EL-Taib Heakal, A.M. Fekry, M.Z. Fatayerji, Electrochim. Acta 54 (2009)1545-1557. 40.M.J. Esplandiu, E.M. Patrito, V.A. Macagno, Electrochim. Acta 40 (1995) 809-815. 41.J.W. Diggle, T.C. Downie, C.W. Goulding, Electrochim. Acta 15 (1970) 1079-1093.
42.D. Landolt, Corrosion and surface chemistry of metals, EPFL Press, A Swiss academic publisher distributed by CRC Press, Italy, 2006, p. 138.
43.F. El-Taib Heakal, A.S. Fouda, M.S. Radwan, Mater. Chem. Phys. 125 (2011) 26-36. 44.M.I. Temkin , Zh. Fiz. Khim. 15 (1941) 296-332.