Int. J. Electrochem. Sci., 11 (2016) 1997 - 2017
International Journal of
ELECTROCHEMICAL
SCIENCE
www.electrochemsci.org
Preparation and Characterization of Nanomaterial Consisting
of Silica Aerogel & Carbon Tested as an Electrode in
Non-Aqueous Media Containing Lithium Salt
Anna Lisowska-Oleksiak1,*, Beata Wicikowska1, Andrzej P. Nowak1,Zbigniew Olejniczak2, Czesław Kapusta3
1
Faculty of Chemistry, Department of Chemistry and Technology of Functional Materials, Gdańsk University of Technology, Narutowicza 11/12, 80-233 Gdańsk, Poland
2
The Henryk Niewodniczański Institute of Nuclear Physics, Polish Academy of Sciences, Radzikowskiego 152, 31-342 Kraków, Poland
3
AGH University of Science and Technology, Faculty of Physics and Applied Computer Science, Department of Solid State Physics, Al. Mickiewicza 30, 30-059 Kraków, Poland
*
E-mail: [email protected]
Received: 23 November 2015 / Accepted: 15 December 2015 / Published: 1 February 2016
Silica aerogel (SiO2ag) was combined with carbonaceous material in the pyrolysis process of
hydrocarbons. The obtained nanocomposite SiO2ag/C was amorphous, partially preserving the porous
structure of SiO2ag. The specific surface area changes from 445.6 m2/g for pure SiO2ag to 205.52 m2/g
SiO2ag/C. The 29Si MAS-NMR shows a three-dimensional matrix with silicon atoms connected to other
silicon atoms by four and three oxygen bridges. The Raman spectrum reveals the state of carbonaceous material, with typical D and G peaks, derived from hydrocarbon pyrolysis. SiO2ag/C was tested as an
electrode in contact with LiPF6 in the EC/DMC electrolyte. Electrochemical measurements showed the
presence of complex redox couple activities of SiO2ag/C. XPS was employed to identify products
obtained under polarization of SiO2ag/C. Silica reduction proceeds with Li2O, Li2Si2O3, Li2Si2O5,
Li4SiO4 and LixSi formation. The charge capacity after 30 cycles is equal to 550 mAh/g.
Keywords: silica aerogel, SiO2@C, anode material, lithium – ion batteries
1. INTRODUCTION
drastic volume variation (around 3 times) during insertion and extraction of lithium ions [1–3]. There are hundreds of articles devoted to studies on silicon as an anode for lithium batteries. The review article by H. Wu et. al. is a comprehensive picture giving the state of the art in this field up to 2010 [4]. Interest nowadays is mainly focused on nanosilicon materials. However, a specific approach is undertaken. As an alternative, silica (SiO2) has been considered to be the anode material of LIBs,
because of the advantage of storing a large quantity of lithium and low discharge potentials [4,5]. Among literature data devoted to electrochemistry of SiO2 one of the first of the most important is an
article describing electrochemistry of a 400 nm thick film of pure silica without any binder [6]. Polarization curves taken in aprotic electrolyte (1.0 M LiPF6 in EC/DMC 50/50 (v/v)) supported with
XPS analyses, performed before and after polarization, brought about an explanation of the mechanism of the electrode reactions. It has been found that two mechanisms may occur separately or simultaneously. The first mechanism involves formation of silicate Li2Si2O5 and Si(1) and Si alloying
(2), both considered to be reversible reactions in Ref. [7]:
5 SiO2 + 4 Li+ + 4e¯ ⇌ 2 Li2Si2O5 + Si (1)
5 Si + 22 Li+ + 22 e¯ ⇌ Li22Si5 (2)
The second mechanism is less profitable as two reactions (3,5) are not reversible [7]: 2 SiO2 + 4 Li+ + 4 e¯ → Li4SiO4 + Si (3)
5 Si + 22 Li++ 22 e¯ ⇌ Li22Si5 (4)
SiO2 + 4 Li+ + 4 e¯ → 2 Li2O + Si (5)
Above electrochemical reactions of SiO2 can be the source of a high theoretical capacity,
significantly higher than capacity of LiC6, as elemental silicon appears. However, pure silica is not
conducting, thus a composition of appropriate structure, including empty space for alloying materials expansion, is desired. There are many literature examples of successful use of silica as an anode for lithium batteries [8-17]. Among them laboriously created hollow porous nanocubes are proposed [7]. Majority of studies on electrochemical activity of silica prove that only nanostructured SiO2 is suitable
for electrode application. In the case of a bulk crystalline form, milling is found to be very important. High energy mechanical milling was performed for crystalline silica (quartz) to obtain a successful stage of the material active under lithiation [9]. Two types of silicate were reported to be formed as a result of the cathodic reaction: lithium disilicate Li2Si2O5 and lithium metasilicate Li4SiO4. It is worthy
reminding here that both lithium salts are known to behave as fast ionic crystalline electrolytes [10,11]. Formation of disilicate, having a tunnel structure, is preferable, allowing reversible performance of the process [6,7,12].
In the latest reports on SiO2 /C composite electrodes the main effort is made to obtain
a nanostructure material using various methodologies. Silica mesoporous nanospheres with carbon porous shells are an example of a synergistic effect observed between components. A charge capacity above 600 mAh/g was recorded [13]. Similar results were obtained for nitrogen doped ordered mesoporous carbon/silica nanocomposites fabricated via the so called multi-constituent co-assembly strategy [14]. Chelation of the silicon cation led to formation of another type of SiO2/C nanocomposite
successfully tested as an anode for Li batteries [15]. Carbon thin films with SiOx nanowires are an
In all recent studies mentioned above it is assumed that the electrochemical product of SiO2@C
reduction is based on lithium silicate formation accompanied by silicon lithiation as previously documented using ex situ XPS measurements [7] and SAEDTEM [17].
Here we use amorphous silica aerogel as a precursor of an anode material for LIBs. The used precursor is the most dispersed silica matter, easily available by simple synthesis at solvent critical conditions [18]. As received, the aerogel contains up to 95 % (vol.) of air. The very small particle size is achieved due to the synthesis route. The particle size is found to play a crucial role in electroactivity of SiO2 [12]. In this work we focus on electrochemical performance of the material derived from silica
aerogel combined with hard carbons formed during pyrolysis of hydrocarbons in the presence of silica aerogel.
2. EXPERIMENTAL
2.1. Material preparation
The anode material was derived from silica aerogel (density = 1,9 mg/cm3). Silica aerogel (SiO2ag) was prepared according to described methods in Ref. [18,19]. The specific surface area of
obtained aerogels was analysed at 77 K according to the single-point Brunauer, Emmet & Teller (BET) method using the nitrogen absorption method as 445.6 m2/g with an AREA Meter II (Ströhlein Instruments, Viersen, Germany).
The obtained material was impregnated with an aqueous solution of sucrose (POCH Gliwice) and sulphuric acid (POCH Gliwice). The concentration of sucrose was 1.5 M. After impregnation and decantation the material was treated with 0.6 M sulphuric acid. Then the gel was filtrated on a polypropylene (PP) drain, transferred into a ceramic corundum boat and pyrolysed using the programmable horizontal tube – furnace (Czylok, Poland) under a steady flow of argon atmosphere (30 cm3/min) at 350ºC for 25 minutes followed by heating to 700ºC for 2 hours.
During the next step the material was powdered with glucose (POCH Gliwice) on an agate mortar and pestle to obtain uniform consistence. The silica aerogel/glucose weight ratio was 1:4. The powder was pressed on a manual hydraulic press (Specac Ltd.) for about 30 seconds with a load of 3.18 MPa on a 12 mm diameter matrix (Specac Ltd.). These pellets were pyrolysed under argon atmosphere with the same parameters as described above. This material is named by abbreviation SiO2ag/C. EDX analysis gave the silicon to carbon atomic ratio of 1:8.
2.2. Materials characterization
The structure of the samples was measured by X-Ray diffraction (Xpert PRO - MPD Philips), Raman spectroscopy (Raman spectrometer in Via Renishaw, Renishaw, England), ATR FT-IR spectroscopy (Frontier spectrometer, Perkin-Elmer), solid state 29Si Magic-Angle-Spinning Nuclear Magnetic Resonance (solid state 29Si MAS-NMR) (Bruker HP WB) and X-ray Photoelectron Spectroscopy (XPS) (ESCALAB 250Xi, Thermo Fisher Science).
2.3. Measurement conditions
Raman spectra were recorded on a Raman spectrometer in Via Renishaw (Renishaw, England) with an Ar ion laser at a wavelength of 514 nm. Spectra were acquired over the range of 100 – 3200 cm-1 with a 2 cm-1 resolution. Depending on the signal intensity up to 10 spectra were accumulated to improve the signal/noise ratio and the total acquisition time did not exceed 5 min. The spectral analysis was performed with GRAMS/32 (Galactic) software. The spectra were analysed by the Lorentzian fitting procedure with 5 peaks. The goodness of fit χ2
value was 1.33 and indicates that Lorentzian-shaped bands for 5 peaks are an acceptable value.
Solid state 29Si Magic-Angle-Spinning Nuclear Magnetic Resonance (MAS-NMR) spectra were measured on the APOLLO console (Tecmag) at the magnetic field of 7.05 T produced by the 300 MHz / 89 mm superconducting magnet (Magnex). A Bruker HP-WB high-speed MAS probe equipped with a 4 mm zirconia rotor and KEL-F cap was used to spin the sample at 6 kHz. A single 3 s rf pulse, corresponding to the /2 flipping angle was used. The acquisition delay in accumulation was 60 s, and 512 scans were averaged. The frequency scale in ppm was referenced to the 29Si resonance of tetra-methylsilane (TMS).
XPS measurements were carried out at base pressure of ~1∙10−9 mbar. Al Kα monochromatized radiation (hν = 1486.6 eV) was employed as the X-ray source. Charge neutralization was implemented. Spectra were recorded with an energy step size of 0.1 eV at a pass energy of 15 eV for highly resolved C 1s, O 1s and Si 2p peaks. The binding energies were corrected by setting the C 1s hydrocarbon (–CH2–CH2–bonds) peak at 285.0 eV for graphite electrodes. Ar+ etching was performed for 2000 s for
depth profile analysis. The data processing (peak fitting) was calculated with Avantage software provided by Thermo Fisher Scientific, using Smart type background subtraction and Gaussian/Lorentzian peak shapes.
2.4. Electrochemical measurements
The electrochemical behaviour of the samples was examined using two- and three – electrode Swagelok® type cells vs. Li (lithium foil 99.99% purity, 0.75 mm thickness, AlfaAesar) with 1 M LiPF6 dissolved in an ethylene carbonate (EC) and dimethyl carbonate (DMC) mixed solvent (LP30
Merck, Germany) as the electrolyte. The working electrode was prepared from SiO2ag/C material with
polyvinylidene fluoride (PVDF, Solvay S.A., 5 % wt.) as binder dissolved in N-Methyl-2-pyrrolidone (NMP, Sigma - Aldrich) using an ultrasonic bath for 3 hours. The SiO2ag/C material was in the form of
Obtained disc-shaped electrodes were dried under dynamic vacuum in an oven (Glass Oven B 585 Büchi, Germany) for 24 h at 80 ºC. The cells, equipped with a SiO2ag/C working electrode, lithium disc
as the counter electrode with lithium wire as reference electrode, were assembled in an argon-filled Lab Star glove-box workstation (MBraun). For battery tests electrochemical measurements were performed in two electrode Swagelok® type cells with active material as the working electrode and lithium foil (99.9% purity, 0.75mm thickness, AlfaAesar, Germany) as the counter/reference electrode.
The oxygen and water level in the glove box were maintained below 0.5 ppm.
Cyclic voltammetry was performed using an electrochemical potentiostat/galvanostat Autolab (PGStat302N, The Netherlands) between 0.01 (±0.004) – 2.7 (±0.004) V versus Li/Li+ at a scan rate of 100 V·s-1. All measurements were performed at 21 (±1) oC.
After the charging (E=0.01 V, Q=3295 C/g) procedure the cell was disassembled in the argon-filled glove box and the working electrodes were taken out from the cell, washed with propylene carbonate (PC, Sigma-Aldrich), then dried at 60 oC under dynamic vacuum for 24 h for XPS characterization. Dried and encapsulated samples were transferred to the XPS chamber with great care using a glove bag (Sigma - Aldrich) purged with Ar 5.0.
The discharged material taken for XPS measurements came from multicyclic polarization described in section 3.3.
The equilibrated rest potential for the charged material was Erest=0.2 V. The rest potential after
discharging was Erest=3.2 V.
Galvanostatic cyclic polarization tests were performed with a multichannel battery interface ATLAS – SOLLICH 0961 MBI (Poland). The cells were cycled between 0.01 and 3.0 V versus Li+/Li at a current density of 18 mA/g.
3. RESULTS AND DISCUSSION
3.1. Morphology
Scanning electron microscopy was applied to study morphology of the materials.
Images of pure silica aerogel and SiO2ag/C are presented in Fig. 1 a, b and Fig. 1 c, d,
respectively.
The silica aerogels with typical interconnected porous network have a well-developed three-dimensional structure as described in Ref. [20], see Fig. 1. a, b. It can be observed that the structure of the aerogel is highly cross-linked. Silica aerogels contain closely bound and almost monodispersed spherical particles with polydispersed porosity.
In Fig 1. c, d the obtained SiO2ag/C material is shown. The material is more compact in
comparison with pure silica aerogel. Silica is sheltered by uniformly spread hard carbon coming from pyrolysed glucose. The absence of an open pore silica network is caused by a high temperature process. However, one may see that the porous cross-linked network of the aerogel is partially preserved, see Fig. 1 d. The specific surface area changes from 445.6 m2/g for SiO2ag to 205.52 m2/g
Figure 1. SEM images of a)-b) pure silica aerogel, c)-d) pyrolysed SiO2ag/C material
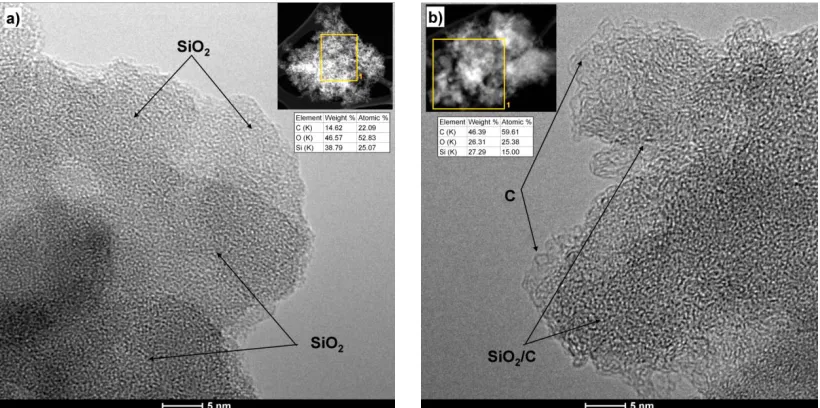
Figure 2. HRTEM images of a) silica aerogel and (b) carbon coated silica aerogel.
The HRTEM images of the SiO2ag and the SiO2ag/C materials illustrating the shape and particle
size are shown in Fig. 2. The dark and white areas on HRTEM photos are attributed to the bulk material and pores in both materials. The micrograph of pure SiO2ag is typical for an amorphous
material of meshwork structure. The morphology of the SiO2ag/C material is similar to pure aerogel.
[image:6.596.93.503.408.612.2]
disordered carbons [21]. This is expected as the pyrolysis temperature (700°C) was not sufficient to form a graphitic structure [22]. The amorphous phase of carbon is visible at the edges of the material (Fig. 2b) in the form of layers of non-defined structure.
In the inset in Fig 2 the EDX analysis is shown. The results clearly indicate that SiO2ag/C is
covered with carbon (~ 59 % at.) originating from pyrolysed glucose while SiO2ag is pure silica. The
carbon amount in Fig. 2a is due to the presence of impurities adsorbed at the silica surface. These results are in agreement with data obtained by SEM analysis.
3.2. Structural Characterization
Structural characterization of SiO2ag/C was performed using: X-Ray analysis, ATR-FTiR
spectroscopy, Raman spectroscopy, Si-MAS NMR and XPS spectroscopy.
3.2.1. X-Ray Diffraction
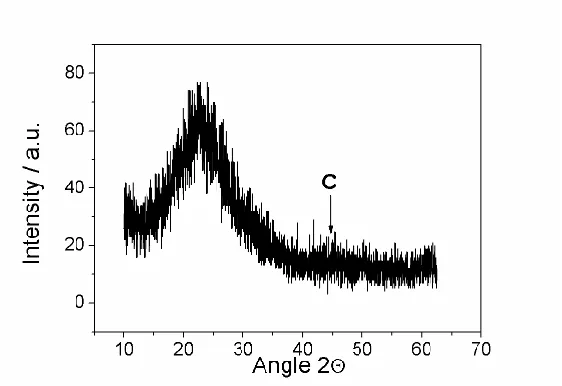
[image:7.596.160.441.369.562.2]The XRD pattern of the SiO2ag/C material is shown in Fig. 3.
Figure 3. XRD pattern of pyrolysed SiO2ag/C material.
The X ray diffraction pattern proves the amorphous character of the composites with only one broad peak measured at the low angle (2 theta). Wide peaks at about 22° and 44° are attributed to SiO2
nanoparticles and the amorphous carbon structure, respectively. Similar results are reported in Ref. [8]. There is no peak of elemental crystalline silicon. This confirms that SiO2 was not reduced to Si as one
may expect and it is in agreement with earlier reported literature data that SiO2 cannot be reduced
3.2.2. Attenuated Total Reflectance Fourier Transform Infra Red Spectroscopy (ATR-FTIR)
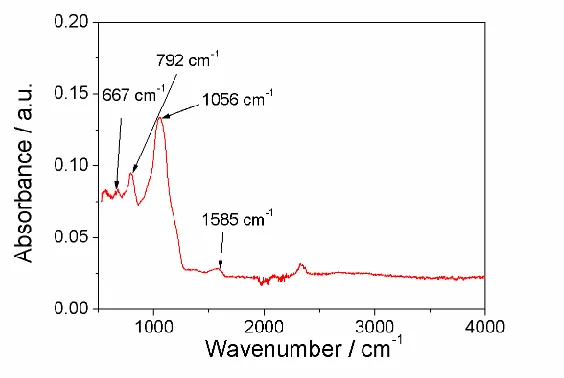
[image:8.596.158.440.135.324.2]The ATR-FTIR spectrum of the SiO2ag/C material is shown in Fig. 4.
Figure 4. The ATR-FTIR spectrum of pyrolysed SiO2ag/C material
The peaks at 1056, 792 cm-1 are assigned to the asymmetry Si–O–Si bond stretching vibration [7]. These two characteristic peaks confirm the presence of SiO2. The maxima in the wavenumber
region below 1000 cm-1, known as the fingerprint region, come from stretching and deformation vibrations which may confirm Si-C bond formation in the sample (667 cm-1) [24]. The intensity of silicon carbide signals is rather low and no proof for the SiC crystalline form is found on the XRD pattern. The maximum seen at ~ 1585 cm-1 may be ascribed to vinyl groups bonded to silicon [25].
3.2.3. Raman Spectroscopy
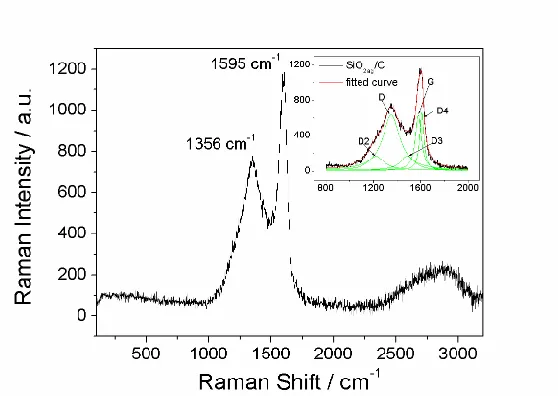
Micro-Raman-spectroscopy was applied to determine the structure of carbon from SiO2ag/C in
the samples. The shape of the presented Raman spectrum, (Fig. 5) is typical for disordered carbonaceous material where two quite sharp modes, the D peak around 1356 cm-1 and the G peak around 1595cm-1 are recorded [26]. Similar values for D and G bands around 1360 cm-1 and 1590 cm-1 were reported by Maier et.al. for the nanocomposite formed as a core shell structure Si@SiOx/C,
[image:9.596.159.438.131.329.2]
The maxima of D2, D, D3, G and D4 bands have been recorded at 1222, 1351, 1488, 1579 and 1608 cm-1.
Figure 5. Raman spectrum of pyrolysed SiO2ag/C material, inset: The curve fit for first order Raman
spectra of SiO2ag/C.
The intensities of the two lines (D and G) depend on the type of graphitic material. It is known that the ratio of intensities I(D) to I(G) varied inversely with La for carbonaceous materials according to
the equation given in Ref. [26]:
a L C G I
D
I ( ) )
( )
(
(6)
where C depends on the Raman laser excitation energy (for λ = 514.5 nm, C = 44 Å) and I(D)/I(G) is the peak height ratio.
The intensity of I(D)/I(G) proposed by Tuinstra and Koenig [26] was used to evaluate the carbon cluster size. Authors studied the relationship between the ratio measured from the Raman spectrum and the graphitic in-plane microcrystallite size, La.
The I(D)/I(G) peak height ratio for SiO2ag/C material equals 1.00, so the La parameter is
estimated at 44 Ǻ. Tuinstra and König have observed that when the value of the I(D)/I(G) ratio is ~1.0, it may be ascribed to uniformly monocrystalline forms of graphite [26]. For a system with a mixed grain sizes one should calculate an effective La parameter as is shown in Ref. [28].
3.2.4. 29Si MAS-NMR
The 29Si MAS-NMR spectra of the pristine SiO2ag and the sample after pyrolysis with the
carbon precursors (SiO2ag/C) are shown in the top and bottom of Fig. 6, respectively (black dots). The
SiO2 and SiO2/C spectra, respectively. The slight increase of the linewidths can be due to the pyrolysis
[image:10.596.158.440.118.473.2]process.
Figure 6.29Si NMR spectra of pristine SiO2ag and SiO2ag/C materials.
The line at -110 ppm is typical for bulk silica, corresponding to tetrahedrally coordinated silicon atoms, which are connected to other silicon atoms by four oxygen bridges (Q4 units), forming a three-dimensional matrix. The line at -101 ppm can be assigned to Q3 units, with three oxygen bridges, which may correspond to silicon atoms located close to the surface of silica particles [32].
Spectra show that the pyrolysis process did not affect the structure of the silica aerogel matrix, apart from introducing a slightly bigger disorder, as evidenced by increased linewidths. On the other hand, any lines that would correspond to Si-C or Si-O-C bonds and would appear at higher field, in the 5-65 ppm range [33,34], are not observed. Similarly, no reduced form of silicon as Si-C-O glass-like compounds was reported for nano-silica in hard carbon studied by Guo et al. [17].
3.2.5. X-ray Photoelectron Spectroscopy (XPS)
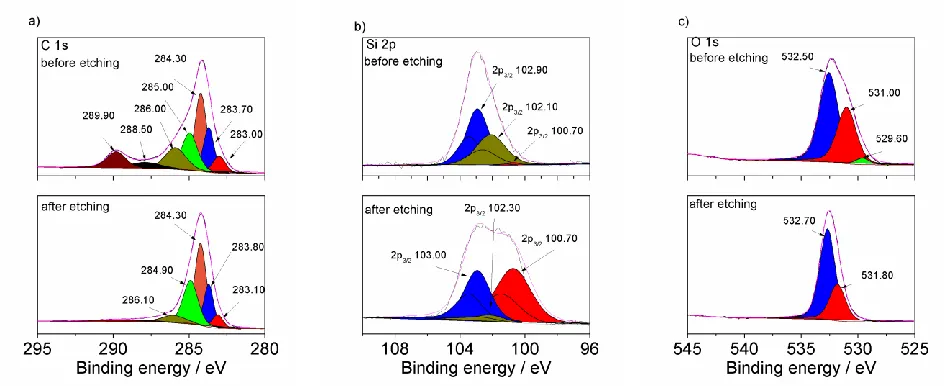
Fig. 7 shows spectra for pristine material, Fig. 8 for charged material (Erest = 0.2 V) and Fig. 9 for discharged material (Erest = 3.2 V).
[image:11.596.63.537.162.353.2]3.2.5.1. Pristine Material
Figure 7. XPS spectra of pristine SiO2ag/C electrode material of a) C 1s, b) Si 2p and c) O 1s core level
before and after Ar+ etching
The XPS spectra of a) C 1s, b) Si 2p and c) O 1s core level of pristine material before and after the Ar+ etching procedure are shown in Fig. 7.
The C 1s core level identifies the presence of a few types of carbon compounds, see Fig. 6a. The fitting procedure gives peaks at 283.10 eV (C-Si bond) [24,35], 283.70 (C-Si bond) [36], 284.20 eV (graphite or C=C bond) [37], 284.90 (C-H bond) [38–41], 285.90 eV (C-O bond) [42], 288.20 eV (C-H or C-O bonds) [37,40] and 289.90 eV (C-F or -CO3 bonds) [39–41]. The first two peaks
correspond to silicon carbide or silicon oxycarbide which are formed during the pyrolysis procedure. The intensity of the carbon peak corresponding to carboxyl and carbonate groups diminishes after Ar+ etching (Fig 7 a.).
Deconvolution of the Si 2p spectrum into three components is shown in Fig. 7 b.
The first doublet (2p3/2 and 2p1/2), located at 100.70 and 101.30 eV might correspond to the
Si-C bond [43]. However, the 29Si NMR spectrum, see Fig. 6, did not confirm presence of Si-C or Si-O-C bonds which would appear in the -5 - 65 ppm range [33,34]. Similarly, Guo et al. did not observe these bonds in nano-SiO2 in the hard carbon anode material [17]. Thus, the BE 100.70 eV is very likely
to originate from disordered SiOx-δ with Si atoms at lower valence.
The second pair, located at 102.10 and 102.60 eV, is attributed to Si-O coming from SiOx or
SiOC [42,44]. The component seen at the highest binding energy (102.90 and 103.50 eV) is known to be associated with SiO2 and/or silicon oxycarbide formation [35]. No shifts in binding energy were
In the spectra of O 1s shown in Fig. 7 c one peak at 531.34 eV was assigned to the C -O bond [45]. The second peak is located at 532.50 eV and originates from bonding Si-O in SiO2 [42]. The
position of this peak is slightly (0.1 eV) shifted towards higher binding energy (532.60 eV) in a sample after Ar+ sputtering. The intensity of this peak increased significantly after the etching procedure. The peak seen at 531.30 eV vanishes after Ar+ sputtering, while a peak at 531.80 eV appears. The binding energy at 531.80 eV can be prescribed to the Si-O bond from SiOx species [46].
3.2.5.2. Charged Material
Figure 8. XPS spectra of charged SiO2ag/C electrode material of a) C 1s, b) Si 2p and c) O 1s core
level before and after Ar+ etching
The XPS spectra of C 1s core level for the charged material (see Fig. 8 a) exhibit the peak position at similar binding energy (± 0.3 eV) as it is observed for charged material (polarized at 0.2V shown in Fig. 7 a.)
In the Si 2p core level two forms can be identified. The first is located at 102.90 eV (2p3/2) and
the second is at 103.70 eV (2p3/2), see Fig. 8 b. The latter is ascribed to the Si-O bond in Li2SiO3 [47]
while the former is attributed to Li2Si2O5 [6]. The Si 2p spectrum, deconvoluted from Fig 8 b, gives
four multiplets corresponding to split 2p3/2 and 2p1/2 core holes. These peaks (2 p3/2) are located
at 98.50 eV, 100.40 eV, 102.80 eV and 103.70 eV. The first (98.5 eV) is very likely to be attributed to the Li-Si bond in LixSi alloy. Recently Edström et al. showed that the peak localized below 98 eV can
be ascribed to the LixSi alloy, whereas the BE value at 100.40 eV may be attributed to the Si-O bond
coming from silicate Li4SiO4 [41]. The last two peaks seen at 102.80 and 103.70 eV are very likely
to be attributed to the Si-O bond present in Li2SiO3 [47] and Li2Si2O5 [6].
In Fig. 8 c. the O 1s signal is fitted with four peaks at 529.60, 531.20, 532.50 and 534.80 eV. These peaks are attributed to the Li-O bond, C-O bond, Si-O bond and CF-O bond, respectively. The peak present at 529.60 eV can be assigned to Li2O formed during the electroreduction process [48].
[image:12.596.62.536.230.421.2]
[42,44]. The maximum seen at 532.50 eV confirms the presence of SiO2 [42,46] or/and
Li2Si2O3/Li2Si2O5 [42]. The Si-O binding energy originating from silicates Li2Si2O3/Li2Si2O5 overlaps
and is difficult to be distinguished as is claimed by Osaka et. al.[42]. The peak recorded at the highest binding energy can be ascribed to a compound like organic-fluorinated and/or organofluoro-phosphorous coming from degradation of the LiPF6 electrolyte [39,48]. Disappearance of the peak
at 534.80 eV after Ar+ etching proves that the outer layer of the solid electrolyte interphase (SEI) was removed, see Fig. 8 c.
[image:13.596.64.538.246.439.2]3.2.5.3. Discharged Material
Figure 9. XPS spectra of discharged SiO2ag/C electrode material of a) C 1s, b) Si 2p and c) O 1s core
level before and after Ar+ etching
The XPS spectra of C 1s core level for discharged material, see Fig. 9 a., maintain location at a similar binding energy (± 0.3 eV) as is observed for the charged material (Fig. 8 a).
In the spectra of Si 2p shown in Fig. 9 b. two doublets are detected, the first localized at 102.10 eV (2p3/2) and the second seen at 102.90 eV (2p3/2). Both of them are ascribed to Si-O bonds in
different compounds consisting Si and O atoms. The former originates from SiOx [42,49] or Li4SiO4
orthosilicate [17]. The peak at 102.10 eV vanishes due to sputtering, while the peak at 100.70 eV appears. The maximum localized at lower BE (100.70 eV) is ascribed to more disordered SiOx-δ as is
observed for the pristine material, see Fig. 7 b.
Deconvolution of O 1s spectra is shown in Fig. 8 c. The maxima are recorded at 529.80, 531.00 and 532.50 eV for discharged material before Ar+ etching and at binding energies of 531.80 and 532.70 eV after Ar+ ion sputtering. The signals at 529.80 and 531.0 eV are very likely attributed to Li2O and Li2Si2O3 compounds [42,48]. The maximum at 532.5 eV may be assigned to SiO2 [42,46].
Table 1. Chemical compounds identified in the studied material. Pristine
material
Charged material (Erest=0.2 V)
Discharged material (Erest=3.2 V)
SiO2,
SiOx,
SiOx-,
C
SiO2,
C,
Li2Si2O3, Li2Si2O5,
Li4SiO4,
LixSi,
Li2O,
Li2CO3,
SiO2,
SiOx (negligible signal),
SiOx-,
C
3.3. Electrochemical Characterization
The electrochemical cell Li|1M LiPF6, EC,DMC|SiO2ag/C was prepared using T-shape
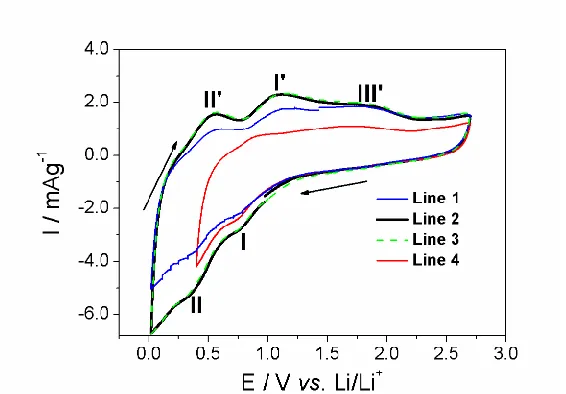
Swagelok® without separator. In Fig. 10. CV curves obtained at a sweep rate of 100 μV/s for material SiO2ag/C are shown.
Figure 10. Cyclic voltammogram of SiO2ag/C electrode material, sweep rate v = 100 μV/s, potential
range: 0.02 – 2.7 V.
[image:14.596.159.442.345.542.2]
cathodic maximum marked 0.37 V. The next redox couple activity is seen as a cathodic current growth marked 0.8 V with an anodic hump at 1.11 V followed by a broad plateau (marked 1.86 V).
In order to enhance electrochemical restructuring of the SiO2ag/C film another cathodic
potentiostatic polarization was performed. The next step in the experiment involved two subsequent CV cycles (line 2 and 3). As can be seen, they overlap each other, proving reproducibility of the process. Thus, the performed charging /discharging procedure caused phase changes in the bulk of material. This is in contradiction to other reports, showing a non-reproducible, singular polarization curve. It is impossible to analyse the redox potential as no define phases were formed as literally indicated in Ref. [50]. Analysing XPS results one may conclude that silica undergoing reduction observed as a current growth (0.80 V) brings about products active in the second stage of the cathodic process (0.37 V). The reaction fulfilling these requirements is production of silicate and silicon. Such a reaction may proceed according to equations 1 and/or 3, see Introduction. Moreover, another process in which silica and also SiOx participate may be considered as:
SiO2 + SiOx + z Li+ + z e¯ = Li(z-2)SiO(x+1) + Li2O + Si (7)
A similar reaction was proposed by Doh et. al. [50]. Lithium oxide was detected in the charged sample. Also elemental silicon was not identified by XPS, the presence of lithium silicate is confirmed, see Table 1.
Thus, considering equations 1, 3 and 6 the reduction products are: Li2O, LixSiOy (Li4SiO4,
Li2Si2O5) and Si. Silicon obtained is very likely to uptake lithium during alloying marked at 0.37 V to
form LixSi, see Fig. 10.
On the anodic branch of the CV curve the maximum at 0.55 V results from dealloying of LixSi,
as was already reported for Si derivative composites [50]. The peak at 1.11 V may be ascribed to a reversible reaction in which silica is produced from silicates and Li+ ions are released, see eq. 1, 3 and 7. SiOx species are not identified by XPS for discharged samples, though. However, it should be noted
that reaction 3 is described as an irreversible one [7], whereas in the studied case the CV is reproducible as was found by other authors [17]. Thus, the simplified schematic and summarizing representation of the process may be given as:
SiO (x 2)Li (x 2)e
2 1 y Si 2 1 y O Li SiO
Lix y 2 2 (8)
The hump at 1.1 V opens a long plateau reaching minimum current values at potential 2.1 V. A similar plateau was observed by Sun et al. (see, eq. 1), who ascribed it to the electrochemical activity of Li2Si2O5 in a reaction leading to formation of SiO2 [6]. Thus, a part of LixSiOy from eq. 8
may be attributed to disilicate Li2Si2O5.
The current growth observed at a more negative potential than 0.2 V originates from both silicon and carbon lithiation [51]. CV polarization allows to conclude that silicon is dispersed inside the material in the desired manner very likely allowing secure volume expansion.
The galvanostatic charge and discharge of SiO2ag/C at a different ratio of Si:C (1:3 and 1:8)
were evaluated at a current density of 18 mA/g between 0.01 and 3.0 V vs. Li+/Li. The specific capacity was calculated based on active SiO2 in the electrode material. Hard carbon participation in
[image:16.596.158.440.123.319.2]
Authors proved that hard carbons obtained from hydrocarbons during pyrolysis under argon demonstrated a dramatic reduction of irreversible capacity [52].
Figure 11. Capacity vs. cycle number of different Si:C materials at C/20
As shown in Fig. 11, the first cycle discharge and charge capacities of the SiO2ag/C [1:8 at. %]
electrode reached values of 1172 and 2562 mAh/g, respectively. The discharge capacity is much higher than the theoretical capacity of pure silica which is 1965 mAh/g [7], although a big capacity loss of 70% occurred in the first cycle because of SEI film formation. After 30 charge–discharge cycles, the discharge capacity still remained at up to 550 mAh/g. However, the obtained values are lower than the theoretical specific capacity of silica.
[image:16.596.160.437.495.701.2]
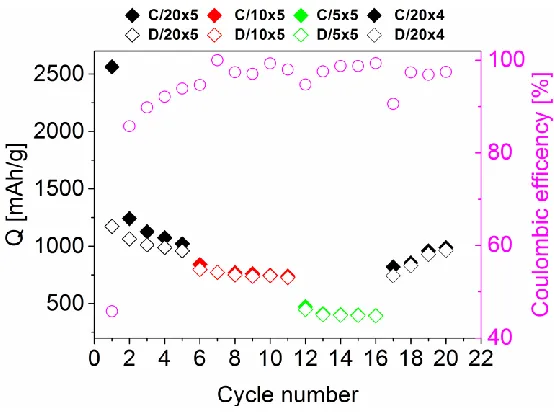
In Fig. 12 the capacity for SiO2ag/C 1:8 material at different charging/discharging rates (C20,
[image:17.596.87.509.186.551.2]C10. C5) was shown. As can be seen, the charge capacity drops for fast charging, while the whole material reaches good capacity again after a cycle under lower current density.. The reason of such behaviour is related to slow kinetics and diffusion of studied processes.
Table 2. Specific capacity data compared with the literature.
Material Number
of cycles
Capacity [mAh/g] (scan rate or current density)
Ref.
SiO2ag/C 30 550 (18.6 mA/g)
C/SiOx NWs 30 360 (0.1 C) [16]
SiO2-carbon composite 100 662- 602 (C/10) [15]
DMSNs/C 200 635 (100 mA/g) [13]
N-OMC/ SiO2 100 876 (200 mA/g) [14]
SiO2@C@graphene
composite
200 250 (50 mA/g) [53]
RAD 80 500 (18.6 mA/g) [54]
SiO2@C 103 500 (0.2 mA/cm2) [55]
SiOx/C composite 350 780 (100 mA/g) [56]
SiOxCy 1000 1020 (1C) [57]
Hollow porous SiO2
nanocubes
30 919 (100 mA/g) [7]
Amorphous Si/ SiOx/ SiO2
nanocomposites
350 600 (200 mA/g) [58]
Quartz ( SiO2) 100 800 (100 mA/g) [12]
SiO1.3 200 1058-930 (1924 mA/g) [9]
C-SiO2 50 536 (50 mA/g) [8]
Si-O-C 50 600 (?) [59]
SiO2 thin film 100 510 (0.028 mA/cm2) [6]
Si@ SiOx/C 60 1100 (150 mA/g) [27]
Nano- SiO2 15 1675 (0.1 mA/g) [17]
Table 2 presents a list of battery parameters of different SiOx anode concepts, reported in Ref.
In current studies SiO2ag/C is polarized up to LixSiy alloy formation and the system was found
to be mechanically stable as the growth of capacity is observed (see Fig.12). The charge density of the used SiO2ag/C anode is comparable to other anodes reported in literature (see Table 2).
[image:18.596.157.441.183.382.2]The impedance spectra of pristine (E = 3.0 V) and charged (E = 0.2 V) materials are shown in Fig. 13.
Figure 13. Nyquist plots of SiO2ag/C electrode (Ø = 6 mm, thickness 50 μm) at E = 3.0 V (o) and E =
0.2 V (o).
Both spectra consist depressed semicircles followed by a sloping line at lower frequencies. The slope of the line for an electrode material at E = 3.0 V, rising at an angle of 80° to the Z′ axis typical for capacitive impedance with CPE character. For the charged electrode, E = 0.2 V, the straight line in the low frequency region is inclined at an angle of 60° to the real axis. It suggests that diffusion in the bulk is a process consisting of finite-length Warburg diffusion with reflective boundary conditions. Taking into account inhomogeneity of the film the Warburg impedance should be identified by the generalized finite-length Warburg element (GFW) [61,62].
4. CONCLUSIONS
Amorphous silica aerogel was successfully combined with carbonaceous conductors during pyrolysis of hydrocarbons. In this work we exhibit electrochemical behaviour of SiO2ag/C 1:8 material.
Our results demonstrate that tested nanocomposite material is electroactive at high negative potential range, however its utilization in energy storage devices would be limited to low charge/discharge rates.
evidenced SiO2, while Raman spectroscopy indicated maxima originating from disordered
and graphitized carbon. 29Si MAS-NMR spectra of SiO2ag/C excluded Si-C bond formation during
material preparation. This is in agreement with SEM and HRTEM results which evidenced that silica was sheltered by uniformly spread hard carbon. Pyrolytic coverage of SiO2ag nano-net
by the carbonaceous film is found to be vital to attain SiO2ag electroactivity.
XPS measurements confirmed the reversible electrochemical reduction of silica aerogel to lithium silicates and lithium silicide. Two couples of reduction and oxidation peaks at 0.8 V/ 1.11 V and 0.37 V/ 0.55 V were found on CV polarization curves. The former was attributed to silica reduction with lithium silicates formation, the latter was ascribed to alloying with lithium silicide as final product. At a more negative potential, below 0.2 V, lithium insertion into carbon occurs and overlaps with silicon lithiation. Subsequent cyclic voltammetry curves overlapped confirming reproducibility of the process. The discharge capacity of the material, after 30 charge-discharge cycles, equals to 550 mAh/g. Electrochemical impedance spectroscopy measurements, with the presence of the generalized finite-length Warburg element, evidence nonuniform diffusion in a finite-length region, typical for non-homogenous materials.
Finally, using non-flammable silica as the anodic material improves safety conditions of the device. The current density of our material is higher than commercially used graphite.
ACKNOWLEDGEMENTS
Authors gratefully acknowledge the financial support from the National Science Centre, Kraków, Poland (NN 1503/B/H03/2011/40). We are thankful to Ms. Szaniawska for silica aerogel synthesis.
References
1. B.A. Boukamp, G.A. Lesh, R.A. Huggins, J. Electrochem. Soc., 128 (1981) 725.
2. K. Miyachi, H. Yamamoto, H. Kawai, T. Ohta, M. Shirakata, J. Electrochem. Soc., 152 (2005) 2089.
3. U. Kasavajjula, C. Wang, A.J. Appleby, J. Power Sources, 163 (2007) 1003. 4. H. Wu, Y. Cui, Nano Today, 7 (2012) 414.
5. H. Wu, G. Chan, J.W. Choi, I. Ryu, Y. Yao, M.T. McDowell, S.W. Lee, A. Jackson, Y. Yang, L. Hu, Y. Cui, Nat. Nanotechnol., 7 (2012) 310.
6. Q. Sun, B. Zhang, Z.-W. Fu, Appl. Surf. Sci., 254 (2008) 3774.
7. N. Yan, F. Wang, H. Zhong, Y. Li, Y. Wang, L. Hu, Q. Chen, Sci. Rep., 3 (2013) 1568. 8. Y. Yao, J. Zhang, L. Xue, T. Huang, A. Yu, J. Power Sources, 196 (2011) 10240. 9. J.-W. Song, C.C. Nguyen, S.-W. Song, RSC Adv., 2 (2012) 2003.
10.I. Abrahams, P.G. Bruce, A.R. West, W.I.F. David, J. Solid State Chem., 75 (1988) 390. 11.A.R. West, J. Appl. Electrochem., 3 (1973) 327.
12.W.-S. Chang, C.-M. Park, J.-H. Kim, Y.-U. Kim, G. Jeong, H.-J. Sohn, Energy Environ. Sci., 5 (2012) 6895.
13.H.-H. Li, X.-L. Wu, H.-Z. Sun, K. Wang, C.-Y. Fan, L.-L. Zhang, F.-M. Yang, J.-P. Zhang, J. Phys. Chem. C, 119 (2015) 3495.
14.Y. Liang, L. Cai, L. Chen, X. Lin, R. Fu, M. Zhang, D. Wu, Nanoscale, 7 (2015) 3971. 15.J. Kim, D. Thien, J. Kang, S. Song, J. Alloy Compd., 633 (2015) 92.
17.[B. Guo, J. Shu, Z. Wang, H. Yang, L. Shi, Y. Liu, L. Chen, Electrochem. Commun., 10 (2008) 1876.
18.M. Stolarski, J. Walendziewski, M. Steininger, Appl. Catal. A Gen., 177 (1999) 139. 19.K. Szaniawska, M. Gładkowski, L. Wicikowski, L. Murawski, J. Non. Cryst. Solids, 354
(2008) 4481.
20.G.S. Kim, S.H. Hyun, Thin Solid Films, 460 (2004) 190.
21.J.-N. Rouzaud, C. Clinard, Fuel Process. Technol., 77-78 (2002) 229. 22.R.E. Franklin, P. Roy. Soc. A-Math. Phy., 209 (1951) 196.
23.S.G. Hutchison, L.S. Richardson, C.M. Wai, Metall. Trans. B, 19 (1988) 249. 24.M.P. Delplancke, J. Vac. Sci. Technol. A, 9 (1991) 450.
25.J. Lücke, J. Hacker, D. Suttor, G. Ziegler, Appl. Organomet. Chem., 11 (1997) 181. 26.F. Tuinstra, J.I. Koenig, J. Chem. Phys. 53 (1970) 1126.
27.Y.-S. Hu, R. Demir-Cakan, M.-M. Titirici, J.-O. Müller, R. Schlögl, M. Antonietti, J. Maier, Angew. Chemie Int. Ed., 47 (2008) 1645.
28.A.C. Ferrari, J. Robertson, Phys. Rev. B, 61 (2000) 14095.
29.A. Sadezky, H. Muckenhuber, H. Grothe, R. Niessner, U. Pöschl, Carbon N. Y., 43 (2005) 1731. 30.Y. Wang, D.C. Alsmeyer, R.L. Mccreery, Chem. Mater., (1990) 557.
31.B. Dippel, H. Jander, J. Heintzenberg, Phys. Chem. Chem. Phys., 1 (1999) 4707.
32.L. Martín, J.O. Ossó, S. Ricart, A. Roig, O. García, R. Sastre, J. Mater. Chem., 18 (2008) 207. 33.A. Nyczyk-Malinowska, M. Wójcik-Bania, T. Gumuła, M. Hasik, M. Cypryk, Z. Olejniczak,
J. Eur. Ceram. Soc., 34 (2014) 889.
34.H. El Rassy, A.C. Pierre, J. Non. Cryst. Solids, 351 (2005) 1603.
35.A. Avila, I. Montero, L. Gal n, J.M. Ripalda, R. Levy, J. Appl. Phys., 89 (2001) 212. 36.[L. Muehlhoff, W.J. Choyke, M.J. Bozack, J.T. Yates, J. Appl. Phys., 60 (1986) 2842.
37.J. Kikuma, K. Yoneyama, M. Nomura, T. Konishi, T. Hashimoto, R. Mitsumoto, Y. Ohuchi, K. Seki, J. Electron Spectros. Relat. Phenomena, 88-91 (1998) 919.
38.R.I.R. Blyth, H. Buqa, F.P. Netzer, M.G. Ramsey, J.O. Besenhard, Appl. Surf. Sci., 167 (2000) 99.
39.J. Światowska, V. Lair, C. Pereira-Nabais, G. Cote, P. Marcus, A. Chagnes, Appl. Surf. Sci., 257 (2011) 9110.
40.C. Chan, R. Ruffo, S. Hong, Y. Cui, J. Power Sources, 189 (2009) 1132.
41.B. Philippe, J. Allouche, F. Lindgren, M. Gorgoi, D. Gonbeau, K. Edstro, Chem. Mater., 24 (2012) 1107.
42.H. Nara, T. Yokoshima, M. Otaki, T. Momma, T. Osaka, Electrochim. Acta, 110 (2013) 403. 43.L. Chen, T. Goto, T. Hirai, T. Amano, J. Mater. Sci. Lett., 9 (1990) 997.
44.Q. Xia, B. Wang, Y.P. Wu, H.J. Luo, S.Y. Zhao, T. van Ree, J. Power Sources, 180 (2008) 602. 45.G. Beamson, Surf. Sci. Spectra, 3 (1994) 357.
46.X. Liu, M.-C. Zheng, K. Xie, J. Power Sources, 196 (2011) 10667.
47.H. Takezawa, K. Iwamoto, S. Ito, H. Yoshizawa, J. Power Sources, 244 (2013) 149. 48.M. Herstedt, D.P. Abraham, J.B. Kerr, K. Edström, Electrochim. Acta, 49 (2004) 5097. 49.[T. Asakawa, K. Tanaka, I. Toyoshima, Langmuir, 4 (1988) 521.
50.C.-H. Doh, A. Veluchamy, D.-J. Lee, J.-H. Lee, B.-S. Jin, S.-I. Moon, C.-W. Park, D.-W. Kim, Bull. Korean Chem. Soc., 31 (2010) 1257.
51.F. La Mantia, J. Vetter, P. Nov k, Electrochim. Acta, 53 (2008) 4109. 52.W. Xing, J. Electrochem. Soc., 144 (1997) 1195.
53.Y. Ren, H. Wei, X. Huang, J. Ding, Int. J. Electrochem. Sci., 9 (2014) 7784. 54.A. Lisowska-Oleksiak, A.P. Nowak, B. Wicikowska, RSC Adv., 4 (2014) 40439.
55.Y.-K. Kim, J.-W. Moon, J.-G. Lee, Y.-K. Baek, S.-H. Hong, J. Power Sources, 272 (2014) 689. 56.C. Gao, H. Zhao, P. Lv, C. Wang, J. Wang, T. Zhang, Q. Xia, J. Electrochem. Soc., 161 (2014)
57.J. Tu, W. Wang, L. Hu, H. Zhu, S. Jiao, J. Mater. Chem., A 2 (2014) 2467. 58.F. Dai, R. Yi, M.L. Gordin, S. Chen, D. Wang, RSC Adv., 2 (2012) 12710.
59.H. Fukui, H. Ohsuka, T. Hino, K. Kanamura, ACS Appl. Mater. Inter., 2 (2010) 998. 60.N. Liu, H. Wu, M.T. McDowell, Y. Yao, C. Wang, Y. Cui, Nano Lett., 12 (2012) 3315. 61.J.R. MacDonald, M.B. Johnson, Impedance Spectroscopy: Emphasizing Solid Materials and
Systems, Wiley-Vch, New York, 1987.
62.C. Wang, A.J. Appleby, F.E. Little, Electrochim. Acta, 46 (2001) 1793.