P H Y S I C S Copyright © 2019 The Authors, some rights reserved; exclusive licensee American Association for the Advancement of Science. No claim to original U.S. Government Works. Distributed under a Creative Commons Attribution NonCommercial License 4.0 (CC BY-NC).
Giant optical nonlinearity interferences in
quantum structures
S. Houver1*†, A. Lebreton1, T. A. S. Pereira2, G. Xu3‡, R. Colombelli3, I. Kundu4, L. H. Li4, E. H. Linfield4, A. G. Davies4, J. Mangeney1, J. Tignon1, R. Ferreira1, S. S. Dhillon1*
Second-order optical nonlinearities can be greatly enhanced by orders of magnitude in resonantly excited nanostructures. These resonant nonlinearities continually attract attention, particularly in newly discovered materials. However, they are frequently not as heightened as currently predicted, limiting their exploitation in nanostructured nonlinear optics. Here, we present a clear-cut theoretical and experimental demonstration that the second-order nonlinear susceptibility can vary by orders of magnitude as a result of giant destructive, as well as constructive, interference effects in complex systems. Using terahertz quantum cascade lasers as a model source to investigate interband and intersubband nonlinearities, we show that these giant interferences are a result of an unexpected interplay of the second-order nonlinear contributions of multiple light and heavy hole states. As well as of importance to understand and engineer the resonant optical properties of nanostructures, this advanced framework can be used as a novel, sensitive tool to elucidate the band structure properties of complex materials.
INTRODUCTION
Nonlinear frequency generation is a ubiquitous technique with appli-cations ranging from frequency conversion to quantum optics and depends critically on the magnitude of the nonlinear susceptibility. Strongly enhanced second-order optical nonlinearities, which are orders of magnitude larger than in bulk, have been theoretically inves-tigated since the late 1980s (1–4) and experimentally demonstrated in various semiconductor nanostructures under resonant interband or intersubband excitation [for example, (5–10)] and recently in metallic nanostructures (11). These resonant nonlinearities are of perpetual interest in nonlinear optics, especially whenever new materials are discovered such as monolayer transition metal dichalcogenides (TMDs) (12–15). However, resonant nonlinear interactions involving transitions between semiconductor bands tend to be less efficient than currently predicted, permanently limiting their applications in non-linear physics and applications, as well as for frequency conversion in nano- and atomically thin materials.
Here, we theoretically and experimentally show the strong and unexpected interplay of resonant nonlinearities that occur when multiple intersubband and interband transitions are combined through excitation by terahertz (THz) frequency (photons of energyETHz~ 10 meV) and near-infrared (NIR; photons of energyENIR~ 1.5 eV) pumps, respectively. The second-order nonlinearityc(2)is thus doubly enhanced, permitting efficient sideband generation on an optical carrier (ENIR±EQCL) (8). Recently, it has been shown that quantum cascade lasers (QCLs) can be used as both the source for THz radiation (and intersubband excitation) and the nonlinear medium with an external
NIR excitation coupled into the QCL cavity (16–20). This renders the emission of QCLs ideal to probe low-energy excitations. QCLs exploit intersubband electronic transitions that enable laser action in the THz and mid-IR (MIR) regions of the electromagnetic spectrum. Here, we exploit this nonlinear response within the QCL and demonstrate that the second-order susceptibility, in a complex quantum-well (QW) nano-structure containing many conduction and valence quantum confined states, presents giant variations with the excitation energy, i.e., cancel-lations and enhancements of the susceptibility. We highlight for the first time an order of magnitude reduction of the second-order non-linear susceptibility at specific frequencies, particularly important when studying THz (i.e., low energy) transitions. Our theoretical model shows that these effects, unpredicted by customarily used and simple three-state models, result from pronounced susceptibility interferences be-tween the numerous nonlinear contributions from the many light (LH) and heavy (HH) hole states. To demonstrate this effect experimentally, we implemented an innovative reflection geometry that permits non-linear NIR-THz frequency mixing, exciting both LH and HH states. We also show that the nonlinear conversion can be realized over a large pump energy range (>50 meV), larger than a typical transmission ge-ometry, and can be used to probe the complex QCL band structure.
RESULTS AND DISCUSSION
Nonlinear susceptibility theoretical model
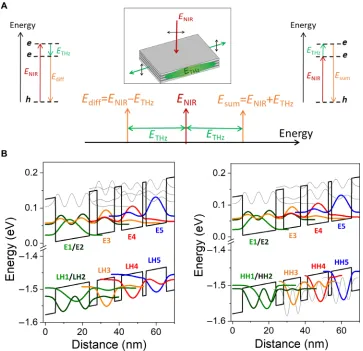
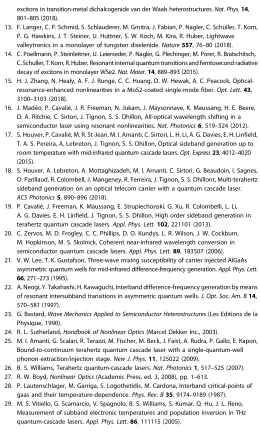
The nonlinear optical process between a NIR beam and a THz beam leads to the generation of beams at the sum frequency (Esum= ENIR+ETHz) and difference frequency (Ediff=ENIR−ETHz), as shown schematically in Fig. 1A. The NIR pump is resonant with an inter-band transition between a hole and an electron state, and the THz beam is resonant with an intersubband transition between two con-duction band states.
Previous detailed models of the nonlinear susceptibility (8,21,22) do not suit complex structures, such as QCLs, which contain a large number of quantum states. We have consequently developed an extended model to calculate the nonlinear susceptibility of a multiple QW structure by integrating over all possible transitions between elec-tron and hole states. This model is vital to understand the outcome of nonlinear frequency generation when different hole types are excited, as 1
Laboratoire de Physique de l’Ecole normale supérieure, ENS, Université PSL, CNRS, Sorbonne Université, Université Paris-Diderot, Sorbonne Paris Cité, Paris, France.2Instituto de Física, Universidade Federal de Mato Grosso, 78060-900
Cuiabá, Mato Grosso, Brazil.3Centre de Nanosciences et de Nanotechnologies, CNRS UMR 9001, Univ. Paris-Sud, Université Paris-Saclay, C2N-Orsay, 91405 Orsay, Cedex, France.4School of Electronic and Electrical Engineering, University of
Leeds, Leeds LS2 9JT, UK.
*Corresponding author. Email: [email protected] (S.H.); sukhdeep.dhillon@ lpa.ens.fr (S.S.D.)
†Present address: Institute for Quantum Electronics, ETH Zürich, 8093 Zurich, Switzerland.
‡Present address: Key Laboratory of Infrared Imaging Materials and Detectors, Shanghai Institute of Technical Physics, Chinese Academy of Sciences, Shanghai 200083, China.
S C I E N C E A D V A N C E S |
R E S E A R C H A R T I C L E
on October 6, 2019
http://advances.sciencemag.org/
in the case of the excitation geometry schematized in the inset of Fig. 1A. The NIR excitation propagates along the growth axis and is polarized in the plane of the QW layers, which will lead to excitation of both LH and HH hole-electron (LH-el and HH-el) transitions, owing to interband selection rules (23). The THz polarization is perpendicular to the QW layers (i.e., transverse magnetic polarized). We refer to this excitation configuration as the“reflection geometry”below. It is important to underline that close to resonant excitation, the NIR pump is largely ab-sorbed, rendering the role of phase mismatch negligible (24).
In this study, we consider a THz QCL, based on GaAs/Al0.15Ga0.85As QWs and barrier layers, designed to emit around 3 THz [12 meV, 80mm, from (25)]. Further details on the sample are presented in Materials and Methods. Figure 1B shows the calculated QCL band structure diagram with electron states and both LH (left) and HH (right) states. Among the large number of electron and hole states per period, those that contribute the most to both the QCL emission and the nonlinear response are highlighted (in color), which we discuss further below. The THz emission of the QCL is between electronic (conduction) band states (predominately E5-E4), with the external NIR emission exciting transitions between hole and electronic states.
The general nonlinear susceptibility expression for sum frequency generation (SFG) processcðsum2Þ is given in Eq. 1 in Materials and Methods, and we extend this expression to take into account complex structures. Of particular importance, we point out the sum over all the various confined electron and hole states in the band structure. We assume independent LH and HH parabolic dispersions so thatc(2)applies sep-arately for either contribution: LH and HH results add algebraically to give the total susceptibility for the reflection geometry. As we demon-strate below, the consideration of both the intra-LH and intra-HH interferences, as well as those of mixed LH-HH, are crucial to explain the full set of results. This is in stark contrast to the linear response, where the absorption intensities add and cancellation effects do not occur (neither intra nor mixed contributions). As the susceptibility includes all three-state possibilities with one hole and two electron states and one electron and two hole states, the susceptibility (related to either LH or HH states) can then be split into two terms,cðc2Þandcðv2Þ;referring to
[image:2.594.117.480.55.406.2]the conduction and valence bands, respectively, as detailed in Eq. 2 in Materials and Methods. The first essential aspect of this equation is the sign of the triple dipole product in the numerator, which can be pos-itive or negative depending on the transitions involved and can result in Fig. 1. Resonant nonlinear frequency mixing and QCL band structure.(A) Schematic diagram showing difference (left) and sum (right) frequency generation in a resonant excitation geometry and the corresponding spectrum. The green, red, and orange arrows represent the THz, NIR, and mixing beams, respectively. Inset: Case used for resonant excitation, with the external NIR polarization in the plane of the semiconductor QW layers. (B) Moduli squared of the relevant wave functions, shown with corresponding energies for electronic levels in the conduction band potential and for light hole (LH) levels (left) and heavy hole (HH) levels (right), respectively, in the valence band potential. The main electron and hole levels contributing to large interband dipoles are plotted in colors. The electric field applied to the structure for these simulations is 10 kV/cm.
on October 6, 2019
http://advances.sciencemag.org/
giant susceptibility destructive, as well as constructive, interferences. The second aspect is that every possible transition between electron and both hole types is accounted for. This leads to a noticeably increased number of contributions, which influences greatly the second order non-linearities, as we will show. Implementing the wave functions and ener-gies calculated as mentioned previously, the nonlinear susceptibility
cð2Þ
sumfor the QCL structure was determined.
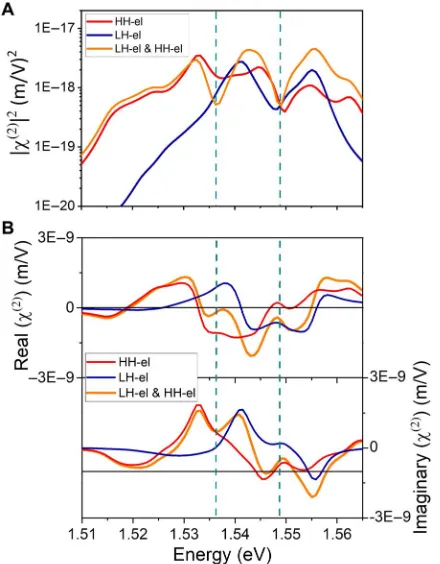
As the nonlinear efficiency is proportional to the square of the nonlinear susceptibility (2,24), the modulus squared, |c(2)|2, is plotted in Fig. 2A as a function of the sum energy for three configura-tions: taking into account the HH-el transitions only (∣cðHH2Þ∣, in red), the LH-el transitions only (∣cðLH2Þ∣, in blue), and both LH-el and HH-el transitions (in orange, corresponding to the reflection geometry). It is vital to note that, in addition to the independent HH and LH contribu-tions, the orange curve contains a HH-LH interfering term: |c(2)|2=
∣cð2Þ
HH∣ 2+∣cð2Þ
LH∣
2+ 2Re(cð2Þ
HHc
ð2Þ
LH). Each configuration shows different responses. For energies lower than 1.535 eV,∣cðLH2Þ∣2 is noticeably lower than∣cðHH2Þ∣2. Two features are worth highlighting. First, close to 1.548 eV, both HH and LH contributions display a pronounced mini-mum, as does the combined signal. Second, close to 1.535 eV, none of the HH and LH signals display alone a dip, while the combined con-tribution has a clear minimum. To better understand these effects, we
calculated the real and imaginary part ofc(2)(top and bottom parts of Fig. 2B, respectively), taking into account the individual contributions of HH-el transitions and LH-el transitions and their combined values. The energies of the two minima in the |c(2)|2are indicated by green dashed lines. We can thus observe that the minima of the combined signal (orange curve) occur only when both the real and imaginary parts ofc(2)simultaneously vanish or are close to zero (i.e., only around 1.535 and 1.548 eV).
[image:3.594.56.276.319.601.2]We note that for the minimum at 1.535 eV, the real part of the calculated susceptibilities from LH-el only and HH-el only is not close to zero but is of opposite sign: This strongly illustrates the impor-tant effect of the susceptibility sign and corresponding destructive inter-ference effects that substantially affect the second-order response of actual multiple QW structures. Similarly, the two imaginary parts in Fig. 2B further weaken the total susceptibility between the two minima: The orange curve changes sign and remains essentially between the two independent contributions (red and blue curves). This nuanced de-scription comprising cancellations of the nonlinear susceptibility from several positive and negative contributions, fully incorporated in the HH-LH interfering term, is missed within a simpler three-state model, as done in earlier works (8,21,22).
Experimental demonstration ofc(2)cancellations
To investigate this cancellation of the nonlinear susceptibility experi-mentally, we implemented an innovative excitation geometry within a THz QCL cavity. Previous experimental demonstrations of intracavity frequency mixing in THz QCLs exploited a transmission geometry along the long direction of the ridge. This can only probe the lowest lying interband states as the absorption strongly increases with the in-terband energy: It simultaneously severely reduces the region where SFG occurs to a very small part of the cavity and suppresses its propa-gation along the cavity toward the opposite side (absorption length is typically a few micrometers, whereas the cavity is a few millimeters)
(16–19). To circumvent this limitation and study the nonlinear
fre-quency mixing over a broad range of NIR energies and excite transi-tions involving both LH and HH states, we adopt a reflection geometry with the NIR excitation incident normal to the QCL ridge [schematized in the inset of Fig. 1A, similarly used in (20) for MIR QCLs]. As we will show, this geometry optimizes the ratio between the generation and propagation lengths for the SFG signal, allowing access to a much wider spectral region. As the top of the QCL com-prises a metal layer for mode confinement of the TM mode (26), two slits were etched into this metal layer to enable NIR propagation into the device and interband excitations in this geometry. The two-slit configuration (1-mm-long, 3-mm-wide slits separated by 45mm) is ex-plained in Materials and Methods.
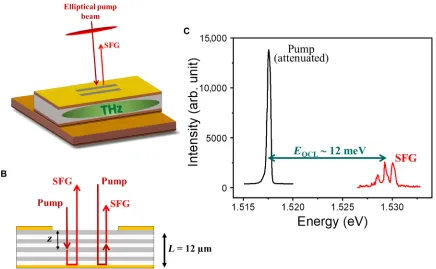
A schematic diagram of the excitation geometry is shown in Fig. 3A. The pump beam was focused using a short-focus cylindrical lens, creat-ing an elliptical beam shape that covers the area of the slits. The injected NIR beam propagates through the QCL layers, eventually reflected off the bottom gold layer of the QCL and recrosses the layers before exiting through the metal slit (if not completely absorbed). The sideband signal, which may be generated during either forward or backward paths of the pump, exits the structure through the slit and is finally detected. The expected paths for the pump and the SFG beams are shown in Fig. 3B. The experimental setup is further presented in Materials and Methods. To measure the resonant SFG response, the pump energyENIRis set below the bandgap and then slowly tuned to higher energies. An exam-ple of a measured SFG spectrum is shown in Fig. 3C for a given pump Fig. 2. Minima in the second-order nonlinear susceptibility.(A) Modulus
squared of the second-order susceptibility |c(2)|2as a function of sum energy
calculated taking into account HH-el transitions only (red curve) and LH-el transi-tions only (blue curve) and calculated for a combination of LH-el and HH-el tran-sitions (orange curve), according to selection rules in reflection geometry. (B) Real part (top) and imaginary part (bottom) of calculatedc(2)for SFG process,
consid-ering LH-el only (blue curves), HH-el only (red curves), and combined (orange curves) as a function of energy. The energy minima in the |c(2)|2combined
spectrum are indicated as green dashed lines and highlight the energies where both real and imaginary total parts (orange) are, or are close to, 0.
S C I E N C E A D V A N C E S |
R E S E A R C H A R T I C L E
on October 6, 2019
http://advances.sciencemag.org/
energy: We see that the pump and the SFG traces are separated by the QCL photon energy of about 12 meV (different peaks corresponding to the spectral emission of the QCL).
The SFG intensity is plotted on a logarithmic scale as a function of the sum energy (i.e.,Esum=ENIR+ETHz) in Fig. 4 (black squares, right axis). By seriously reducing the interaction length in the reflection geometry (compared to a transmission geometry), the ac-cessible energy range where the sum frequency is now generated is more than 50 meV, much larger than previous demonstrations of THz QCLs based on sideband generation (16,19). The intensity increases from lower energies, reaching a maximum of around 1.525 eV, then globally decreases until reaching the sensitivity limit at about 1.56 eV. Two remarkable minima (of about two orders of magnitude) occur for sum energies of 1.535 and 1.548 eV. The global decrease from the maximum efficiency can be attributed to interband absorption. Al-though absorption is substantially reduced in this geometry, it is still important. To account for interband absorption in our model, we con-sider the factorFdetailed in Eq. 3 in Materials and Methods. This factor takes into account both the pump and the SFG absorption as they prop-agate through the structure. Effects related to the propagation of the pump and difference signals through the sample were included in our simulations. Absorption effects are important and are discussed in Materials and Methods. We have verified that interference effects owing to the 12-mm-thick active region, on the contrary, do not play a signif-icant role. For such a resonant interband excitation cavity, any cavity interference would be smeared out in the measured SFG signal owing to the high optical loss in such a geometry. Furthermore, no dips are observed below the bandgap edge where the losses are lower.
The productF.|c(2)|2is plotted in red in Fig. 4 (left axis), with the same logarithmic scale increment as the experimental data (right axis). The SFG intensity and calculatedF.|c(2)|2show a very similar behavior as a function of sum energy, both featuring two remarkable minima near 1.535 and 1.548 eV, illustrating the effect of the susceptibility sign. Although the first minimum near 1.535 eV is not as deep in the simulations as in the experimental data and is slightly shifted to 1.538 eV, this discrepancy is most likely due to small differences be-tween the calculated band structure and the actual grown QW struc-ture. As discussed below, the calculations are very sensitive to the form of the wave function, the number of quantum states considered, the applied field, and the effect of band bending due to charge migration, which only change the band structure slightly but can considerably affect the nonlinear susceptibility. Note that the minima have not been observed for this QCL in transmission geometries due to the much stronger absorption (also in agreement with modeling, which predicts a much smaller F factor). Last, for comparison, we also plot in Fig. 4 (in green, left axis)F∣cðno int2Þ :∣2=F(∣cðHH2Þ∣
2+∣cð2Þ LH∣
2), i.e., the
sus-ceptibility without the interfering term. The comparison between the red and green curves illustrates the importance of the HH-LH interfering term on the SFG spectrum, in particular for the interpreta-tion of the measured minima that is not observed in the green curve.
Origins of the cancellations
[image:4.594.81.517.64.333.2]As demonstrated above, the existence of an interfering term between the HH and LH contributions is of paramount importance in the explanation of the measured SFG minima. However, to obtain a full understanding of the multivariate cancellation effects in an actual QCL structure, it is Fig. 3. Sum frequency generation in reflection geometry.(A) Schematic diagram of the experimental geometry implemented to excite the QCL. Two slits were etched into the top gold surface of the QCL to let the NIR pump excite the QW structure. (B) Propagation of the pump and generated sum beams through the layered structure. The SFG could be generated during either forward or backward path of the pump. (C) Example of SFG spectrum around 1.529 eV for a pump excitation near 1.517 eV.
on October 6, 2019
http://advances.sciencemag.org/
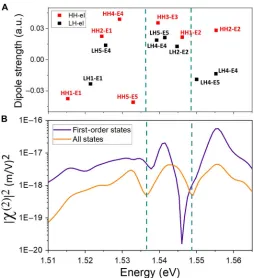
also important to consider intra-HH and intra-LH interferences, which we discuss now. As already mentioned, the QCL structure has many conduction and valence states (see, e.g., Fig. 1B). Below, we have analyzed in more detail the effect of truncating the numerous inter-band transitions to only those that display the largest calculated dipoles. Figure 5A shows the transitions with the largest calculated dipoles. As expected, the largest dipoles (in absolute value) appear for transitions involving electron and hole states with the strongest spatial overlaps (see Fig. 1B). Note finally the different signs of the dipoles. The different relative signs and intensities in Fig. 5A assist in understanding the existence of important cancellation effects. In Fig. 5A, a concentration of large dipoles between the two minima and the absence of large inter-band dipoles for energies around the minima (indicated as green dashed lines) are also worth noticing. As most of the large dipoles result from transitions between similarly confined electron and hole states (En, LHn, and HHn withn= 1, 3, 4, and 5 in Fig. 1B), we can then question whether a reduced model that only considers these dominant interband transitions still permits a good description of the experimental results. In Fig. 5B, we show calculated |c(2)|2obtained by taking into account either all possible states (orange curve) or only En, LHn, and HHn states (“1st order states,”purple curve). We observe that the reduced model still describes the second minimum near 1.548 meV accurately, with an even deeper drop, likely owing to the absence of the nearby large dipoles LH2-E2 and HH1-E2 in this model. However, the first minimum is less visible and blue shifted in the reduced scheme, highlighting the im-portance of the summing overall states and its strong and unavoidable cancellation effects on the second-order susceptibility in forming an accurate description of the nonlinear interaction.
It is also worth pointing out that small changes in the parameters of the QCL structure may lead to discernible changes in the nonlinear sus-ceptibility, not only providing important information on the band structure but also introducing a mechanism to tune the cancellations in the nonlinear susceptibility. To illustrate this point, we show the
[image:5.594.304.558.53.331.2]sensitivity ofc(2)simulations to a small variation of the external electric field applied to the QCL structure (assuming unrealistically that the laser action from the QCL is always present) in fig. S3. By changing the field from 7 to 12 kV/cm, the energy separation of the two dips contin-uously increases, while their relative intensities reverses with increasing field. These two sizeable evolutions demonstrate that both the minima positions and their visibilities are very sensitive to the external applied electric field and hence to the band structure profile. This illustrates a scheme to engineer the nonlinear susceptibility, whereby a strong enhancement or suppression can be achieved for certain frequencies by a slight modification of the wave functions and applied potential drops. Thus, the observed destructive interferences do not result in a fundamental limitation in the nonlinearity and could be avoided by engineering the coupling between the quantum states implicated in the nonlinear interaction (see the Supplementary Materials). On the other hand, comparing the SFG intensity experimental data with the simulated response using a complete model may serve as a powerful tool to access the actual band structure profile, with respect to the nominal parameters, i.e., to determine the wave function profiles of the confined states. By finely tuning band structure parameters such as the layer width or the doping level, the simulation results could be tuned to the experimental SFG intensity spectrum. Such a characteriza-tion of complex QW structures is otherwise inaccessible by linear optical spectroscopy (as, e.g., by absorption, which is insensitive to any cancellation effect, and usually shows an unstructured form in ac-tual QCLs owing to closely spaced energy levels).
Fig. 4. SFG intensity from experimental data and theoretical model.SFG intensity (black squares, right axis) measured in the reflection geometry with NIR excitation through the top slits, as a function of sum energy. Modulus squaredF.|c(2)|2(red line, left axis) calculated for the same geometry, taking
into account the appropriate combination of LH-el and HH-el, and the ab-sorption factor. The term without interference of the LH and HH contributions
F.|cno int(2)|2is also plotted (green curve). All plots are presented with the same
[image:5.594.39.290.54.232.2]logarithmic scale increment.
Fig. 5. Susceptibility minima origins.(A) Interband dipole strength of both HH-el (red) and LH-HH-el (black) transitions [only dipoles with absolute strength >0.01 ar-bitrary units (a.u.) are shown]. (B) Modulus squared |c(2)|2calculated in reflection
geometry for both HH-el and LH-el transitions, taking into account all states (or-ange curve) and only the first-order confined states (purple curve). Minima pre-viously discussed are indicated by green dashed lines.
S C I E N C E A D V A N C E S |
R E S E A R C H A R T I C L E
on October 6, 2019
http://advances.sciencemag.org/
CONCLUSIONS
To conclude, we have experimentally and theoretically investigated the important interplay of resonant nonlinearitiesc(2)for interband and intersubband excitations in a complex multiple QW structure. This has highlighted strong deviations from the expected response and shown giant cancellations of the nonlinear susceptibility at certain energies, as well an overall reduction, owing to different contributions from LH and HH. This unusual nonlinear susceptibility behavior was experimentally demonstrated by nonlinear frequency mixing between a NIR and THz beam within a QCL, demonstrating the importance of considering all the quantum states in such a system. This model and experimental observations open the possibility for the careful design and engineering of QW band structures to obtain a desired spectrum of nonlinear susceptibility or to use nonlinear frequency mixing as a probe of complex band structures that are otherwise inaccessible. One can consider engineering structures to achieve a nonlinear response with tunable minima, potential extinctions, or even enhancements at specific energies, adding destructively or constructively contributions from competing contributions. To conclude, the formulism developed here could be applied to any material with a bandgap either through heterostructures or through nanostructuration of the surface and where the material is excited resonantly. This will further the manipulation of quantum confined states for efficient frequency conversion in nano-structured materials.
MATERIALS AND METHODS QCL band structure
For this study, we considered a THz QCL, fabricated from the GaAs/ Al0.15Ga0.85As heterostructure material system. The active region is based on a four-QW design relying on a diagonal transition coupled to a phonon extraction stage (25). It is designed to emit around 3 THz (12 meV, 80mm). The layer sequence of one period of structure in nanometers is5.5/11.0/1.8/11.5/3.8/9.4/4.2/18.4 nm. Al0.15Ga0.85As barriers are indicated in bold font, and GaAs wells are in normal font. A Si n-doped GaAs layer (n= 2 × 1016cm−3) is underlined. The QCL was grown on a <100> substrate. The calculated QCL band structure diagram using a Schrödinger solver for electrons and holes states is presented in Fig. 1B. The laser transition occurs between the upper electronic level E5 (blue line) and the lower electronic level E4 (red line). The first band structure (on the left) shows electron and LH confined states, while the second band structure shows electron and HH confined states. The electron-hole dipoles are largest for transitions between first-order confined hole and corresponding electron states, plotted in the same color in Fig. 1B (H1-E1 in green, H3-E3 in orange, H4-E4 in red, and H5-E5 in blue).
Second-order nonlinear susceptibility model
The general nonlinear susceptibility expression for sum frequency generation processcðsum2Þ is given by (27)
cð2Þ sum¼
1
e0V
∫
kmnv∑mmnmnvmvm
DEmnþEkEsumiG rmrv
DEvmþEkENIRiGþ
rnrv
DEnvþEkENIRiG
ð1Þ wherem,n, andvare the various confined electron and hole states in the band structure andkis the in-plane wave vector (which is conserved in
the dipole approximation).DEij(mij) refers to the transition energy (di-pole matrix element) between statesiandj.Ekis the kinetic energy for the relative electron-hole motion, andrirepresents the population of statei. The broadening coefficientGwas set to 2 meV corresponding to a QCL operating temperature of 10 K (28).ENIRandEsumrefer to the
NIR pump energy and the sum energy, respectively. The occupancyriis taken to be 1 for states in the valence band and, owing to the low-level doping and weak photoexcitation, is negligible for states in the conduc-tion band. The susceptibility (related to either LH or HH states) can then be split into two terms,cðc2Þandcðv2Þ;refering to the conduction and valence bands, respectively
cð2Þ sum¼cð
2Þ
c þcð
2Þ
v ¼
1
e0V
∫
k∑
mnn″
mmnmnn″mn″m
ðDEmnþEkEsumiGÞðDEn″mþEkENIRiGÞþ
∑
mm″n
mmnmnm″mm″m
ðDEnmþEkEsumiGÞðDEnm″þEkENIRiGÞ !
ð2Þ
Indicesnandn″refer to electron states in the conduction band and indicesmandm″refer to hole states in the valence band. The total second-order susceptibility of the QCL can then be noted as
c(2)=c(2)
sum(HH)+c(2)sum(LH).
Note that |c(2)|2, calculated at 10 K, was red shifted by 13 meV to account for a bandgap shift, observed in the experiments, due to a local temperature increase by the electrical power dissipated in the QCL (29). This shift appears clearly when comparing (see fig. S2) the photo-luminescence of the biased QCL with the calculated energies (at 10 K) of the first electron-hole transitions of the structure.
QCL fabrication and slit design
The THz QCL structure was grown by molecular beam epitaxy. The active region comprises 180 periods, resulting in a total thickness of 12mm. The THz QCL was processed into a metal-metal waveguide, where the active region is sandwiched between two metal stripes, with 150-mm-wide ridges, cleaved into 3-mm-long cavities, and indium-soldered to copper mounts. As the top of the QCL comprises a metal layer for mode confinement, apertures need to be etched into this metal layer for the NIR to propagate into the device and enable interband ex-citations in this geometry. The aperture positions were judiciously de-signed via numerical simulations of the THz field intensity in the QCL cavity such that the QCL performance is not affected, and there is an overlap between the interacting NIR and THz electric fields. Results of these simulations are presented in fig. S1, where a two-slit configuration (1-mm-long, 3-mm-wide slits separated by 45mm) is chosen because the fundamental and first excited modes are found to have a consequential field under the apertures (see Fig. 3A). The two-slit configuration was realized by focused ion beam etching. The QCL output power and voltage-current characteristics were found to be very similar after etching the slits to those before etching. We note that the emitted angle of the generated NIR beam is expected to be similar to that of the NIR pump because the THz k-vector is small compared to that of the NIR.
Experimental setup
The device was placed in a continuous flow cryostat at 10 K. The external NIR excitation was provided by a continuous-wave tunable titanium-sapphire
on October 6, 2019
http://advances.sciencemag.org/
laser with an output power set to 2 mW. Although all polarizations of the NIR pump were equivalent for the SFG process (polarization in the plane of the semiconductor layers), we chose a NIR polarization parallel to the slit direction to avoid plasmonic effects on the metal edges. The sideband signal, which may be generated during either forward or backward paths of the pump, with the same polarization as the pump, was detected using a grating spectrometer coupled to a charge-coupled device array.
Absorption factor
To account for interband absorption in our model, we considered the factor
F ¼
∫
2L
0
expðaPzÞexpðaSFGð2LzÞÞdz 2L
¼expð2aPLÞ1exp2ð2ðaSFGaPÞLÞ LðaSFGaPÞ
ð3Þ
whereaPandaSFGare the energy-dependent absorption coefficients of the pump and SFG, respectively, andL= 12mm is the sample thickness. This factor takes into account the absorption of the pump (first term on the integrand) and the SFG (second term on the integrand) beams, in either forward (zfrom 0 toL) or backward (zfromLto 2L) direction of the NIR excitation through the QCL, as shown schematically in Fig. 3B.
SUPPLEMENTARY MATERIALS
[image:7.594.301.561.54.489.2]Supplementary material for this article is available at http://advances.sciencemag.org/cgi/ content/full/5/10/eaaw7554/DC1
[image:7.594.88.243.195.243.2]Fig. S1. Simuations of THz mode confinement in a double-metal QCL with one (left) and two (right) apertures in the top metal layer.
Fig. S2. Photoluminescence (PL) spectrum measured in reflection on a QCL facet when the QCL is biased at the threshold voltage.
Fig. S3. Modulus squared |c(2)|2calculated in reflection geometry for different electric fields applied to the structure, from 7 to 12 kV/cm, as a function of energy.
REFERENCES AND NOTES
1. J. Khurgin, Second-order nonlinear effects in asymmetric quantum-well structures.Phys. Rev. B38, 4056–4066 (1988).
2. E. Rosencher, P. Bois, Model system for optical nonlinearities: Asymmetric quantum-wells.
Phys. Rev. B44, 11315–11327 (1991).
3. E. Rosencher, A. Fiore, B. Vinter, V. Berger, P. Bois, J. Nagle, Quantum engineering of optical nonlinearities.Science271, 168–173 (1996).
4. M. K. Gurnick, T. A. Detemple, Synthetic nonlinear semiconductors.IEEE J. Quantum Elect. 19, 791–794 (1983).
5. J. Kono, M. Y. Su, T. Inoshita, T. Noda, M. S. Sherwin, S. J. Allen, H. Sakaki, Resonant terahertz optical sideband generation from confined magnetoexcitons.Phys. Rev. Lett. 79, 1758–1761 (1997).
6. J.Černe, J. Kono, T. Inoshita, M. Sherwin, M. Sundaram, A. C. Gossard, Near-infrared sideband generation induced by intense far-infrared radiation in GaAs quantum wells.
Appl. Phys. Lett.70, 3543–3545 (1997).
7. C. Sirtori, F. Capasso, D. L. Sivco, S. N. G. Chu, A. Y. Cho, Observation of large second order susceptibility via intersubband transitions atl∼10mm in asymmetric coupled AlInAs/GaInAs quantum wells.Appl. Phys. Lett.59, 2302–2304 (1991).
8. S. G. Carter, V. Ciulin, M. Hanson, A. S. Huntington, C. S. Wang, A. C. Gossard, L. A. Coldren, M. S. Sherwin, Terahertz-optical mixing in undoped and doped GaAs quantum wells: From excitonic to electronic intersubband transitions.Phys. Rev. B72, 155309 (2005). 9. I. C. Sandall, N. E. Porter, M. Wagner, H. Schneider, S. Winnerl, M. Helm, L. Wilson, Terahertz optical sideband emission in self-assembled quantum dots.Appl. Phys. Lett.96, 201105 (2010). 10. A. Ghalgaoui, K. Reimann, M. Woerner, T. Elsaesser, C. Flytzanis, K. Biermann, Resonant second-order nonlinear terahertz response of gallium arsenide.Phys. Rev. Lett.121, 266602 (2018). 11. H. Qian, S. Li, C.-F. Chen, S.-W. Hsu, S. E. Bopp, Q. Ma, A. R. Tao, Z. Liu, Large optical
nonlinearity enabled by coupled metallic quantum wells.Light Sci. Appl.8, 13 (2019). 12. J. Kunstmann, F. Mooshammer, P. Nagler, A. Chaves, F. Stein, N. Paradiso, G. Plechinger,
C. Strunk, C. Schuller, G. Seifert, D. R. Reichman, T. Korn, Momentum-space indirect interlayer
excitons in transition-metal dichalcogenide van der Waals heterostructures.Nat. Phys.14, 801–805 (2018).
13. F. Langer, C. P. Schmid, S. Schlauderer, M. Gmitra, J. Fabian, P. Nagler, C. Schuller, T. Korn, P. G. Hawkins, J. T. Steiner, U. Huttner, S. W. Koch, M. Kira, R. Huber, Lightwave valleytronics in a monolayer of tungsten diselenide.Nature557, 76–80 (2018). 14. C. Poellmann, P. Steinleitner, U. Leierseder, P. Nagler, G. Plechinger, M. Porer, R. Bratschitsch,
C. Schuller, T. Korn, R. Huber, Resonant internal quantum transitions and femtosecond radiative decay of excitons in monolayer WSe2.Nat. Mater.14, 889–893 (2015).
15. H. J. Zhang, N. Healy, A. F. J. Runge, C. C. Huang, D. W. Hewak, A. C. Peacock, Optical-resonance-enhanced nonlinearities in a MoS2-coated single-mode fiber.Opt. Lett.43, 3100–3103 (2018).
16. J. Madéo, P. Cavalié, J. R. Freeman, N. Jukam, J. Maysonnave, K. Maussang, H. E. Beere, D. A. Ritchie, C. Sirtori, J. Tignon, S. S. Dhillon, All-optical wavelength shifting in a semiconductor laser using resonant nonlinearities.Nat. Photonics6, 519–524 (2012). 17. S. Houver, P. Cavalié, M. R. St-Jean, M. I. Amanti, C. Sirtori, L. H. Li, A. G. Davies, E. H. Linfield,
T. A. S. Pereira, A. Lebreton, J. Tignon, S. S. Dhillon, Optical sideband generation up to room temperature with mid-infrared quantum cascade lasers.Opt. Express23, 4012–4020 (2015).
18. S. Houver, A. Lebreton, A. Mottaghizadeh, M. I. Arnanti, C. Sirtori, G. Beaudoin, I. Sagnes, O. Parillaud, R. Colombell, J. Mangeney, R. Ferreira, J. Tignon, S. S. Dhillont, Multi-terahertz sideband generation on an optical telecom carrier with a quantum cascade laser.
ACS Photonics5, 890–896 (2018).
19. P. Cavalié, J. Freeman, K. Maussang, E. Strupiechonski, G. Xu, R. Colombelli, L. Li, A. G. Davies, E. H. Linfield, J. Tignon, S. S. Dhillon, High order sideband generation in terahertz quantum cascade lasers.Appl. Phys. Lett.102, 221101 (2013).
20. C. Zervos, M. D. Frogley, C. C. Phillips, D. O. Kundys, L. R. Wilson, J. W. Cockburn, M. Hopkinson, M. S. Skolnick, Coherent near-infrared wavelength conversion in semiconductor quantum cascade lasers.Appl. Phys. Lett.89, 183507 (2006). 21. V. W. Lee, T. K. Gustafson, Three-wave mixing susceptibility of carrier injected AlGaAs
asymmetric quantum wells for mid-infrared difference-frequency generation.Appl. Phys. Lett. 66, 271–273 (1995).
22. A. Neogi, Y. Takahashi, H. Kawaguchi, Interband difference-frequency generation by means of resonant intersubband transitions in asymmetric quantum wells.J. Opt. Soc. Am. B14, 570–581 (1997).
23. G. Bastard,Wave Mechanics Applied to Semiconductor Heterostructures(Les Editions de la Physique, 1990).
24. R. L. Sutherland,Handbook of Nonlinear Optics(Marcel Dekker Inc., 2003).
25. M. I. Amanti, G. Scalari, R. Terazzi, M. Fischer, M. Beck, J. Faist, A. Rudra, P. Gallo, E. Kapon, Bound-to-continuum terahertz quantum cascade laser with a single-quantum-well phonon extraction/injection stage.New J. Phys.11, 125022 (2009).
26. B. S. Williams, Terahertz quantum-cascade lasers.Nat. Photonics1, 517–525 (2007). 27. R. W. Boyd,Nonlinear Optics(Academic Press, ed. 3, 2008), pp. 1–613.
28. P. Lautenschlager, M. Garriga, S. Logothetidis, M. Cardona, Interband critical-points of gaas and their temperature-dependence.Phys. Rev. B35, 9174–9189 (1987). 29. M. S. Vitiello, G. Scamarcio, V. Spagnolo, B. S. Williams, S. Kumar, Q. Hu, J. L. Reno,
Measurement of subband electronic temperatures and population inversion in THz quantum-cascade lasers.Appl. Phys. Lett.86, 111115 (2005).
Acknowledgments
Funding:We acknowledge financial support from the French National Research Agency (ANR-13-BS03-0001“RE-LINQ”) and from the EPSRC (UK) program grant HyperTerahertz EP/P021859/1. E.H.L acknowledges support from the Royal Society and the Wolfson Foundation.Author contributions:S.H. conceived and set up the experiment, acquired and interpreted the experimental data, and developed the simulations. A.L. acquired and interpreted the experimental data. S.S.D. conceived the experimental concept. T.A.S.P. and R.F. developed the theoretical model. Sample growth was performed by L.H.L., E.H.L., and A.G.D.; sample process was performed by G.X. and R.C.; and the slit etching was performed by I.K. The manuscript was written and the data were interpreted by S.H., R.F., and S.S.D. R.C., J.M., and J.T. provided insights. All work was coordinated and overseen by S.S.D. All authors contributed to the discussion and to the final manuscript.Competing interests:The authors declare that they have no competing interests.Data and materials availability:All data needed to evaluate the conclusions in the paper are present in the paper and/or the Supplementary Materials. Additional data related to this paper may be requested from the authors.
Submitted 29 January 2019 Accepted 9 September 2019 Published 4 October 2019 10.1126/sciadv.aaw7554
Citation:S. Houver, A. Lebreton, T. A. S. Pereira, G. Xu, R. Colombelli, I. Kundu, L. H. Li, E. H. Linfield, A. G. Davies, J. Mangeney, J. Tignon, R. Ferreira, S. S. Dhillon, Giant optical nonlinearity interferences in quantum structures.Sci. Adv.5, eaaw7554 (2019).
S C I E N C E A D V A N C E S |
R E S E A R C H A R T I C L E
on October 6, 2019
http://advances.sciencemag.org/
Tignon, R. Ferreira and S. S. Dhillon
S. Houver, A. Lebreton, T. A. S. Pereira, G. Xu, R. Colombelli, I. Kundu, L. H. Li, E. H. Linfield, A. G. Davies, J. Mangeney, J.
DOI: 10.1126/sciadv.aaw7554 (10), eaaw7554. 5
Sci Adv
ARTICLE TOOLS http://advances.sciencemag.org/content/5/10/eaaw7554
REFERENCES
http://advances.sciencemag.org/content/5/10/eaaw7554#BIBL
This article cites 26 articles, 1 of which you can access for free
PERMISSIONS http://www.sciencemag.org/help/reprints-and-permissions
Terms of Service
Use of this article is subject to the
registered trademark of AAAS.
is a
Science Advances
Association for the Advancement of Science. No claim to original U.S. Government Works. The title
York Avenue NW, Washington, DC 20005. 2017 © The Authors, some rights reserved; exclusive licensee American (ISSN 2375-2548) is published by the American Association for the Advancement of Science, 1200 New
Science Advances
on October 6, 2019
http://advances.sciencemag.org/