Int. J. Electrochem. Sci., 11 (2016) 9783 – 9789, doi: 10.20964/2016.12.12
International Journal of
ELECTROCHEMICAL
SCIENCE
www.electrochemsci.org
Short Communication
Oriented texture of Y-doped La
10Si
6O
27Ceramic prepared by
rapid solidification method
Dechuan Li1*, Mingyu Li2, Yongxing Zhang1, Guangping Zhu1, Xude Wang1 1
School of Physics & Electronic Information, Huaibei Normal University, Huaibei, 235000, China 2
Department of mathematics and physics, Zhengzhou Institute of Aeronautical Industry Management, Zhengzhou, 450046, China
*
E-mail: [email protected]
Received: 30 July 2016 / Accepted: 21 September 2016 / Published: 10 November 2016
Oriented texture La9.33Y0.67Si6O27 ceramic was successfully synthesized by laser rapid solidification method. The La9.33Y0.67Si6O27 crystal was formed only after Yttrium was added into the La10Si6O27 ceramic under the sintering of CO2 continuous wave laser. As for pure La10Si6O27, the oriented texture ceramic could not be sinterable directly. Even the La10Si6O27 preparing by high temperature solid state reaction begins to decompose under laser sintering. The result shows that the suitable sintering laser power of texture La9.33Y0.67Si6O27 ceramic is 400W. Thermal expansion coefficient of La9.33Y0.67Si6O27 is 7.7110-6 K-1, 7.7610-6 K-1 and 7.8310-6 K-1 at 600oC, 650oC and 700oC, respectively. The cell with textured La9.33Y0.67Si6O2 shows a better output power density than that of La10Si6O27.The data suggest that the texture and lower thermal expansion La9.33Y0.67Si6O27 ceramic could be prepared by Yttrium substitution using laser sintering for the high oxide ion conduction.
Keywords: Ceramic; Texture; Laser sintering; Lanthanum silicate; Thermal expansion coefficient
1. INTRODUCTION
high temperature is needed for the preparation of La10Si6O27. According to the previous report by Nakayama et al. [5], La10Si6O27 was synthesized by solid reaction method sintered at 1700-1800oC. Using a suitable thermal pretreatment, the sintering temperature could be reduced to 1600oC [6]. Even taking the water-based gel-casting technique, the synthesis temperature of La10Si6O27 could be descended to 1550oC [7]. Additionally, the secondary phase is generated frequently in the synthesized process. The formation of the second phase is unfavorable because the ceramic might be destroyed by the reaction between the compound and H2O or CO2. Besides, the impurity phase could greatly retard the oxygen ion conduction [8-10]. Itagkai et al reported that the minor phase of La2SiO5 could be reduced by Li-doping in lanthanide silicate, which is existed at the grain boundaries [11]. On the other hand, the preparation of oriented growth ceramic with few grain boundary is an efficient method to improve the oxygen ion transportation. Tao et al indicated that the grain boundary resistance is dominant in the impedance spectrum for conductivity [12]. Nakayama et al investigated the oxygen ionic conductivity of Nd9.33(SiO4)O2 single crystal, and founded that the conductivity value parallel to c-axis is higher about ten times than the value perpendicular to c-axis in an anisotropy crystal [13]. Oriented ceramic has more advantage than isotropic ceramic in ionic conduction. Therefore, it is more significant to find a better synthesis method for obtaining pure and oriental grown lanthanum silicate ceramic.
In current work, we prepared the oriented texture La9.33Y0.67Si6O27 ceramic by laser rapid solidification method. This texture ceramic has larger grain. Few grain boundaries of this texture ceramic have the great advantage in conducting oxygen ion. On the other hand, La and Y could take the site in each other crystal lattice in Lanthanum silicate. Y doped La10Si6O27 could not introduce the second phase at the grain boundary to increase the grain boundary resistance. Hence, we evaluate the synthesis, character and thermal expansion of pure oriented La9.33Y0.67Si6O27 ceramics by laser rapid solidification method.
2. EXPERIMENT
The crystal structures of powders were characterized by X-ray diffraction (PANalytical B.V.) using an X’pert PRO diffractometer and Cu K radiation in the 2Ɵ range of 10-80o. Scanning electron microscopy (SEM) (JSM-6700F) was employed to examine the morphology of the fracture of the sample. The linear thermal expansion coefficient (TEC) was measured on the thermal expansion apparatus (LINSEIS DIL L76) using quartz as the reference material with a heating rate of 5oC per min from room temperature to 800oC. The electrochemical performances were tested by a PARSTAT 2273 (Princeton, USA) at 600oC.
3. RESULTS AND DISCUSSION
3.1 The influence of Y doping on the stability of La9.33Y0.67Si6O27
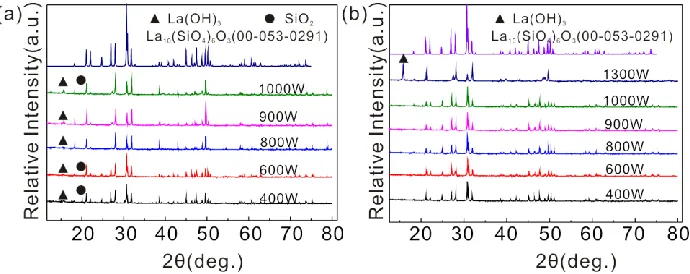
In this experiment, we investigated whether the pure La10Si6O27 was prepared by rapid solidification method. Figure 1(a) shows the X-ray powder diffraction patterns of La10Si6O27 powders by CO2 laser sintering between 400W and 1000W. According to the major phase, all five samples exhibit an apatite structure (JCPDS: 00-053-0291). The secondary phases La(OH)3 and SiO2 were also detected. The existence of La(OH)3 was the result of reaction between La2O3 and H2O in atmosphere. The interesting thing is that the impure La10Si6O27 bulk would decompose into pieces especially in wet atmosphere after 12h, which is different from ceramic prepared by solid reaction. The laser power densities corresponding with laser power were listed in Table 1. Even when the pure La10Si6O27 prepared by solid reaction method at 1600oC (6h) was sintered again by laser, the sintered ceramic was also cracked as before.
Figure 1(b) shows XRD patterns of La9.33Y0.67Si6O27 sintering by CO2 laser between 400W and 1300W and diffraction data of the apatite La10Si6O27 (JCPDS: 53-291). It can be seen that apatite phases have been formed under the power of 1000W. When the laser power was high than 1300W, the peak of La(OH)3 was observed obviously in the XRD pattern. The minor phase would make the bulk ceramic decompose into pieces because the water was absorbed by La2O3. It might be related to the vapor of SiO2 under high power density.
[image:4.596.127.472.69.206.2]
Figure 1. XRD patterns of (a) La10Si6O27; (b) La9.33Y0.67Si6O27 ceramic sintered by CO2 laser with different irradiation of laser power.
Table 1. Laser power and corresponding laser power density irradiate on samples
Power (W) 400 600 800 900 1000 1300
Power density (W cm-2) 509 764 1019 1146 1273 1656
Figure 2. SEM images of ceramic sintered by CO2 laser:(a)La10Si6O27 sintered at 1000W; (b)La9.33Y0.67Si6O27 sintered at 400W.
3.2 Thermal expansion analysis of La9.33Y0.67Si6O27
[image:4.596.113.478.287.480.2] [image:4.596.111.484.570.709.2]
Figure 3 shows the thermal expansion curves of La9.33Y0.67Si6O27 and La10Si6O27 with the heat data. The La9.33Y0.67Si6O27 exhibited high orientation and similar thermal expansion with the La10Si6O27.The maximum TEC value is 7.9110-6K-1 at 800oC for La9.33Y0.67Si6O27, which is approximate to the report [18]. The TEC value of this texture La9.33Y0.67Si6O27 ceramic is smaller than 9.710-6K-1 for La10Si6O27, 10.010-6K-1 for YSZ and 11.810-6K-1 for GDC [7]. Ou et al also report that Cu-doped La10Si6-xCuxO27- shows approximately TEC values of 8.8-9.110-6K-1 at 25-800oC [19]. The TEC value of the texture ceramic increased gently with the temperature elevated, which might be more suitable for the electrolyte to match cathode and anode components of solid state fuel cells.
3.3 Cell performance
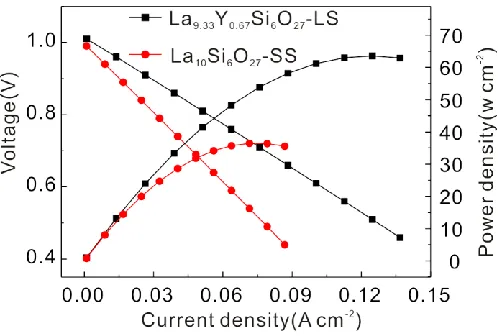
[image:5.596.192.441.446.614.2]A single fuel cell of cathode|La9.33Y0.67Si6O27|anode was fabricated to evaluate the electrochemical performance. The thickness of the electrolyte was set to 1.5mm. The composite cathode was prepared by BSBCF and La9.33Y0.67Si6O27 with the mixed weight ratio of 60:40. The NiO-Sm doped CeO2 (70:30 wt%) was used for fuel cell anode. The calcined temperature of cathode and anode painted materials was 1100oC for 4h and 1400oC for 4h, respectively. For a single fuel cell, the fuel was H2 and the cathode was exposed to the air. Figure 4 shows the electrochemical performance of a single cell at 600oC. For comparison, the cell of cathode|La10Si6O27|anode was also fabricated. From the image, the open circuit voltage is approximately 1V for both texture La9.33Y0.67Si6O27 ceramic and La10Si6O27 (solid reaction method at 1600oC, 6h) corresponding to the high oxide ion conductivity of lanthanum silicate [17, 18, 20].
Figure 4. Cell voltage and power density of an electrolyte: La9.33Y0.67Si6O27 (laser sintering, LS) and La10Si6O27 (solid state reaction, SS)
the oxide ion conductor [21]. It is important to improve the oxide ion conductivity by reducing the resistance of the grain boundary than polycrystalline ceramic [7, 10]. The electrochemical performance of textured ceramic sintered by laser is excellent. The character of oxygen ion conduction is approximately for the sample prepared by floating zone method [13, 21]. The cell performance suggests that the textured La9.33Y0.67Si6O27 is a better electrolyte material for solid oxide fuel cells.
4. CONCLUSION
Y doped La9.33Y0.67Si6O27 oriented ceramic was successfully prepared by laser rapid solidification in two minutes with a CO2 laser. However, when the laser was applied into the La10Si6O27, the pure La10Si6O27 could not be gained even at higher laser power density of 1656 W cm -2
, which is mixed with the La2O3 impurity. Texture La10Si6O27 ceramic could not be prepared directly by laser rapid solidification method. The TEC of La9.33Y0.67Si6O27 (laser rapid solidification) is similar to that of La10Si6O27 (solid reaction method). TEC values are 7.71, 7.83 and 7.91×10⁻⁶ K-1 at 600, 700 and 800oC, respectively. The fuel cell with texture La9.33Y0.67Si6O27 shows better electrochemical performance than that of La10Si6O27. The improvement oxide ion conductivity may be ascribed to the decrease of grain boundary resistance and advantaged texture structure in the process of oxygen ion conduction.
ACKNOWLEDGEMENTS
This work was financially supported by the National Natural Science Foundation of China (51302102, 11504121), Natural Science Research Project for Colleges and Universities of Anhui Province (KJ2014B02, KJ2016A638), and the Huaibei Scientific Talent Development Scheme (20140305).
References
1. H. Arikawa, H. Nishiguchi, T. Ishihara, Y. Takita, Solid State Ionics, 136 (2000) 31. 2. H. Yoshioka, S. Tanase, Solid State Ionics, 176 (2005) 2395.
3. M.Y. Gorshkov, A.D. Neuimin, N.M. Bogdanovich, Y.V. Danilov, L.A. Dunyushkina, Russ. J. Electrochem., 43 (2007) 721.
4. S. Nakayama, M. Sakamoto, M. Highchi, K. Kodaira. J Mater Sci Lett, 19 (2000)91. 5. S. Nakayama, M. Sakamoto, J. Eur. Ceram. Soc., 18 (1998) 1413.
6. Y.L. Kuo, Y.Y. Liang, Ceram. Int., 38 (2012) 3955.
7. S.P. Jiang, L. Zhang, H.Q. He, K.Y. Rong, Y. Xiang, J. Power Sources, 189 (2009) 972. 8. S. Hwan Jo, P. Muralidharan, D.K. Kim, J. Mater. Res., 24 (2009) 237.
9. A.L. Shaula, V.V. Kharton, F.M.B. Marques, Solid State Ionics, 177 (2006) 1725. 10.J. Xiang, Z.G. Liu, J.H. Ouyang, F.Y. Yan, Ceram. Int., 40 (2014) 2401.
11.Y. Itagaki, N. Takeda, Y. Sadaoka, Ecs Transactions, 16 (2008) 539. 12.S. Tao, J.T.S. Irvine, Mater. Res. Bull., 36 (2001) 1245.
13.S. Nakayama, M. Sakamoto, M. Higuchi, K. Kodaira, M. Sato, S. Kakita, T. Suzuki, K. Itoh, J. Eur. Ceram. Soc., 19 (1999) 507.
14.J.M. Yu, M.J. Chao, D.C. Li, M.Y. Li, J. Power Sources, 226 (2013) 334.
17.D.D.Y. Setsoafia, P. Hing, S.C. Jung, A.K. Azad, C.M. Lim, Solid State Sci.,48 (2015) 163. 18.J. Xiang, Z.G. Liu, J.H. Ouyang, F.Y. Yan, J. Power Sources, 251 (2014) 305.
19.X.F. Ding, G.X. Hua, D. Ding, W.L. Zhu, H.J. Wang, J. Power Sources, 306 (2016) 630. 20.G. Ou, X.R. Ren, L. Yao, H. Nishijima, W. Pan, J. Mater. Chem. A, 2 (2014) 13817.
21.M. Higuchi, Y. Masubuchi, S. Nakayama, S. Kikkawa, K. Kodaira, Solid State Ionics, 174 (2004) 73.