IUCr
J
ISSN 2052-2525CRYO
j
EM
Received 16 April 2019 Accepted 13 August 2019
Edited by L. A. Passmore, MRC Laboratory of Molecular Biology, UK
‡ These authors contributed equally
We would like to dedicate this article to Professor John Trinick and his pioneering work on the development of time-resolved cryo-EM applications.
Keywords:time-resolved cryo-EM; sample preparation; microscope hardware; structural biology; voltage-assisted spraying.
Supporting information:this article has supporting information at www.iucrj.org
A cryo-EM grid preparation device for
time-resolved structural studies
Dimitrios Kontziampasis,a,b‡ David P. Klebl,a,b‡ Matthew G. Iadanza,c,b Charlotte A. Scarff,c,bFlorian Kopf,d Frank Sobott,c,b,eDiana C. F. Monteiro,d Martin Trebbin,fStephen P. Muencha,b* and Howard D. Whiteg*
a
School of Biomedical Sciences, University of Leeds, Leeds LS2 9JT, UK,bAstbury Centre for Structural and Molecular Biology, University of Leeds, Leeds LS2 9JT, UK,cSchool of Molecular and Cellular Biology, University of Leeds, Leeds LS2 9JT, UK,dThe Hamburg Centre for Ultrafast Imaging, Universita¨t Hamburg, Hamburg, Germany,eDepartment of Chemistry, Biomolecular and Analytical Mass Spectrometry group, University of Antwerp, Antwerp, Belgium, fDepartment of Chemistry,State University of New York at Buffalo, New York, USA, andgDepartment of Physiological
Sciences, Eastern Virginia Medical School, Norfolk, Virginia USA. *Correspondence e-mail: [email protected], [email protected]
Structural biology generally provides static snapshots of protein conformations that can provide information on the functional mechanisms of biological systems. Time-resolved structural biology provides a means to visualize, at near-atomic resolution, the dynamic conformational changes that macromolecules undergo as they function. X-ray free-electron-laser technology has provided a powerful tool to study enzyme mechanisms at atomic resolution, typically in the femtosecond to picosecond timeframe. Complementary to this, recent advances in the resolution obtainable by electron microscopy and the broad range of samples that can be studied make it ideally suited to time-resolved approaches in the microsecond to millisecond timeframe to study large loop and domain motions in biomolecules. Here we describe a cryo-EM grid preparation device that permits rapid mixing, voltage-assisted spraying and vitrification of samples. It is shown that the device produces grids of sufficient ice quality to enable data collection from single grids that results in a sub-4 A˚ reconstruction. Rapid mixing can be achieved by blot-and-spray or mix-and-spray approaches with a delay of10 ms, providing greater temporal resolution than previously reported mix-and-spray approaches.
1. Introduction
complexes on the millisecond timescale (Frank, 2017) and used to determine the structure of multiple conformational states exhibited by numerous macromolecular systems, such as the ribosome and rotary F-ATPase (Ferna´ndez et al., 2013; Zhou et al., 2015). However, it has proven difficult to trap different kinetic sub-states and, although computational sorting can provide different conformations, it does not provide information on the order of catalysis, or the lifetime of the intermediates (Nakaneet al., 2018).
The recent renaissance in cryo-EM has been fuelled by rapid developments in microscopes, direct electron detectors and ever more sophisticated data-processing algorithms, but a current bottleneck still resides within the sample-preparation procedure, which has changed little over the last 30 years. There have been recent advances in grid-production tech-nology such as Spotiton and VitroJet, which show great promise in producing high-quality and consistent ice but they are not currently capable of time-resolved applications (Dandeyet al., 2018; Ravelliet al., 2019).
Time-resolved cryo-EM (TrEM) is an ideal method to study conformational changes occurring on the microsecond to millisecond timescale (Subramaniam & Henderson, 1999; Kaledhonkar et al., 2018), providing snapshots of conforma-tional states at sub-nanometre resolutions that can be put in order to understand mechanisms on a broad range of speci-mens. TrEM experiments have previously been demonstrated using a blot-and-spray approach; applying the protein of interest to an EM grid and pre-blotting before spraying substrate to initiate a reaction, followed by rapid plunging into liquid ethane to vitrify and stop the reaction after a specific time delay. This was demonstrated by the ground-breaking work on the acetylcholine receptor (Unwin, 1995). Through spraying of substrate mixed with a fiducial marker (ferritin) upon a pre-blotted EM grid, and taking account of the diffu-sion edge of the substrate, it was possible to achieve time-resolutions as low as 2 ms for the mixing of acetylcholine with the acetylcholine receptor (Unwin & Fujiyoshi, 2012). This approach can be challenging because of difficulties in getting consistent mixing across an EM grid, and requires high substrate concentrations and fiducial markers. An alternative is the mix-and-spray approach where substrate and protein can be pre-mixed before directly spraying onto a fast-moving EM grid, which is plunged into liquid ethane (Feng et al., 2017). This technique has shown considerable success for studies of ribosome mechanics (Kaledhonkaret al., 2019).
Here we report a significantly improved device which provides greater reproducibility and more detailed char-acterization than previous designs. This is the first apparatus that permits both blotting and spraying of EM grids, as well as rapid mixing, and that takes advantage of the benefits of voltage-assisted spraying (typically 5 kV). The resulting grids are of sufficient quality for sub-4 A˚ resolution structure determination and allow rapid mixing and freezing in the millisecond time frames (>10 ms). These capabilities will allow us to determine different conformational states of protein complexes with a time resolution not accessible through conventional EM-grid preparation methods.
2. Materials and methods
2.1. Sample preparation
Apoferritin from equine spleen was obtained from Sigma– Aldrich (A3660), and dialysed into the target buffer {20 mM
HEPES [4-(2-hydroxyethyl)-1-piperazineethanesulfonic acid], 150 mM NaCl pH 7}. Escherichia coli ribosomes were prepared in 50 mMHEPES pH 7.5, 100 mMKAc (potassium acetate) and 8 mM MgAc2 (magnesium acetate). Porcine ventricular thin filaments were prepared as previously described (Siemankowski & White, 1984) and diluted to 10mM in 10 mM MOPS [3-(N-morpholino)propanesulfonic acid] pH 7, 50 mMKAc, 3 mMMgCl2and 1 mMEGTA prior to use. G-actin used for the blot/spray experiment was poly-merized according to a protocol by Professor Peter Knight (personal communication). For the blotting/spraying experi-ment, 30mM apoferritin (24-mer) was sprayed onto a grid which was pre-blotted with 2mMF-actin (3ml, 4 s blot time). For the mixing/spraying experiment with apoferritin and thin filaments, 30mM apoferritin and 10mM thin filaments were used and mixed in a 1:1 ratio. For the actomyosin dissociation experiment, a solution of 20mM thin filaments with 24mM
myosin Va(1IQ)S1 in 10 mMMOPS pH 7, 50 mMKAc, 3 mM
MgCl2and 1 mMEGTA was rapidly mixed (1:1) with buffer containing 0, 0.016, 0.16 or 1.6 mM ATP (making final ATP concentrations of 0, 8, 80 and 800mM, respectively).
2.2. Grid preparation
through the spray. A pressure of 0.5–2.5 bar was applied to the piston causing the grid to accelerate and reach the spray in less than 0.1 s (distance: 4 cm). The grid passed through the spray, accelerated further over the remaining 3 cm to the ethane surface and terminated by a mechanical stop leaving the grid 1 cm below the surface of the liquid ethane.
The grid was then transferred into liquid N2and stored until screening. For the mix/spray technique, two syringes were used, one with each reactant, and the flow rate was reduced accordingly to 4.2ml s1for each syringe, resulting in the same overall flow rate. For the blot-and-spray technique, 3ml of the first protein sample was placed onto the grid, which was subsequently blotted with two strips of Whatman 43 filter paper for 4 s. After blotting, the blotter was retracted and the grid plunged through the spray (which had been initiated during the blotting step to ensure stabilization) into the liquid ethane. Upon completion of all the experiments the syringes and tubing were washed with buffer and water.
2.3. Data collection and processing
All cryo-EM imaging was done on an FEI Titan Krios microscope equipped with a Falcon III direct electron detector operating in integrating mode (Astbury BioStructure Laboratory). The main data acquisition and processing para-meters are listed in Table S1 in the Supporting information. All processing was done using RELION2.1 (Kimaniuset al., 2016) andRELION3 beta (Zivanovet al., 2018). For all three datasets, the processing was done as follows: micrographs were motion corrected with the RELION3 implementation of
MotionCor2(Zhenget al., 2017) and then the contrast transfer function (CTF) for each micrograph was estimated usingGctf
(Zhang, 2016). For apoferritin and ribosome, references for automated particle picking were generated from class averages obtained from a small number of manually selected particles. The results of the template-based automated picking were manually inspected. Then, 2D classification was used to select particles with high-resolution information, which were taken forward to generate an initial 3D reconstruction. After two rounds of CTF refinement and Bayesian particle polishing the final reconstruction was obtained. The presented struc-tures were filtered by local resolution.
For the ribosome dataset, 3D classification with six classes was used to sort out 50S subunits reducing the particle number from 47 866 to 34 010. For the thin-filament dataset, the
RELIONtools for helical processing were employed (He & Scheres, 2017). All filaments were manually picked. As an initial model, either a 60 A˚ low-pass filtered structure of actin (PDB entry 5mvy; Paulet al., 2017) or a featureless cylinder were used. Both gave nearly identical results with the low-pass filtered PDB model leading to slightly higher resolution. CTF refinement was not found to be beneficial in this case. The final reconstruction was subjected to 3D classification with eight classes to extract a tropomyosin-containing structure (9 496 particles) which after 3D refinement had a resolution of 10.4 A˚ . Helical symmetry for both structures was applied using the refined values for twist and rise with the relion_helix
_toolbox program. Fourier shell correlation was determined by the two half-map gold-standard method for which curves are shown in Fig. S1 in the Supporting information.
2.4. Mixer design
The mixer/sprayer was constructed from standard high-performance liquid chromatography fittings and tubing, and the air tip from a 10ml Gilson pipette tip (Fig. S2). The spray tip [Fig. S2(a)] was constructed from a 2–3 mm length of 150/ 40mm polyimide-coated quartz tubing (Molex) glued into 360/ 180mm tubing with polyacrylate glue. The 360 tubing was sealed into 1/1600 outer diameter (OD) fluorinated ethylene propylene (FEP) tubing (Upchurch) with a 0.01500 inner diameter (ID). The spray tip was positioned 0–0.5 mm past the end of the air tip. Connection to the high voltage was via a short piece of 0.00700platinum wire used to make contact with the solution via a ‘T’ connector with 1/1600OD, 0.0100ID FEP tubing. The voltage of the high-voltage supply could be varied from 2 to 10 kV by varying the input from a low-voltage DC power supply (Celex BPS1510) to an EMCO Q101N-5 high-voltage converter. The high high-voltage was measured from the voltage across the 100 K section of a 100 M–100 K
voltage-divider circuit using a digital voltmeter (Radio Shack). The valves and pistons of the syringe pumps and forceps holding the EM grid were all grounded to prevent possible damage from stray high voltage.
For the mixing units [Fig. S2(b)], two concentric tubes (360/200mm and 165/100mm) (Molex) were used so that mixing of the two solutions would not occur until just prior to spraying. FEP tubing (0.00700 ID 1/1600 OD) was used to seal the inner 165mm capillary. The interior tubing was positioned 100–200mm from the beginning of the spray tip to minimize the dead time. The mixer’s geometry approximates that of a double back-to-back ‘T’ mixer.
3. Results
3.1. Optimization of the setup
and ensure that the micro-droplet spray does not evaporate en-route to the EM grid. The system is operated through computer-controlled syringe drivers (Kloehn 50300 series) that control the timing of and flow of the spraying, and additionally provide software control of sample blotting and
plunging. The basic design has been described in detail in a previous review (Kaledhonkaret al., 2018).
[image:4.610.54.565.71.244.2]As in the case of traditional blotting, plasma treatment of the grid’s surface is an essential step in reducing the inherent hydrophobicity of the carbon coated grids; otherwise very few,
Figure 1
Current setup of the TrEM apparatus. (a) Overview of the complete apparatus showing the Styrofoam freezing cup which houses the liquid ethane (I), syringe pumps (II), high-tension voltage module (III), computer controller (IV), forceps on plunger (V), blotting arms (VI) and sprayer (VII). (b) Zoomed-in view of the spray chamber showing the spray nozzle (VIII), blotting arms (VI), forceps with grid (IX), ethane cup within the Styrofoam liquid nitrogen holder (X), and a port that opens just prior to the grid plunge and limits the exposure of the liquid ethane to the humid air in the chamber (XI).
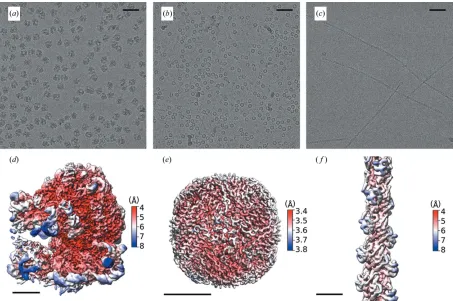
Figure 2
Structures of the three model systems from grids prepared on the TrEM setup. To test our ability to make high-quality EM grids by spraying proteins on a fast-moving plunging grid, three samples were tested and data are shown with representative micrographs and 3D reconstructions: (a,d)E. coliribosome (0.72mMin 50 mMHEPES pH 7.5, 100 mMKAc, 8 mMMgAc2), (b,e) apoferritin [30mM(24-mer) in 20 mMHEPES pH 7.5, 150 mMNaCl], and (c,f)
porcine thin filaments [5mM(actin monomer) in 10 mMMOPS pH 7, 50 mMKAc, 3 mMMgCl2, 1 mMEGTA]. The scale bars in (a), (b) and (c)
[image:4.610.79.532.392.693.2]if any, droplets adhere to the grid. In addition to the time of mixing, the plunge speed of the grid was used to alter the delay time and time resolution of the experiments. In our apparatus, we use dual chamber air pistons (Fig. 1) to blot the grids (VI), accelerate the grid into the liquid ethane (I), and open and close the port opening (XI). To better define the parameters and speeds at which grids could be plunged, a range of air pressures (0.5–2.5 bar) were used, producing plunge velocities between 1 and 3 m s1 (see Movie S1 in the Supporting information).
We initially investigated the ability of the TrEM set-up to produce grids with ice of sufficient quality and to collect cryo-EM data capable of generating high-resolution structures. Three different model systems (apoferritin, ribosome, and thin filaments) were used to investigate the ability to spray protein samples onto a fast-moving glow-discharged EM grid. Data for each system were collected from single grids, using a Falcon 3
detector running in integrating mode on an overnight run (12 h). From overview images, we observed 20–50% of the grids’ surface area covered with droplets. Although many droplets produced ice too thick for data collection, the grids showed many areas of ice that were suitable for imaging and subsequent high-resolution structure determination (Fig. S3). For each sample, this resulted in 1 800 holes with suitable ice for imaging with the ability to take multiple exposures per hole permitting a maximum of 6 000 micro-graphs per grid (see Table S2). For apoferritin, a total of 1 772 micrographs were collected, with the resulting reconstruction producing a global resolution of 3.6 A˚ [Figs. 2(a) and 2(b)]. For the E. coli ribosome, 1 494 micro-graphs were collected, with 34 010 particles contributing to a final reconstruction that had a global resolution of 4.3 A˚ [Figs. 2(c) and 2(d)] and showed a wide sampling of angular orientations [Fig. S1(c)]. Porcine cardiac thin filaments were studied to investigate the applicability of the apparatus on long thin filamentous particles. The resulting grids showed good distribution of the specimen within the holes, with no signs of damage in terms of filament length [Fig. 2(c)]. The resulting reconstruction of the actin core of the thin filaments was resolved to 5.6 A˚ with the entire thin filament having a lower reso-lution [10.4 A˚ , Fig. S1(b)] because of the heterogeneity of the attached tropomyosin. Of the micrographs collected a significant number went into the final reconstruction, demonstrating the consistency in the ice with 86%, 97% and 100% of the collected micrographs containing particles that went into the final reconstruction of the apoferritin, ribosome and F-actin, respectively [Fig. S4(a)]. Tomographic analysis of the ice shows that it varies between 80 and 125 nm, which is thicker than ideal and limits the resolution of the data. Moreover, Thon ring analysis of all collected micrographs shows the main peak lies between 3 and 5 A˚ [Fig. S4(b)]. Since the resolution of the apoferritin dataset is not particle-number limited (>800 000 asymmetric units), ice thickness is the main determinant of resolution and we conclude that thinner ice will be required to obtain >3.5 A˚ . However, it should be noted that the ability to rapidly mix and spray even at resolutions <3.5 A˚ can provide new insights into protein mechanism and cycling.
3.2. Estimation of plunging and droplet speed
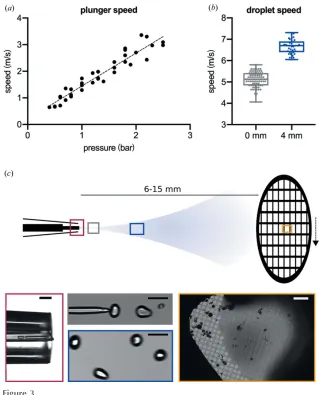
[image:5.610.43.362.71.466.2]In a mix-and-spray type of experiment, the total amount of time that the mixed substrates interact can be calculated if we know the speed of the plunger arm, the distance travelled and
Figure 3
Measuring plunger and droplet speeds. (a) The relationship between pressure and plunger speed, linear fit: speed (m s1) =1.5pressure (bar). (b) A boxplot of droplet speeds with
the speed of the droplets after leaving the mixer/sprayer. The speed of the pneumatic plunging arm was determined using a linear potentiometer. Although, it should be noted that the plunger continuously accelerates as the grid moves towards the ethane container but reaches near maximal velocity at the point of the spray. Therefore, the measurement is a single measure of velocity at the position of the spraying nozzle and it will only slightly underestimate the overall plunging speed. With a constant distance of 3 cm between the central point of the spray cone and the ethane surface, we calculate a time between 30 and 10 ms (for a pressure range of 0.5–2.5 bar) for the grid to reach the ethane once the sample has been applied [Fig. 3(a)]. Droplet speeds were calculated based on high-speed video recordings of sprayed droplets at the tip of the nozzle, as well as at a distance of 4 mm from the nozzle [green/ blue square in Fig. 3(b)]. Both yield droplet speeds of greater
than 4 m s1[Fig. 3(c)]. We also observed acceleration of the droplets as they moved away from the sprayer. With a tip/grid distance of 6–15 mm, this equates to a time of flight of4 ms for the slowest droplets and the longest distance. Higher plunge speeds result in fewer droplets adhering to the grid, with the shortest possible delay on the current setup equating to11 ms from the time the droplet leaves the spray nozzle to it being vitrified on the grid (with a typical drop speed of 6 m s1, a sprayer-to-grid distance of 6 mm and a spray-to-ethane distance of 3 cm). Analysis of the droplets on the high-speed videos shows an approximate diameter of 75mm [Fig. 3(c)]. This is considerably larger than previously reported (1mm), which used electrospray (White et al., 2003) rather than voltage-assisted spraying, but produces ice suitable for high-resolution data collection.
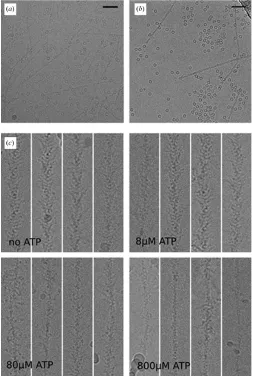
[image:6.610.45.298.72.448.2]In order to examine the applicability of the new apparatus for the preparation of time-resolved samples, we validated the mixing capability using several different approaches. The first was to conventionally blot the grid containing the first protein and subsequently pass the blotted grid through a voltage-assisted spray containing the second protein (Movie S2). By removing the dead time associated with the mixing chamber and the in-flight time of the droplets, the time delay between protein deposition on the grid and freezing is10 ms, and is dependent only on the distance between the sprayer and the liquid ethane (3 cm), and the plunge speed (3 m s1). Actin filaments were pre-blotted on the grid (blot time 4 s) and then passed through a voltage-assisted spray of apoferritin. Good quality and clear co-localization could be detected for the samples [Fig. 4(a)]. The second approach was to mix apo-ferritin and thin filaments within the capillary tube just prior to voltage-assisted spraying with the resulting ice showing clear mixing of both samples in all areas studied [Movie S3 and Fig. 4(b)]. The added delay time, resulting from the additional volume prior to spraying is 1–2 ms, and the time of flight from the spray trip to the grid was measured to be less than 4 ms resulting in an overall time delay of15 ms. Although both of these approaches provided promising results and showed clear co-localization, the next step was to provide clear evidence of mixing. To achieve this, we rapidly mixed and vitrified two samples by mixing actomyosin-S1 with varying concentrations of MgATP, which dissociates the myosin-S1 from the actin with a second-order rate constant of 106M1s1 (Sieman-kowski & White, 1984). The extent of dissociation of S1 from actin after15 ms of mixing of 0, 8, 80 and 800mMMgATP is predicted to be 0, 10, 70 and >99%, respectively. By main-taining the plunger speed in a way that the TrEM setup was working with an15 ms delay, the resulting filament decora-tion seen in the microscope was consistent with that expected, demonstrating that the two solutions were mixed for15 ms, prior to freezing [Fig. 4(c)]. Investigations are currently ongoing to determine the degree of mixing within the chamber, with provisional modelling suggesting most of the mixing may occur within the droplets in-flight. With the increased time of mixing and time of flight for the sample, the approximate resulting time resolution of this approach is in the range of 10–15 ms. Using refined microfluidic mixers, it
Figure 4
may be possible to achieve more complete mixing before spraying the mixed sample.
4. Discussion
Electron microscopy has seen significant developments over the last ten years with numerous high-resolution structures of previously intractable protein systems. However, despite the first reported TrEM experiment being conducted in 1994 by the pioneering work of Nigel Unwin, progress has been slow (Berriman & Unwin, 1994). With the recent developments in cryo-EM hardware and software, developing a reliable TrEM setup is becoming a reality. In this work, we reported a system which can produce cryo-EM grids with a minimum time delay between mixing and freezing of 10 ms, faster than the previously reported fastest speed of 24 ms for a mix-and-spray device (Fuet al., 2019). Through three model systems we have shown the capability of producing high-quality EM data at a resolution sufficient for resolving side-chain density. By using either a blot-and-spray or a direct mixing and spraying approach we can produce grids that display clear mixing of the samples, as demonstrated by the dissociation of myosin-S1 from the actin filaments.
Recent studies have suggested that rapid vitrification of grids can minimize the interactions with the air–water inter-face, which is detrimental to the biological sample (Noble et al., 2018; D’Imprimaet al., 2019). The methodology reported here is capable of vitrifying grids rapidly and reproducibly, which may alleviate some of the problems associated with interactions at the air–water interface, as well as other problems in conventional blotting systems (Glaeser et al., 2016; Glaeser, 2018). Ribosome data collected from sprayed grids suggest a broad distribution of views [Fig. S1(c)]. This is consistent with the particles making fewer interactions with the air–water interface; however, a full systematic study of this is beyond the scope of this work.
The grid preparation procedure is still a significant bottle-neck in cryo-EM and has plenty of room for improvement both in terms of reproducibility and in the development of TrEM applications. A number of new approaches have emerged which aim to produce more consistent and repro-ducible high-quality ice, for example Spotiton and VitroJet systems (Dandey et al., 2018; Ravelli et al., 2019). Here we report a system that addresses a different problem, that of the rapid mixing and trapping of different conformational states to produce cryo-EM grids sufficient for high-resolution EM structure determination. By using a voltage-assisted spray and a rapid mixing unit we can directly spray onto rapidly plunging EM grids or mix and freeze grids with an10 ms time delay. This integrated apparatus may allow us to open up new opportunities in understanding the mechanisms of different protein systems.
Acknowledgements
E. coli ribosomes were kindly provided by Professor Neil Ranson and Mr David Nicholson, and G-actin was kindly
provided by Professor Michelle Peckham. This work has been supported by the excellence cluster ‘The Hamburg Centre for Ultrafast Imaging – Structure, Dynamics and Control of Matter at the Atomic Scale’ of the Deutsche Forschungs-gemeinschaft (CUI, DFG-EXC1074) and by the Federal Ministry of Education and Research (BMBF, 05K16GU1).
Funding information
All EM data were collected at the Astbury Biostructure funded by the University of Leeds and the Wellcome Trust (108466/Z/15/Z; grant No. 204825/Z/16/Z to CAS), and we thank the support scientists for their help in data setup. This work was funded by a Biotechnology and Biological Sciences Research Council (BBSRC) grant to SPM (BB/P026397/1), and supported by research grants to HDW from the American Heart Association and to HDW and Vitold Galkin from the US National Institutes of Health (NIHR21AR-071675). This work was also funded by the Medical Research Council (grant No. MR/P018491/1).
References
Berriman, J. & Unwin, N. (1994).Ultramicroscopy,56, 241–252. Blundell, T. L. (2017).IUCrJ,4, 308–321.
Dandey, V. P., Wei, H., Zhang, Z., Tan, Y. Z., Acharya, P., Eng, E. T., Rice, W. J., Kahn, P. A., Potter, C. S. & Carragher, B. (2018).J. Struct. Biol.202, 161–169.
D’Imprima, E., Floris, D., Joppe, M., Sa´nchez, R., Grininger, M. & Ku¨hlbrandt, W. (2019).eLife,8, e42747.
Feng, X., Fu, Z., Kaledhonkar, S., Jia, Y., Shah, B., Jin, A., Liu, Z., Sun, M., Chen, B., Grassucci, R. A., Ren, Y., Jiang, H., Frank, J. & Lin, Q. (2017).Structure,25, 663–670.e3.
Ferna´ndez, I. S., Bai, X. C., Hussain, T., Kelley, A. C., Lorsch, J. R., Ramakrishnan, V. & Scheres, S. H. W. (2013).Science,342, 1240585. Frank, J. (2017).J. Struct. Biol.200, 303–306.
Fu, Z., Indrisiunaite, G., Kaledhonkar, S., Shah, B., Sun, M., Chen, B., Grassucci, R. A., Ehrenberg, M. & Frank, J. (2019).bioRxiv, http:// doi.org/10.1101/470047.
Glaeser, R. M. (2018).Curr. Opin. Colloid Interface Sci.34, 1–8. Glaeser, R. M., Han, B. G., Csencsits, R., Killilea, A., Pulk, A. & Cate,
J. H. (2016).Biophys. J.110, 749–755.
He, S. & Scheres, S. H. (2017).J. Struct. Biol.198, 163–176. Jadhav, A., Wang, L. J., Lawrence, C. & Padhye, R. (2011). Adv.
Mater. Res.332–334, 710–715.
Kaledhonkar, S., Fu, Z., Caban, K., Li, W., Chen, B., Sun, M., Gonzalez Jr, R. L. & Frank, J. (2019).Nature,570, 400–404. Kaledhonkar, S., Fu, Z., White, H. & Frank, J. (2018). Protein
Complex Assembly: Methods and Protocols,Methods in Molecular Biology, Vol. 1764, edited by J. Marsh, pp. 59–71. New York: Humana Press.
Kimanius, D., Forsberg, B. O., Scheres, S. H. & Lindahl, E. (2016).
eLife,5, e18722.
Nakane, T., Kimanius, D., Lindahl, E. & Scheres, S. H. (2018).eLife,7, e36861.
Noble, A. J., Wei, H., Dandey, V. P., Zhang, Z., Tan, Y. Z., Potter, C. S. & Carragher, B. (2018).Nat. Methods,15, 793–795.
Paul, D. M., Squire, J. M. & Morris, E. P. (2017),J. Struct. Biol.197, 365–371.
Ravelli, R. B. G., Nijpels, F. J. T., Henderikx, R. J. M., Weissenberger, G., Thewessem, S., Gijsbers, A., Beulen, B. W. A. M. M., Lo´pez-Iglesias, C. & Peters, P. J. (2019).bioRxiv, https://doi.org/10.1101/ 651208.
Smith, T. J. & Rubinstein, J. L. (2014).Science,345, 617–619. Stagno, J. R., Liu, Y., Bhandari, Y. R., Conrad, C. E., Panja, S., Swain,
M., Fan, L., Nelson, G., Li, C., Wendel, D. R., White, T. A., Coe, J. D., Wiedorn, M. O., Knoska, J., Oberthuer, D., Tuckey, R. A., Yu, P., Dyba, M., Tarasov, S. G., Weierstall, U., Grant, T. D., Schwieters, C. D., Zhang, J., Ferre´-D’Amare´, A. R., Fromme, P., Draper, D. E., Liang, M., Hunter, M. S., Boutet, S., Tan, K., Zuo, X., Ji, X., Barty, A., Zatsepin, N. A., Chapman, H. N., Spence, J. C. H., Woodson, S. A. & Wang, Y. (2017).Nature,541, 242–246.
Subramaniam, S. & Henderson, R. (1999).J. Struct. Biol.128, 19–25. Suga, M., Akita, F., Sugahara, M., Kubo, M., Nakajima, Y., Nakane, T., Yamashita, K., Umena, Y., Nakabayashi, M., Yamane, T., Nakano, T., Suzuki, M., Masuda, T., Inoue, S., Kimura, T., Nomura, T., Yonekura, S., Yu, L. J., Sakamoto, T., Motomura, T., Chen, J. H., Kato, Y., Noguchi, T., Tono, K., Joti, Y., Kameshima, T., Hatsui, T.,
Nango, E., Tanaka, R., Naitow, H., Matsuura, Y., Yamashita, A., Yamamoto, M., Nureki, O., Yabashi, M., Ishikawa, T., Iwata, S. & Shen, J. R. (2017).Nature,543, 131–135.
Unwin, N. (1995).Nature,373, 37–43.
Unwin, N. & Fujiyoshi, Y. (2012).J. Mol. Biol.422, 617–634. White, H. D., Thirumurugan, K., Walker, M. L. & Trinick, J. (2003).J.
Struct. Biol.144, 246–252.
Zhang, K. (2016).J. Struct. Biol.193, 1–12.
Zheng, S. Q., Palovcak, E., Armache, J. P., Verba, K. A., Cheng, Y. & Agard, D. A. (2017).Nat. Methods,14, 331–332.
Zhou, A., Rohou, A., Schep, D. G., Bason, J. V., Montgomery, M. G., Walker, J. E., Grigorieff, N. & Rubinstein, J. L. (2015).eLife,4, e10180.