A~ncu
tura Siruation
an~ ~ros~ects
int~e
Central aOO Eastern
turo~ean
Countries
.·. · .. ·.· ·.· .. ·.··•·· Estonia .. ·
.
. :. .·. . . . .' . .
:: ·::
. : .. :...
. . . . ·. . . '.:.·: .. -: ·,. . . . . '. . . ' . . ' . ' ' .
- . . .
. . . . ' . . . . . . . ~ . ~ . . .
' · .. · . . . · - ·.· .. _ ' . .
· · · · ·
· . · ·.
>><<>y·::Finland
:::::::::-:<::.::
J-:-:-:-:-: :-:-:""'
--.
~ . . . . . ' .. . ~ . . . . .
' '
. . . . . . . . . . .. ' . ' . . . . . y.. . . . ' . . . . ' . '
. . . . . '. <:: <:: ~: :: :.· .. -: ·.·
. . . ~ . . . . . ~ . . . ~ . ~ . . . . . . . . ' . . . '
' .. ' . . . . ' . . .. '
~. . . ' '. ~ .. ' ~ .
. ~ . . ' .
. . . . .
• • * • •
. . . . .. .
. . . . .
~ . ~ . .
... . . . . ~ .
II
European Commission
Directorate General for Agriculture (DG VI)
Working Document
Agricultural Situation and Prospects
in the Central and Eastern European Countries
ESTONIA
II
This Document has been prepared by DG VI in collaboration with Mr. Ants Laansalu, Estonian Ministry of Agriculture and with the assistance of Dr. Christian Bose, ASA Institute for Agricultural Sector Analysis Bonn.
The manuscript has been prepared by Martin Strittmatter, with the assistance of Steve Darling. The authors accept full responsability for any errors, which could still remain in the text.
Table of Contents
Page
Foreword
0
Executive Summary
1
General ovennew
1.1 Geography and Climate 1
1.2 Population 1
1.2. 1 Ethnic Structure 2
1.3 Education 2
1.4 Infrastructure 3
1.4.1 Transport 3
1.4.2 Energy .., .)
1.4.3 Health .., .)
1.5 Political situation 4
1.6 Economic situation 5
1.6.1 General Situation 5
1.6.2 Employment 5
1.6.3 Industry 5
1.6.4 Foreign Trade 6
1.6.5 Monetary Questions 7
2
Agricultural Economy
2.1 Land Use 8
2.2 Importance in the Economy 8
2.3 Food Consumption 9
2.4 Farm Structure 10
2.5 Privatisation 12
2.6 Arable Crops 13
2.6. 1 Cereals 13
2.6.2 Fodder Crops 15
2.6.3 Potatoes 15
2.6.4 Fresh Vegetables 16
2.6.5 Permanent Crops 16
2.7 Livestock sector 17
2.7.1 Milk and Dairy 18
2.7.2 Beef 19
2.7.3 Pork 21
2.8 Forestry 22
2.9 Fishery 23
2.10 Production costs 23
3
Upstream and doWDStream Industry
3.1 Upstream Industry 25
3.2 Downstream Industry 26
4
Agricultural PoHey
4.1 Price Policy 27
4.2 Border Protection 27
4.3 Direct Support 27
4.4 Farm Credits 28
4.5 Taxation 28
5
Trade
5.1 General Situation 29
5 .1.1 Important Trading Partners 30
5.1.2 Main Export Commodities 30
5.1.3 Main Import Commodities 31
5.2 Trade Policy 31
5.3 Trade Agreement with the EU 32
6
Perspectives, Evolution, Conflicts and Problems
6.1 Development of the macro-economic Situation 33
6.2 General Perspectives for Agriculture 34
6.3 Impact of Agricultural Policy Measures 35 4.4 Possible Development for the main Commodities 36
until the Year 2000
6.4.1 Cereals 36
6.4.2 Other Crops 37
6.4.3 Milk and dairy 37
6.4.4 Beef meat 38
6.4.5 Pork 39
Bib I iogra p hy
ANNEXES
Annex 1 Annex 2 Annex 3 Annex 4 Annex 5
PHARE Programme in Estonia
Price comparison between the Baltic states Production cost estimates
Balance sheets for main commodities Europe agreement
41
42
45 48
50
List of Tables
Table 0.1 Projections for main Commodities
Table 1 Estonia in Comparison with other CEECs and the EU Table 1.1 Macro Economic Indicators for Estonia
Table 2.1 Annual per capita consumption of food Table 2.2 Structure of family farms January 1995 Table 2.3 Summary table cereal production in Estonia Table 2.4 Potato production
Table 2.5 Vegetable production Table 2.6 Fruit and berries
Table 2.7 Production of milk and dairy products Table 2.8 Bee meat production
Table 2.9 Pork production
Table 2.10 Poultry meat production Table 2.11 Production of wood Table 2.12 Prices for inputs
Table 5.1 Importance of agricultural trade Table 5.2 Main trade commodities
Table 5.3 Main concessions of the Europe agreement
Table 6.1 Projections for Cereals
Table 6.2 Projections for milk production Table 6.3 Projections for beef meat production Table 6.4 Projections for pig meat production Table 6.5 Projections for poultry meat production
List of Figures
Figure 1 Figure 2 Figure 3 Figure 4 Figure 5
Land Use in Estonia Ethnic structure of Estonia Agricultural Land Use Farm Structure
Cereal Production in Estonia
Foreword
The European Union has expressed its intention to offer membership to those countries in central and eastern Europe with which it has an association agreement (see box below). Agriculture has been identified as an important issue for future accession, due to its relative size in some of the Central and Eastern European Countries (CEECs) and to the difficulties there might be in extending the Common Agricultural Policy in its current form to these countries.
A series of ten country reports on the agricultural situation and prospects in the CEECs has been prepared by the services of the European Commission in collaboration with national experts and with the help of scientific advisers. The ten countries covered are Bulgaria, the Czech Republic, Hungary, Poland, Romania and Slovakia, which are associated to the European Union through the Europe Agreements, and Estonia, Latvia, Lithuania and Slovenia, which are in the process of being associated.
The country reports attempt to provide an objective analysis of the current situation in agriculture and the agro-food sector in the CEECs and an assessment of the developments to be expected in the medium term.
Extract conclusions Copenhagen summit of 22-23 June 1993
About the data ....
The data used in this country report are derived from a CEEC dataset established by DG VI in cooperation with other services of the European
Commission and with external experts. Data have been selected after a number of analyses carried out by both external research institutes1 and DG VI services. They originate from various sources: FAO, OECD, World Bank, United Nations, USDA, national statistics, economic institutes and the European Commission (DG II, Eurostat).
The main objective was to obtain a dataset which was as coherent as possible, offering a good comparability of data.
For the agricultural data, the starting point of the analysis was the work carried out by Prof. Jackson (Institute for Central and East European Studies, Katholieke Universiteit Leuven, Belgium}, who compared figures from OECD, FAO and the national statistics of Poland, Hungary, the Czech Republic,Siovakia, Bulgaria and Romania. The conclusion of this study was that the FAO was the most reliable source because these data were standardized, which was not the case for the two other sources.
Moreover, DG VI services compared FAO and USDA data and although for the crop sector there were no important differences, this was not the case for the animal sector where big discrepancies were apparent. This is due to different methodological approaches and also to different coefficients used to transform live animal weight in carcass weight.
In general the FAO data for agriculture were used, but for certain countries and/or for certain products, and in particular for the most recent years, the figures were adjusted or replaced by data from other sources, after discussion with country specialists and with FAO statisticians. In such cases, FAO coefficients and standards were used to avoid a break in the time series.
Despite all efforts to create a coherent, reliable and up to date dataset, all figures presented in this report should be interpreted with care. Significant changes in data collection and processing methods have sometimes led to major breaks in historical series as the countries concerned have moved from centrally planned to market economies. One general impression is, according to some experts 1·2, that
these problems may have led to overestimate the decline in economic activity in general and of agricultural production in particular in the first years of transition, data from 1989 and before being somewhat inflated and data after 1989 underrecording the increase in private sector activity.
1
-M. JACKSON and J. SWlNNEN (1995): A statistical analysis and survey of the current situation of
agriculture in the Central and Eastern European Countries, report to OG I, European Commission. - W.J. STEINLE (1994) : First Study on Data Collection on "Visegrad" Countries and ECO Countries, Empirica Oelasasse, Eurostat.
2 S. TANGERMANN and T. JOSLING (1994): Pre-accession agricultural policies for central Europe and
Executive Summary
General Overview
With a total surface of 45.000 km2 and a population of 1.5 million inhabitants, Estonia is the
smallest of the Baltic countries. Forests cover 43% of the land surface, whereas agriculture is practised on only 30o/o. 55% of the population live in cities, the remainder in rural areas.
Due to emigration and a decreasing birth rate the population shows some decline. Ethnic minorities, particularly Russians, are important. They account for nearly 40% of the population. This is a source of constant tension between Estonia and Russia.
Following independence, Estonia followed a very liberal economic course and has abolished all border protection, agricultural commodities included. All sectors of the economy have since contracted, but signs of recovery began in 1994. The service sector- mainly
transport-is of increasing importance, whereas the industrial and agricultural sectors are losing importance.
Following elections in J\1arch 1995 a new government came to power, and has continued the reform course placing stronger emphasis on social aspects.
The most important sectors of Estonian industry are processing, particularly food processing. Whilst in some sectors industrial output began to increase in 1994, food processing still showed a declining tendency and continues to face serious problems of restructuring. Apart from the food processing industry, the privatisation process is ho\vever well advanced.
Forests cover more than 40% of Estonian territory and its potential is not fully utilised. It can therefore be assumed that the wood processing industry will have rather good perspectives for the future.
Before independence, trade was primarily conducted with the Soviet Union and the whole structure of the economy vvas designed to strengthen the interdependence between the Republics. In recent years trade has been reoriented towards Western countries, particularly to the EU. Re-exports of Russian petrol and metals have an important share of total trade.
The national currency, the Estonian crown, was introduced in June I 992. It is pegged to the German DM at a ratio of EEK 8: 01\11. This ratio has been kept stable in spite of significant inflation. The budget ran a surplus of some 2% in 1994. Agricultural expenditure accounted for 3.4% of the national budget.
Situation of Agriculture
production of feed grain \vas insufficient, so that large amounts had to be imported from other Soviet Republics.
Agriculture's share of GDP used to be around 20% before independence, but has declined drastically in recent years. Employment in agriculture has equally contracted, but those working small household plots are not included in the figure of agricultural employment.
The consumption of meat and dairy products used to be rather high in relation to income but dropped as a consequence of reducing purchasing power. Consumption of cheaper products like potatoes and cereals has however remained at a high level or even increased. Interestingly, pig meat is the most preferred meat despite its higher price compared to beef, which is partly due to the low quality of the latter.
Structure and Privatisation
Farm structure during the Soviet era was characterised by large kolkhoses (state farms) and sowkhoses (collective farms), each typically having some 3500 ha and 300 employees. Following independence, the kolkhoses were privati sed and transformed into legal enterprises and the land was restituted to former owners and their heirs.
The transformation process has led to three different types of farms: firstly transformed cooperative farms, which still manage around 40°/o of agricultural land. Secondly private family farms, which account for 17o/o of the land and have an average size of about 23 ha and thirdly the household plots, consisting of part time farms with an average size of less than 2 hectares and \vhich are to some extent still dependent on the cooperative farms. The restructuring process is not yet complete. Legal titles to the land remain unsettled in many cases, which can be seen as a major blocking factor for the restructuring process.
Farm Production
The area planted to cereals has dropped from around 400.000 ha to some 320.000 ha in 1994. Barley accounts for t'.vo-thirds of the surface. Yields for cereals are currently not more than 2.4t/ha on average but sho\v much fluctuation due to climatic variation. Yields did however decline significantly after independence due to reduced utilisation of fertilizers and plant protection products, but also due to severe droughts in 1992 and in 1994.
Due to the destocking in the livestock sector, consumption of cereals for animal feed declined more than production, resulting in a reduction of feed cereal imports, which became more expensive after independence. Production of wheat and rye for human consumption increased, which corresponded to an increased per capita consumption of cereals. Nevertheless cereal consumption still easily exceeds current production.
An important part of the agricultural area is planted with fodder crops for the livestock sector. In 1994 around 560.000 ha \Vere sown mainly with perennial grasses.
plots. The area planted to potatoes has remained relatively stable over recent years. Production for processing and export does not play a major role in Estonian agriculture.
The livestock sector used to be the predominant sector of Estonian agriculture with a considerable export potential. Large amounts of milk products and meat were exported, mainly to Moscow and St. Petersburgh. After independence prices for imported feed and other inputs increased whereas prices for milk and meat did not increase to the same extent. Export markets were lost and in addition, purchasing power and therefore domestic demand declined. As a consequence livestock numbers and production contracted dramatically. This downwards trend bottomed out in 1994 and for 1995 a small increase can be expected. The poor condition of the processing industry and the large over-capacities are major obstacles for an improvement of the livestock sector.
Milk production declined from an annual production of 1.2 million tons in 1990 to only 772.000 in 1994. The major part of milk production is still concentrated in large scale farms. Producer prices for milk increased in 1994 so that milk production could become profitable once agatn.
Beef is to a certain extent a by product of milk production, specialised meat producing breeds are not common in Estonia. Domestic production sti11 exceeds the consumption. Prices for beef meat are on average lower than those for pork but increased in 1994.
Pork production dropped tremendously after independence and consumption exceeds the domestic production, so that Estonia started to import pig meat, mainly from the EU. The low protein content of feed, leads to high conversion rates, which affects the profitability of pork production.
Production costs are characterised on the one hand by low costs for labour and mechanisation but on the other hand by low labour efficiency, v-lhich limits any possible competitive advantage. In the arable sector achievable yields are limited by the climate and by a relatively lo\v soil quality.
In the livestock sector feed costs, which are relatively high compared to meat prices are the principle influence on production costs. Due to the low protein content in the feed mixture, conversion rates are high, reducing the possible advantage of cheaper feed.
Existing farm gate price levels mean that agricultural production is hardly profitable and does not in any case allow sufficient margin to enable the necessary investments to be made.
The processing Industry
increasing costs of production. Inadequate capital and tremendous indebtedness add to the problem.
Agricultural Policy
Border protection for the agricultural sector practicaJiy does not exist and support measures for agriculture are rather limited. The "farmers parity income act" acknowledges in principle that farm incomes should be the same as incomes in other sectors, but the agricultural budget does not foresee the necessary payments to the farmers for this to be realised. The most important support towards agriculture is a credit programme which provides farmers \Vith short-term credits at preferential interest rates. Recently long term credits have also for investments have been included in the programme.
Agricultural Trade
Trade plays an important role for Estonian agriculture, but trade figures vary between sources and are not completely reliable. In the soviet period Estonia used to be a net exporter of agricultural commodities, but in recent years, exports declined, \vhile imports of food products increased. The main commodities for export have been fish, dairy products and meat, but export volumes contracted significantly after independence. The main market for Estonian exports remains the FSU, which accounted for the bulk of all agricultural exports in 1994. On the import side the EU and EFT A countries have become the main suppliers in recent years. The most important import commodities are cereals, fruit and vegetables and sugar.
Outlook
Over the next five years it can be expected that the livestock sector will recover but only at a slow pace. Consumption of meat and dairy products will probably increase in line with growing purchasing power. The exportable surplus will be relatively small compared to the level that was reached in the soviet period. In the cereal sector it can be assumed, that average yields wiJI increase, whereas domestic human consumption will stay stable or even slightly decrease. Due to the slow pace of recovery, the uptake of cereals by the livestock sector will increase only slightly. A certain improvement of feed conversion rates might further reduce the growth of feed grain consumption. As a consequence the current deficit in the cereal sector wi II dec! i ne.
Table 0.1
Projections for main commodities, production (000 t)
1993 1994 2000
Cereals 812 509 744
Milk 807 772 883
Beef 43 28 65
><
H H H
TABLE 1 : Estonia in comparison with other CEECs and EU-15
Population GOP GOP pc Total area (mio) (bio ECU) (ECU) (mio ha)
Bulgaria 8.5 9.4 1ll0 11.1
Czech. Rep. 10.3 26.7 2586 7.9
Estonia 1.6 1.5 938 4.5
Hungary 10.3 32.5 3150 9.3
Latvia 2.6 2.2 850 6.5
Lithuania 3.8 2.3 627 6.5
Poland 38.5 73.4 1907 31.3
Romania 22.7 21.8 961 23.8
Slovakia 5.3 8.7 1643 4.9
Slovenia 1.9 9.8 5018 2.0
CEEC-10 105.4 188.3 1786 107.7
EU-15 369.7 5905.1 15972 323.4
- - -
-Agricultural area Arable area Agricultural production (mio ha) (%total) (mio ha) (ha pc) (bio ECU) (%GOP)
6.2 55.9 4.0 0.47 1.131 12.0
4.3 54.3 3.2 0.31 0.871 3.3
1.4 30.6 1.0 0.63 0.266 10.4
6.1 65.8 4.7 0.46 2.068 6.4
2.5 39.2 1.7 0.65 0.232 10.6
3.5 54.0 2.3 0.62 0.259 11.0
18.6 59.5 14.3 0.37 4.648 6.3
14.7 61.9 9.3 0.41 4.500 20.2
2.4 49.0 1.5 0.28 0.512 5.8
0.9 42.7 0.2 0.13 0.250 4.9
60.6 56.2 42.3 0.40 14.7 7.8
138.1 42.7 77.1 0.21 208.8 2.5
Agricultural employment Rainfall (000) (%tot. empl.) (mm/year)
I 694 21.2 550
271 5.6 491
.. 89 8.2 . . 600
392 10.1 600
229 18.4 680
399 22.4 625
3661 25.5 550
3537 35.2 635
178 8.4 611
90 10.7 1350
9540 26.7
X
1-4 c:::
___,~
@
0
==-=-~
ESTONIA
TRANSPORT AND ECONOMIC STRUCTUREStates borders
J,
Harbour Capital$
Power station Major d~d
Chemical industry Major railway*
Heavy industry Major road r-1 Open cast mine Major river ~ Phosphot"US minePCJ) Fish processing Industry
~ Airport
\1 Textile Industry
0 50
N Food Industry Pa
GULF OF FINLAND
so·
1.
General Overview
1.1 Geography and Climate
Estonia comprises a total
surface of 45.000 km2
corresponding closely to that of Denmark. The country is
relatively flat, with an
average altitude of 50 m
above the sea level, the highest mountain reaching
318 m. Only 10% of the land
is situated at a level
exceeding 100 m.
-
·
-
·· ·-···-
--
-···
·-
··-
.
..
.
.
...
..
---
·
·
·
·
··-..
·
·
-··
-·
-
·
··---·
··
-·
·
-l
I
Land
use
in
-
-
Est
-
Onia
-
1
The agricultural area has
diminished significantly
within the last 50 years. Figure 1
Pastures and grassland have
(46,3%)
~Agriculture
~Forests
f#m Rivers and Lakes ~Others
especially been abandoned and subsequently afforested. At present, agriculture covers some
30% of Estonian territory, whereas forests cover 43%. Forest land has increased in recent
decades, while agricultural land has declined. Ten percent of Estonia comprises Islands.
The climate is characterized by relatively moderate winters and fresh summers and annual
precipitations are between 500 and 700 mm.
1.2 Population
The Estonian population was no more than 1.571 million in 1993 with a downwards tendency.
This is being caused firstly by the important re-migration of Russians but also by a declining
birth rate. (Landerbericht Estland Stat. Bundesamt 1993). It can however be expected that
the population will stabilize at around 1.5 million inhabitants.
32o/o of the population live in Talinn the capital, 22% in the other 5 bigger cities (Tartu,
Narva, Parnu, Kothla-Jarve and Sillamae), 17% in cities of about 1000 inhabitants and 29%
in completely rural areas.
The population density averages 33.7 habitants/km2 which is the lowest of all Baltic countries.
In the rural areas this figure does not exceed 10 inhabitants/km2
1.2.1 Ethnic structure
Before Soviet occupation in 1940, ethnic minorities were almost negligible, but since the end of the second world war Russian immigration has largely increased. By 1989 the Russian part of the Estonian population had reached 30.3%. After independence some 90 000 Russians re-migrated resulting in a slight change in the ethnic structure. The Finnish minority is 1%. The Russian population
is concentrated in the cities, working in heavy industry, which now
faces enormous
problems. Thus the Russian minority is more a f f e c t e d by unemployment.
The rural population is almost exclusively Estonian. Russians
---
-
---1
1.---
E_t_h_n
- ic-s-t-ru_c_t u_r
_
e
__
o
_
f
_
E
_
Stonia]
1(61,5%)
(8,2%)
(30,3%)
~ Estonains
~Russians
• Ukrainiens
' - - - -- - - -·- - -- --- -··- . ·-·
engaged in agriculture Figure 2 mostly work as
employees. Only one percent of the Russians work as individual farmers. The "Law on foreigners" of 1993 determines as foreigners all people who immigrated after 1940. In theory, immigrants are obliged to ask for authorization to work and for a residence permit every two years. In order to avoid conflicts with the Russian minority, a permanent residence permit has been granted for all immigrants who arrived before 1990.
1.3 Education
The education level in Estonia is relatively high compared with other former soviet Republics.
80% of the population have higher school education, only 20o/o have a primary school qualification or inferior (Landerbericht Estland 1993) School education is compulsory. An agricultural university is situated in Tartu.
Education and extension services are to be restructured. Agricultural education is organized in 13 technical schools spread throughout the country. In the Soviet era, these schools were very specialized. This specialisation, which was well adapted to the collective farm structure, is now being reoriented in order to impart the skills necessary to manage individual farms.
1.4
Infrastructure
1.4.1 Transport
The railway network has a relatively high density, but due to poor maintenance transport capacity is falling constantly. The most important lines are the Ptyalin-Tapa-Narva- St. Petersburg line, which dates from 1870 and plays a major role for the transit of Russian goods (cereals, coal, wood, metals) towards the Talinn ports. This line has recently been renewed with the aid of the EBRD (European bank for reconstruction and development).
The network of public roads comprises 14 800 km and is supplemented by 15 000 km of private roads which were built and maintained by kolkhoses (state farms) or industrial companies (Landerbericht Estland). The road transport capacity reached 213.9 million t in
1989. The transport network plays also an important role for trade with Russia.
1.4.2 Energy
Nearly 100% of the electric energy requirement is produced in two power stations close to Narva. The electricity produced is rather expensive, which is partly due to the fact, that the technical equipment of the power plants is outdated and inefficient. The energy sector is still state owned, but discussion on privatisation has already started. Due to the monopolistic structure of the energy sector privatisation will not automatically bring more competition. The oil slate layers are the most important source for the production of electricity in Estonia. Formerly Estonia even exported electricity towards Russia and Latvia but these exports declined significantly following Baltic independence and economic recession.
The supply of oil became a major problem after independence and added to the economic difficulties. Estonia was almost exclusively dependent on Russian oil which has had to be paid for in hard currency and at world market prices since 1992.
The fall of industrial production led to a parallel fall in the consumption of energy.
Estonia has some own resources of oil which have been exploited mainly for the export, but production has fallen in recent years from 19.6 million tin 1991 to 14.9 million tin 1993.
1.4.3 Health
The public health sector is characterized by a relatively high supply of hospitals and medical services, but equipment does not meet modern standards. Medical treatments were free of charge, financed by the national budget, but since 1992 this system has been replaced by an insurance system.
inhabitants I doctor 239.0
1.5 The political situation
After a changing history and several occupations, Estonia gained independence for the first time in 1920. This lasted until 1938. Following the Molotov-Ribbentrop pact, the Baltic countries fell under Soviet influence. A Sovietization phase began, which was interrupted by the invasion of the German army in July 1941.
After the world war the process continued with collectivisation of the agricultural sector and the establishment of heavy industries. Moreover Russian immigration was encouraged by the Soviet government. The process of detachment from the USSR began in 1988 and independence was obtained in August 1991 after serious confrontations with the USSR.
The current constitution dates from 1990. It established a unicameral system with a relatively powerful 101 seat parliament. The President of the Republic is the Head of State with largely representative functions.
Until recent elections the government coalition comprised the "Fatherland Alliance" (four Christian Democratic parties), the "National Independence Party", the "Estonian Liberal Democratic Party" and the "t\.1oderates" (a grouping of the social democratic and rural parties). In September 1994 the Prime t\.1inister Mart Laar, was overthrown because of financial misdealings during the monetary reform. He has been replaced by Andreas Tarand the former Minister of Environment.
Other political parties represented in the Parliament are the "Popular Front", a party of the centre, "Social Home", which gathers mainly old managers of the industrial companies and the managers of the kolkhoses.
The General Elections of 5 t\.1arch 1995 ended with a complete disaster for the ruling coalition. The winner of the elections was the "Alliance", a group of several small political parties, including the Estonian Country Party (ECP) and other rural parties. The "Alliance" is led by the Assembly party (AP) under Tiit Vahi, who has now been appointed Prime Minister. He formed a coalition Government with the left wing, protectionist Centre Party (CP) under Edgar Savisaar. The new Government holds 57 of the 101 seats in the Parliament (Riigikogu). Vahi has committed himself to continue the reform course of the former government. Social policies and support for the agricultural sector, including border protection measures, are however likely to be strengthened at least to some extend, under the new Government.
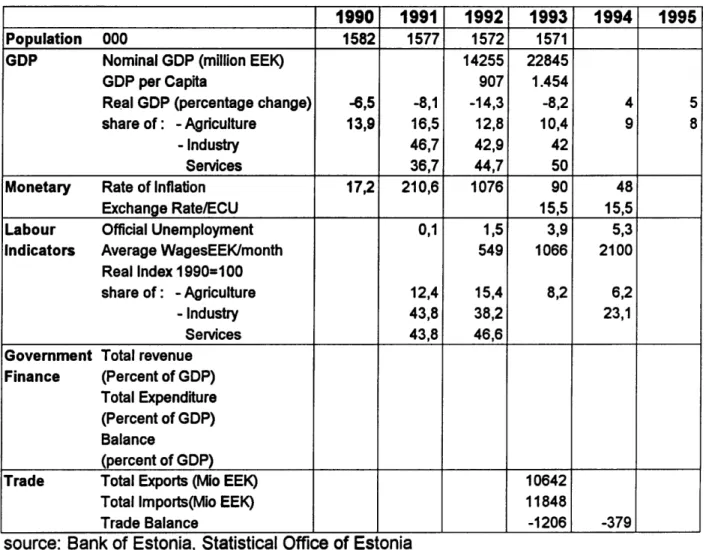
Table 1.1 Macroeconomic Indicators
1990 1991 1992 1993 1994 1995 Population 000 1582 1577 1572 1571
GOP Nominal GOP (million EEK) 14255 22845
GOP per Capita 907 1.454
Re.al GOP (percentage change) -6,5 -8,1 -14,3 -8,2 4 5
share of : - Agriculture 13,9 16,5 12,8 10,4 9 8
-Industry 46,7 42,9 42
Services 36,7 44,7 50
Monetary Rate of Inflation 17,2 210,6 1076 90 48
Exchange Rate/ECU 15,5 15,5
Labour Official Unemployment 0,1 1,5 3,9 5,3
Indicators Average WagesEEK/month 549 1066 2100
Real Index 1990=100
share of: - Agriculture 12,4 15,4 8,2 6,2
-Industry 43,8 38,2 23,1
Services 43,8 46,6
Government Total revenue Finance (Percent of GOP)
Total Expenditure (Percent of GOP) Balance
(percent of GOP)
Trade Total Exports (Mio EEK) 10642
Totallmports(Mio EEK) 11848
Trade Balance -1206 -379
1.6 Economic situation
1.6.1 General situation
Up to 1990 the economy increased slowly, but since that time GDP has fallen each year. According to national sources GDP fell in 1991 by 8.1 %, in 1992 by 14.3% and in 1993 by
8.2%. As a result of privatization efforts and foreign investments, a growth of 4% has been been registered for 1994. This economic growth is likely to continue in 1995 with GDP increasing by 5%. Black market activities still play some role in the economy. Some sources believe its share of GDP to be 12o/o.
1.6.2 Employment
The distribution of employment between the different sectors has changed fo1lowing the restructuring process of the economy. While employment in the industrial sector is contracting, it is increasing in the service sector. The labour force employed in agriculture has contracted to half of its former level. Nevertheless, agriculture has played a kind of a buffer role in employment policy. At present 22.3°/o of people of working age are without formal employment. Most however \Vork small agricultural household plots but are neither counted as unemployed, nor as people employed in agriculture.
The official level of unemployment reached 5.3% in 1994, but this low level masks a problem of hidden unemployment such as part time work, reduced working hours even to zero and overemployment in many (state) enterprises.
As a consequence of progressing privatization, unemployment is likely to continue to increase in the foreseeable future.
1.6.3 Industry
Estonian industry is concentrated in the Tal inn region ( 40% of total production), in Narva and in Kohtle Jarva. Most of the industry was established during the Soviet era, attracting immigrants from Russia and other Soviet Republics. Most of the enterprises now have outdated, energy wasting and oversized technical equipment.
The most important industries are the processing industry (63% of total production) notably the food processing industry (47% of industrial output), and the building industry. The production of earth moving machines and of electric motors also plays an important role. Within the processing industry, fish processing and the dairy and meat sectors are dominating.
increased in some sectors such as paper production (63.1 %), machinery (31.4%), plastics
(32.3%) furniture and constn1ction materials.
The food processing industry continues to contract. In the first 6 months of 1994 output declined by 12%, compared to the same period of 1993.
The privatisation process is well advanced but it is mainly small enterprises which have been privatised rapidly, while for large scale enterprises it is still a highly political matter and is lagging behind. Foreign investment has totalled ECU 2.5-3 billion since independence.
Investments in the industrial sector have been concentrated in the regions around Tallinn and Narva. Until now, most investments were in the banking and service sector.
1.6.4 Foreign Trade
For the small Estonian economy, trade and especially exports are key to economic development. Until now Estonia has had the most liberal trade regime of all the three Baltic Republics, allowing free trade without any import duties or tariffs for most commodities, including most agricultural and food produce. For 1995 however the introduction of import tariffs is foreseen. A tariff system is presently under preparation. The main aim will be to get illegal imports of subsidised products, which come mainly from Russia under control and to introduce some protection against subsidised imports. The currency is pegged to the German "DM" at a ratio of DM 1 = EEK 8. \Vhen this rate was fixed, the EEK was highly undervalued, which helped the exporting industry. But due to considerable inflation, the gap between the official exchange rate and the 11
real value11
of the currency has diminished but still the Estonian crown appears to be under valued. The benefit for exports however likewise diminished to some extent.
In both 1993 and 1994, Estonia was a net-importing country, but due to foreign investments amounting to 6 billion EEK, the overall balance of payments is still positive.
In Soviet times trade flows existed nearly exclusively between the Republics of the FSU. Trade with Western countries played an insignificant role. Following independence the direction of foreign trade shifted increasingly to\vards the EU and EFT A countries. In 1994 60% of trade was performed with EU Member States. If trade with Sweden and Finland is added, this figure is increasing to 80%. For its future development, trade with Russia will nevertheless remain an important factor, firstly because of the geographical situation of Estonia being close to the markets in St. Petersburg and Moscow, and secondly because of product quality which in many cases is not at the level of Western European standards.
The main exports have been agricultural and food products, textiles, wood and timber. Reexports of petrol and metal also have an important share of total trade.
1.6.5 Monetary questions
Until 1992 Estonia was in the Ruble core. In June 1992 the Estonian Crown (EEK) replaced the Ruble as legal tender. The EEK is by law pegged to the German DM at a rate of
EEK 8 : DM 1 and at that time was heavily undervalued. This exchange ratio has never been changed in spite of considerable inflation and the gap between the official exchange rate and the real value of the currency is narrowing. The annual rate of inflation has slowed significantly from over 1000% (effect of monetary reform) in 1992 but in 1994 still remained at a level of 48%.
The banking sector is facing serious difficulties and expertise and experience are mtsstng to a large extent. Moreover, the difficult economic situation made the loans very risky. For the time being the banking system comprises about 21 commercial banks, many of them burdened with bad loans. Immediately after independence the minimum capital requirements for bank licences were rather low. As a consequence a banking crisis occurred in 1992 and three large banks had to close down. In the meantime the requirements and roles of banks have been increased and several smaller banks have accordingly closed down. Recent improvement can however be observed and especially the two largest banks, the "Hansa Pank" and the "Uhis Pank", seem to be developing positively. Interest rates for short term credit at present range between 20 and 25o/o and those for long term credit, between 15 and 16%. Short term credit still accounts for some 75o/o of total credit volume, whereas long term credits are difficult to obtain.
Until the second half of the eighties, wages increased at an average annual rate of 3%. After a remarkable increase in wages of 7.9% in 1990, real incomes fell due to high inflation. For
1993 the average wage per month was EEK 1066 (ECU 69), and EEK 2100 (ECU 136) in
1994, which is relatively high compared to neighbouring Russia. Wages in the banking sector are the highest, whereas agricultural wages are rather low.
The average share of household income used for food increased from 29% in 1990 to 38.6%
2.
Agricultural Economy
2.1
Land Use
The total agricultural area comprises 1.4 million hectares, which represents only 30% of the total land area; the lowest proportion all the three Baltic Republics. As has been mentioned before, the agricultural area diminished significantly in recent decades and it is possible that still further land, mostly grassland, will go out of production within the next few years. This may be replaced to an extent by some of the arable land being transformed into pastures. At present it can be assumed that 20% of agricultural land is left idle.
More than 1.1 million ha of Estonian agricultural land is arable land, most of which is used to grow cereals and fodder crops for animal feed. 310.000 ha are used as permanent pastures and the remaining 15.000 ha is used for
1
J
permanent crops i.e. fruit and especially
Agricultural Land Use
berries. A comparatively low soil qualityand short growing season are leading to relatively low crop yields. More than 50%
of the land is still used by the legal (81,7%) enterprises emerging from the former
sowkhoses and kolkhoses but the share of total output of these private farms by far exceeds their share of agricultural land.
The major part of the arable land
(733.000 ha) is drained but since the Figure 3 kolkhoses ceased to exist the drainage
system has lacked maintenance and is
~Arable Land (0,8%) • Pastures
(17.4%) D Permanent crops
consequently now often in a very bad condition. This will also have a negative impact on yields (and would require further investments). From the World Bank and national funds a total of$ 5.5 million has been made available for the maintenance of the drainage system.
2.2 Importance in the Economy
Agriculture has lost much of its economic importance since the eighties and its share of GDP has fallen significantly. Comparisons between the figures given for the different years is however difficult because statistical methods have been changed. In 1994 agriculture had a 8% share of total GDP.
Estonia is a traditional producer of dairy products and meat. Before its independence Estonia was fully integrated in the Soviet economic system. On the one hand half of the animal feed requirements came from other Soviet Republics whereas 30 percent or more of meat and dairy products were exported mainly, to St. Petersburgh and Moscow. After independence Estonia has been confronted with a series problems:
Imports of animal feed have become very expensive, which have made Estonian meat and milk production less competitive. The high import taxes on Estonian products which have been imposed by the Russians have added to the problem. (In the meantime Latvia and Lithuania were given l\1FN status, whereas imports from Estonia are taxed with the double of normal import tariffs). The internal market of Estonia also deteriorated because of the bad economic situation and a diminishing purchasing power. Finally, the farm restructuring and privatisation process has also led to declining production.
As a consequence agricultural production fell by 4% in 1991, 18.6% in 1992 and by 17% in 1993 (OECD). However sources are contradictory and it is very difficult to estimate the real drop in production, since reliable statistics are not available. It seems to be possible that production was overestimated before independence and is now underestimated, since part of the production, such as from household plots, is not included in the official statistics. The economic performance of agriculture does however appear to be starting to recover. About one third of farms can operate with profit, although another third is definitively making losses.
2.3 Food Consumption
Table 2.1
Annual per capita consumption of food
unit 1990 1991 1992 1993a 1994 EU2
Milk I 487 409 350 325
Meat kg 84 59 58 87
beef kg 22 18 25 27 27 22
pork kg 46 34 28 20 20 41
poultry
kg
9 7 5 .) .., 4 19 Eggs pteces 289 260 224 210sugar kg 44.5 36.1 34
potatoes kg 103 104 105 128 79
vegetables kg 64 57 100 92 116
bread kg 77 79 81 81 82
'
Source: Stattsttcal Office of Estonta~ 2 EU 12, 1994
2.4 Farm Structure
,---~
Before independence Agriculture was organized bet\veen 3 50 big co-operatives each managing some 3500 ha with 300 employees. These kolkhoses and sowkhoses had a high vertical integration comprising important parts of the upstream and downstream industries. The process of restructuring and privatisation that started after liberalisation is not yet complete, but the trend seems
I
Farm structure
I
(41,7%)
(17,2%)
(41,1%)
!Jan. 1994J
to be towards smaller size family Figure 4
farms with an average size of
c Legal enterprises
Bl Family farms I'JI Private plots
a) the so called "legal enterprises" which emerged from the former kolkhoses and sowkhoses. These are organized as limited liability companies, joint stock companies or new co-operatives. Often these enterprises had only a transitional status and are being divided into smaller entities during the privatisation process particularly since share holders prefer to set up their own farms. A considerable share of the legal enterprises will probably go bankrupt, but still about one third of the agricultural area is expected to continue to be managed by large scale farms. In January 1995, 983 Co-operative and state farms were counted.
b) The family farms, of which by January 1995 about 13540 were in existence with an average about 23 ha of land. Together they represent 21.4 % of the total agricultural area. Only 30% of these farms have more than 30 ha of land and only 10% exceed 50 ha. Forests are an important feature of most family farms and account for up to 30% of the total farm area.
SIZe
There are still around of200.000 claims for restitution outstanding. Most of the family farms are therefore working only on a provisional basis. Recent forecasts estimate that there may be 40.000 such farms by the end of the century.
Table 2.2
Structure of family farms January 1995
<5 ha 5-l 0 ha 10-20 ha 20-30 ha 30-50 ha 50-100 >100 ha ha
number 1634 1827 3750 2721 2488 1027 66
% 8 13 28 21.5 20 9 0.5
Source: Statistical Office of Estoma
c) More than 350.000 small and not legally registered subsidiary plots, with an average size of 1.7 ha. Some 225.000 ha or 24% of the agricultural surface are estimated to be managed by these kind of enterprises on a part-time basis. In· many cases there is still a close link between the household plots and the legal enterprises which mean it is difficult to separate the production originating from these entities. Subsidiary plots already existed under the Soviet system~ their share of production for many products and, their share of total production being much higher than their share of total agricultural land. In 1992 they produced 54.9% of potatoes, 51.8% of vegetables and 85% of fruit.
2.5
Privatisation
Privatisation of land proceeded in a different way, to the privatisation of assets. As far as the privatisation of land is concerned, the Government is following the principle of restitution before compensation. Thus priority is being given to returning the land to their former legitimate owners or their heirs. Apart from legal and political problems the restitution of land also posed a number of practical and administrative problems including missing borders, fragmentation of former landownership etc. At present, only around 5% of land restitution is completed from a legal aspect. For 25% of the (less fertile) land there are no claims for restitution at alI.
The privatisation of farming and land ownership was based on a series of laws:
a) The Law on peasant farming from 1989 which was adopted before independence. This law established a basis for private farming but not for private land ownership and allowed farmers to mange small private enterprises but not to sell the land. Some 7000 farms have been established by this law, which together total 180.000 ha. These enterprises turned out to work quite efficiently and due to the fact that they could buy inputs at low prices they had a better basis than the private enterprises which were founded later. An increasing proportion of production stems from these enterprises.
b) The Law on Land Reform of 17 October 1991 started the process of returning the land to its rightful owners. This was continued later by the Law on Property Reform in Agriculture of 11 March 1992 and finally concluded under the Law on Co-operative Enterprises of September 1992.
By the deadline in January 1993 more than 200.000 claims for restitution had been received which was far more than had been expected. The restitution process will therefore take several years to complete, in particular the settling of legal titles to the land. This aspect is a serious obstacle for the necessary investments in buildings, machinery and other assets.
The privatisation of assets has proceeded in a different way and is not yet complete. Social facilities, such as schools, medical stations, kindergartens etc, have remained in state or municipal ownership. Certain assets were given to employees and former employees on a voucher basis. The remainder were restituted to former owners. In practice around 35o/o of assets have been restituted.
2.6 Arable Crops
The total extent of arable land was 1.1 million in 1994 and has changed very little in recent years. Compared with the situation in 1989 however, around 20% of the land is left idle. The main role of the arable sector has been to supply the animal sector with its feed requirements. Consequently mainly summer cereals, such as barley and oats but also green fodder, have been planted. At present there is a certain tendency to increase the production of fodder crops, which could help to replace expensive imported feed. In 1994 about 60o/o of the arable land was planted to fodder crops.
Due to the massive destocking in the animal sector the area planted to feed grains slightly and a certain shift towards the production of wheat and rye for human consumption can be observed.
Traditionally the Crop sector acounted for only 30% of the Gross agricultural output (GAO), bu due to the decline in
the livestock sector increased to 43% in
---,
I
Cereal Production. in Estonia
J
11994.
I
400
I
2.6.1Cereals
!111i1lWheat I ~ 300
The total area planted to cereals was 320.000 ha in 1994, most of which was barley. The large-scale farms are increasingly important to
0
g
200I
!ml Barley j
mB others '
i
i
100
0
1988 1989 1990 1991 1992 1993 1994
the sector, accounting Figure 5
for two thirds of cereal
production. Individual farms account for another 25% of grain production, whereas household plots provide only marginal share of cereal production. Low producer prices and high stocks, but also the bad weather conditions in the autumn of 1993 which reduced the possibility to sow winter cereals together with drought the following summer, may be seen as the main reasons for the continuing downwards production of cereals in 1994.
Immediately after independence, the area planted to wheat and rye for human consumption increased but the quality has often been insufficient for bakeries, partly a problem of varieties and partly due to missing utilisation of fertilizers. As a consequence prices for domestically produced food grains are low and the wheat and rye area has accordingly continued to decrease.
Before independence Estonia imported large quantities of cereals, mainly for feed use. But as a consequence of the decreasing livestock sector, imports of cereals for animal feed also dropped. The high imports of 1992 are firstly a result of food aid imports from international organisations.
Producer prices as well as consumer prices have been liberalized. In 1992 however, a high procurement price was fixed, exceeding the corresponding export price. This led to a monopolistic position on the domestic market for the state grain board and to high farm gate prices. High stocks which could not be sold, and increasing costs and indebtedness for the processing industries \vere the result. In addition a 70o/o import duty on Russian flour had to be applied in order to sell the domestic stocks of grain.
In the meantime the national grain board lost most of its influence on the grain market and will possibly be liquidated in the near future. At present it is responsible for the procurement of the state grain reserve, which measured 50.000 t (mainly rye) in January 1995, which is little more than one third of annual human consumption. The price offered for purchases for the grain reserve ranged bet\veen EEK 1600 (ECUI 04) for wheat and EEK 1300 (ECU 84) for rye. Producer prices for cereals at present range between 800 and I 000 EEK (52-65 ECU) for feed grains, up to 1300 EEK for rye and between 1300 and 1500 EEK (84-97 ECU) for wheat.
Table 2.3
Summary table cereal production in Estonia
1990 1991 1992 1993 1994
area (000 ha) 397 418 424 375 320
production (000 t) 958 939 598 812 509
yield/ha (t) 2.41 2.25 1.34 1.89 1.6
total consumption2 1377 1263 955 738 716
imports2 419 324 357 -74 91
ending stocks
Source: S tattstical Office of Estonia 2 own calculations
2.6.2 Fodder Crops
The area planted to fodder crops reached 567.000 ha in 1994, which is nearly half of the arable land. The largest proportion of this land is sown with perennial grasses for silage .Fodder roots are planted to only 12.000 ha. Pulses and other protein crops do not reach more than 1000 ha.
2.6.3 Potatoes
Potato production is typically based on household plots (and small family farms) for both human consumption and for animal feed. About two thirds of total production comes from these small farms. (Large scale farms produce another 23%.) The increasing level of per capita consumption of potatoes in recent years, underlines the importance potatoes have for nutrition.
About 50% of potato production is used for animal feed. Processing of potatoes plays only a marginal role, utilizing no more than 10% of production. Factories for potato starch, crisps and chips exist but do not perform very well.
area (000 ha)
production (000)
yield t/ha
Table 2.4 Potato production
1990 1991 1992
45 52 46
618 592 669
13.7 11.4 14.54 Source: Statistical Office of Estonia
2.6.4 Fresh vegetables
1993 1994
43 40
538 563
12.51 14.08
Fresh vegetables, mainly cabbages, (and fruit) are also produced mainly on smaii household plots {51% of production) and on individual farms (3 7% of production). They play an important role in the nutrition of families. Greenhouse production of tomatoes and cucumbers is also of some importance. There are t\vo (large) enterprises, near Tallinn and near Tartu, which perform rather well, whereas a third is in economic difficulties. Vegetable production has not shown significant changes during the last few years.
area (000 ha)*
production (000 t)
yield t/ha
Table 2.5
Vegetable production
1990 1991 1992
5.2 5.7 5.1
106 78
20.38 0.00 15.29 Source: Stattsttcal Office of Estonra
2.6.5 Permanent Crops
1993 1994
5.0 4.4
70 70
14.00 15.91
80% of total production. Larger farms are found around Tallinn and Tartu. The production of strawberries and other soft fruit in particular could become of greater importance in the future. The climatic conditions and low labour costs would appear to favour soft fruit production in Estonia, but at present there are no marketing structures. Production shows much annual fluctuation which is mostly due to climatic reasons.
1990
area (000 ha)* 11.5
production (000 t) 22
yield t/ha 1.9 Sourc e: Stattsttcal Office of Estonia
2. 7 The livestock sector
Table 2.6 Fruit and berries
1991 1992
12.2 12.0
23 30
1.9 2.5
1993 1994
12 12
45 21
3.8 1.8
In the Soviet era, like in the other Baltic Countries, agricultural production centred around the livestock sector, which had a considerable export potential, especially for meat, butter and milk powder. l\1ain destinations were the regions around St. Petersburgh and Moscow. The livestock sector accounted for around 70% of gross agricultural output (GAO) but has decreased to 57o/o in 1994 (constant prices of 1993).
Before independence, animal production was performed on large-scale farms, the sowkhoses and kolkhoses. Domestic production of animal feed was however far from sufficient and low priced imports of animal feed, but also machinery and energy from the FSU, were essential for Estonian livestock production. The reasons for this kind of economic exchange between different Soviet Republics were to a large extent ideologically influenced which aimed at closer economic links between the Republics.
The stocking density in some cases was very high. Normally these farms disposed of sufficient land to spread all the manure produced, which in most cases limited the environmental impact.
After the liberalization this situation for livestock production changed fundamentally. Firstly inputs had to be bought at world market prices, which made Estonian production more expensive and secondly, due to high import levies, access to the Russian market became more difficult and less attractive. As a consequence livestock numbers dropped until 1994 by more than 50%.
agricultural land, a surplus production of meat and dairy products is very likely to continue, but certainly at a lower level. The geographic and climatic situation does not leave many viable alternatives for agricultural production.
2. 7.1 Milk and Dairy
Milk is one of the key agricultural products and an important export commodity. Between the beginning of 1990 and the beginning of 1994 cow numbers declined from 293.000 to 227.000. This downwards trend continued in 1994 and the cow inventory for the beginning of 1995 counts only 211.000 heads. Milk output also contracted from 1.2 million t in 1990 to 772.000 tin 1994, registering a drop of 33%. This decline has now bottomed out and milk production is likely to stabilize at present levels. According to recent reports, the bulk of milk production is still produced in large scale farms and 63% of dairy cows also still belong to legal enterprises, 1 Oo/o to private farmers and 17% to households. 75% of total milk production comes from herds exceeding 100 heads. Due to deteriorating feed quality the yield per cow also dropped from a high level of 4000 kg/year, which was the highest of the three Baltic states, to 3400 kg per year in 1994.
Most of the milk was collected and processed, the main dairy products being drinking milk, fresh dairy products and skimmed milk powder. Eight large milk processing plants are located all over the country. Due to large over-capacities, competition between the dairies is increasingly leading to higher producer prices. It can be expected, that in the longer run only half of the existing dairies will stay in business.
Recent cost calculations show that under current market conditions milk production can be viable in herds exceeding 20 cows. Smaller herds will not be sufficient to allow the necessary investments in milking and cooling equipment.
Table 2.7
Production of milk and dairy products
1990 1991 1992 1993 1994
Milk production ( 000 t) 1208 1093 919 807 772
dairy cows (000 heads) 293 275 250 240 227
yield per cow (kg/head) 4100 3975 3676 3663 3401
butter production (000 t) 29 28 26 24 18.1
SMP production (000 t) 25 23 21 25 22
cheese production (000 t*) 19 19 17
Butter and skimmed milk powder also used to be important export commodities. In 1992 39% of total butter production and 62% of milk powder production were exported. Butter was traditionally exported to the Russian market, but milk powder was exported to a large extent to the EU and EFT A markets, partly for further processing and partly for re-export to third countries.
Producer prices for milk in 1993 were the highest of all the Baltics, but rather low compared to international prices. In 1994 however, prices increased significantly. Actual price levels ranged between EEK 0.8 and EEK 2.5 (ECU 0.05-0.15/ l) depending on the milk quality. Milk prices in 1994 for comparison reached an average of slightly below 0.1 ECU It, but prices vary considerably depending on the quality. Retail prices for milk were ECU 0.24/litre at the beginning of 1994.
The milk consumption per head used to be fairly high. In recent years however it fell from 487 litres to 325 litres per year.
2.7.2 Beef
Beef meat production was to a large extent a by-product of milk production. As a consequence of declining possibilities for export and reduced internal demand, cattle numbers dropped from 806.000 in 1990 to 463.000 in 1994 and to 420.000 by the beginning of 1995. This means that livestock numbers have nearly halved. Specialized meat producing breeds are not common. Household plots account for more than one-third, the enterprises for roughly half of the total beef meat production.
Producer prices for beef meat range between 5000 EEK and 22.000 EEK (325-1420 ECU) per ton of live weight, depending on the quality, the averag price for 1994 is given with 7800 EEK for 1994. Consumer prices for beef meat were 0.96 ECU/kg at the beginning of 1994 which is little more than half the price of pig meat. The low price may also be a result of the low meat quality, which is in part a consequence of destocking. Exports of meat have dropped but trade figures vary to a large degree.
Table 2.8
Beef meat production
1990 1991 1992 1993 1994
cattle (000 heads) 806 753 723 583 463
meat production 80 52 45 43 35
(000 t)2
onsumption (000 t)3 40 41 44 44 42
exports ( 000 t) 40 1 I 1 0 0
imports (000 t) 1 7
ending stocks (000 t)
~
2.7.3 Pork
The swine inventory has dropped tremendously due to marketing problems and to the increasing prices for imported feed as mentioned above. As a consequence, pork production fell from 95.000 tin 1990 to 37.000 tin 1994. Estonia used to be a net exporter of pig meat, mostly to Russia, but in 1993 Estonia also began to import pig meat, some of which as canned meat from the EU, mainly from Denmark and Germany.
Pig production is still concentrated in large scale farms with herd sizes between of 1000 and
2000 pigs. There is one very large pig producer with around 20.000 pigs.
Consumer prices for pork are on average higher than for beef meat, which reflects to a large extent consumer preferences, although these are changing. In 1994, the retail price per kg was
1.8 ECU/kg. Producer prices for 1994 ranged around 1300 EEK I I 00 kg live weight weight
(84 ECU/ 100 kg).
1990
pig numbers 1080
(000 head)
meat production 95 (000 t)2
consumption (000 t)3 73
exports (000 t)l 22
imports (000 t) ending stocks
(000 t)
Table 2.9
Pork Production
1991 1992
960 799
75 50
54 44
21 6
1993
541
35
31 4
Source: Stattsttcal Office of Estoma~ 2 IJve wetght x 0.82; 3own calculatton
1994
424
37
31
2. 7.4 Poultry
Following independence, poultry production experienced a sharp decline . Annual production of meat dropped from 22.000 t in 1991 to only 5.000 t in 1993. The production of eggs contracted in the same period from 31.000 t to 20.000 t. Until October 1993 the poultry market was burdened with Russian eggs, which profited from subsidized feed, and entered the Estonian market at very competitive prices. Feed subsidies in Russia were phase out at the end of 1995, marking an end to Russian egg exports. In 1994 the decline in the poultry sector bottomed out and for 1995 an increase in production is expected. Poultry production is concentrated in some large production units around Tallinn.
number of animals
(000 heads)
meat production
(000 t)
egg production
(000 t)2
Table 2.10
Poultry meat production
1990 1991 1992
6923 6537 5538
22 22 10
31 31 25
Source: StatiStical Office of Estoma; 2 1 egg = 56 g
2.8 Forestry sector
1993 1994
3418 3226
5 7
19 20
Forests cover 45% (2, 022 Million ha) of Estonia, 70% of which are conifers and 25% birch. In the post-war period the forest area has increased by approximately 1 Mio ha, mainly through afforestation of former agricultural land. Wood production serves mainly as raw material for the paper and cellulose industry but also for construction purposes and for the furniture industry. A large part, although difficult to quantify, is used as firewood in rural areas. Estimations about the annual growth range to 9 million m3
( 4.45 m3 I ha), whereas only
3 million m3 per year have been harvested so far.
Before the war every farm had about 8 ha of forest land, which was enough to cover their own needs for heating and construction. At present only 3 .5o/o of the forests are in private property, but the restitution process has started and probably the former kolkhose owned forests, comprising about 814.000 ha, \viii be privatized.