www.electrochemsci.org
Characterization and Morphology of Copper Powder Particles
as a Function of Different Electrolytic Regimes
M. G. Pavlović1,*,Lj. J. Pavlović1, V. M. Maksimović2, N. D. Nikolić1and K.I. Popov3
1
University of Belgrade, Institute of Electrochemistry ICTM, 11000 Belgrade, Njegoševa 12, Serbia 2 Institute of Nuclear Sciences, ¨Vinča¨, 11001 Belgrade, P.O.Box 522, 11001 Belgrade, Serbia 3
University of Belgrade, Faculty of Technology and Metallurgy, Belgrade, Karnegijeva 4, Serbia *
E-mail: [email protected]
Received: 13 October 2010 / Accepted: 15 November 2010 / Published: 1 December 2010
The effect different deposition regimes (constant and reversing currents), on the powdered copper electrodeposits morphology were investigated. The results obtained in constant regimes were compared with those obtained in reversing regimes. The morphology of electrodeposited copper powder were investigated using a scanning electron microscope (SEM). The effect of the current amplitude, cathodic-to-anodic time ratio and period of the current wave are discussed. It is shown that the parameters determining the reversing current wave determine the micromorphology of the copper powder particles deposited. On the other side, technological properties of powders depend on their granulometry and particle morphology. Very often one method is inadequate for characterization of the morphology of powder particles. This paper also studied different methods for clear describing of the copper powder granulometry and morphology.
Keywords: Copper powder particles, morphology, constant current, reversing current
1. INTRODUCTION
selected for production of powder depends on the specific material properties. The four main categories of fabrication techniques are based on mechanical commuting, chemical reaction, electrolytic deposition and liquid metal atomization [3,4].
The electrolytic metal powder represents a disperse electrodeposit removed from electrode by tapping or in a similar way [5,6], which consists of particles of various forms and sizes. The electrolytic powder production method usually yields products of high purity, which can be well pressed and sintered. Besides, in recent years, it has been shown that by different electrolysis regimes it is possible, not only to obtain powders with a wide range of properties, but also to predict the decisive characteristics of powders, which are very important for powder quality and for appropriate application [2,4].
Main characteristics of powders are particle size (granulometry) and particle shape (morphology). Technological properties of powders (bulk density, flowability, surface area, apparent density, etc.) as well as the potential areas of their application depend on these characteristics [7].
Copper deposits obtained at high current densities and overpotentials are very important from a technological point of viev. It has been stated that the open and porous structures of copper deposits obtained at high current densities were ideally sited for use as electrodes in electrochemical devices such as fuel cells, batteries and chemical sensors [8,9], while the extremely high surface area is relevant for evaluating some electrochemical reactions. For example, it was known that copper shows a high activity for the nitrate ion reduction [10] as well as for the reaction in which nitrate is reduced to ammonia in high yield in aqueous acidic perchlorate and sulphate media [11]. Having in maind a potential high technology significance of copper deposits obtained at high overpotentials, it is necessary to better recognize the effect of this process on electrodeposition of copper under these conditions. For that reason, one of the aims of this paper it is to examine the effect of this process on copper electrodeposition at overpotentials on the plateau of the limiting diffusion current densitiey or higher ones.
It is well known that copper powders with different properties can be obtained by electrodeposition from different electrolyte solutions under different operating conditions. The same effects can be also obtained by changing overpotential wave shape during pulsating overpotential deposition a keeping all other conditions unchanged [1,2,12,13].
The electrodeposition of metal powders by pulsating overpotential produces particles of changed morphology relative to those obtained in classic potentiostatic deposition 1,2. It is also known that it is easy use pulsating overpotential deposition in the laboratory-scale cell but difficulties arise on a practical scale because of the demands for higher power and a high-speed potentiostat. The output current for input pulsating overpotential is a reversing current 14, and similar effects on the morphology and grain size of powder particles can be expected in deposition by pulsating overpotential and by reversing current. However, it is easier to obtain reversing currents on a practical scale and the deposition of copper powder by reversing current is of greater practical importance than pulsating overpotential deposition.
quasi-quantitatively, for example, by means of geometrical parameters. For characterization of real particles the particle shape becomes more and more important in addition to particles size. Image analysis can give valuable service. The method used to measure the powder particle size, enabling the analysis of the particle size distribution, could be divided into two groups: direct and indirect. The direct methods map the geometry of individual particles via optical, electron scanning and transmission microscopy. Indirect methods are based on physical effects, such as sieve and laser analysis [7,15].
Stereological methods could be used for precise description of powder based on their planar images. Useful for powder characterization are parameters measured for individual “objects” such as: area, perimeter and roundness, a shape factor which gives a minimum value of unity for a circle. This is calculated from the ratio of the perimeter square to the area 16,17:
064 . 1 4 2 A L f p R where is:
A – area total number of detected pixels within the feature
Lp – perimeter, the total length of the boundary of the feature. This is calculated from the horizontal and vertical projections, with an allowance for the number of corners.
fR - roundness shape factor which gives a minimum value of unity for a circle. This is calculated from the ratio of perimeter squared to area. The adjustment factor of 1.064 corrects the perimeter for the effect of the corners produced by the digitalization of the image.
Electrocrystallisation of copper powder has two stages, nucleation and growth, for smooth cathodes growth is enhanced through nucleation but the converse is true for powder production where each nucleus is a powder particle. Therefore, the key for changing of the particle size of the copper powder is the changing of the relative rates of nucleating and crystal growth [6,18].
The goal of this work was to investigate the effect of the parameters different deposition regimes on the morphology of electrodeposited copper powder particles as well as to study different methods for clear describing of the copper powder granulometry and morphology.
2. EXPERIMENTAL PART
Copper powders were deposited by galvanostatic regime; values of current densities (j = 7.71, 10.28, 30 and 36 Adm-2) and reversing current (the amplitude current densities values were, jA, from
18, 24, 30 to 36 Adm-2). The cathodic time was 1s, and the anodic time was 0.4s, in all cases.
The deposition time (brush-down interval) in all experiments was 30 min keeping all other conditions unchanged as in the case of constant current density regime.
The electrolytes were prepared from technical chemicals and demineralized water.
The wet powders were washed several times with a large amount of demineralized water until the powders were free from traces of acid, at room temperature. To inhibit oxidation, benzoic acid, as stabilizer, was added as additive (0.1%) to water for washing copper powders, to protect the powders against subsequent oxidation. This substance was removed by further washing [19].
Granulometry and morphology studies of powders were carried using three methods: a) sieve analysis [20];
b) optical microscope transmission method, to produce the projections of powder particles; c) scanning electron microscope.
The morphology of electrodeposited copper powders was examined using scanning electron microscope (SEM), PHILIPS, type XL30. Quantitative microstructural characterization of copper powders was performed by using of Zeiss Axiovert 25 optical microscope equipped with digital camera Panasonic WV-CD50 and software Leica QWin for automatic analysis of a picture.
3. RESULTS AND DISCUSSION
The photomicrographs of copper powder particles obtained in the constant current regime are given in Fig.1. It is obvious that increase in current density leads to a more disperse structure of the powder particles, as expected [12].
It has been shown that metal powder deposits can be obtained at current densities higher than limiting diffusion value [2,4,21,22]. In such cases deposition overpotential is determined by hydrogen co-deposition. Hence, the larger the difference between actual apparent density and the limiting diffusion current for copper deposition, the larger is the deposition overpotential. On the other hand, increasing overpotential leads to increased nucleation rate [23], as well as the number of sites suitable for instantaneous dendritic growth initiation [2]. The number of nucleation sites on the initial surface is obviously limited, while the nucleation on the growing grains can take place continuously. Assuming that powder grains and grain subparticles are the product of further dendritic growth on nuclei formed on the initial surface and the grains themselves, respectively, it is easy to explain the well known fact that powder particle grain size decreases with increasing current density [12,24] as well as the size of subparticles.
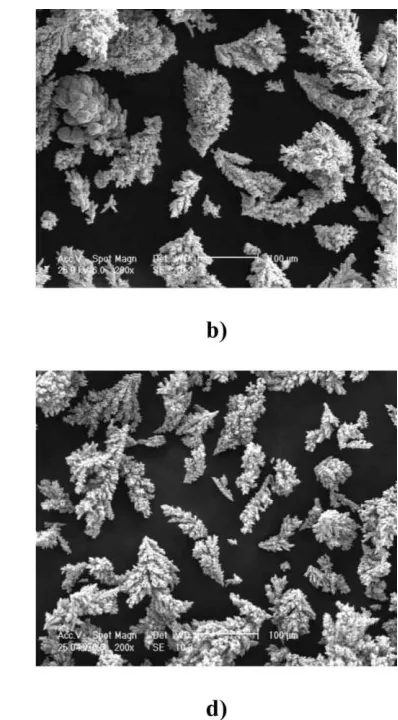
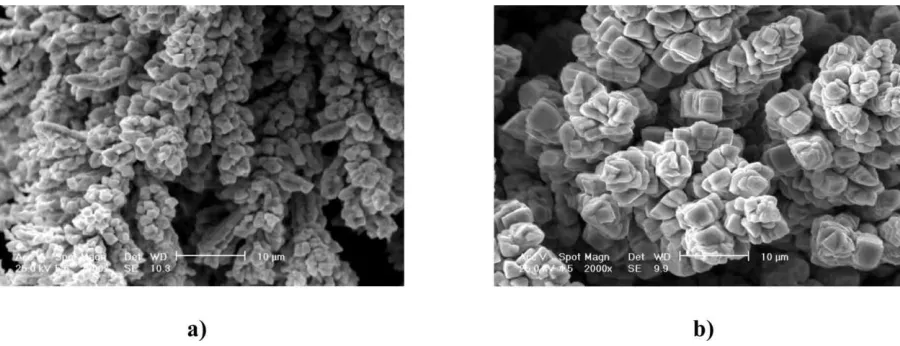
Figure 1. SEM photomicrographs of copper powder particles obtained in constant current deposition. Current density: j=7.71 Adm-2; b) j=10.28 Adm-2; c) j=30 Adm-2; d) j=36 Adm-2
In the powder samples which have been got at lower current density (j= 7.71 and 10.28 Adm-2) were observed both dendrite types: massive dendrites with which the secondary dendritic branches are defined with the low-energy facets [27] as well as ramify 3D dendrite. With increased current density j=30 Adm-2 and j=36 Adm-2 massive dendrites despaired.
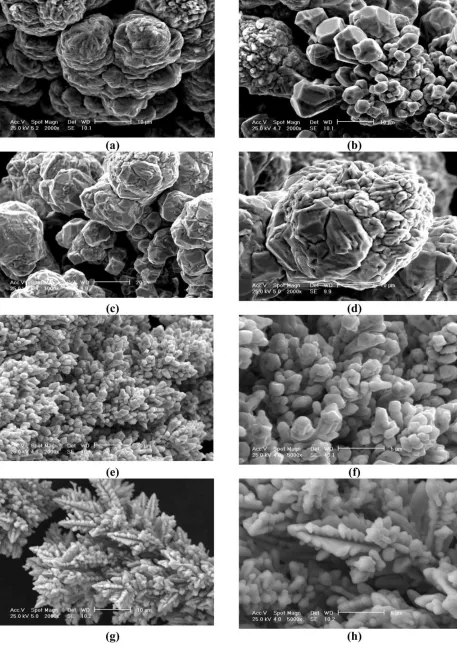
Further careful analysis of the surface morphologies of copper powder particles shown in Fig.3a-h indicated that with the increase of the current density the surface morphology is significantly changed.
At current density of j = 7.71 and j = 10.28 Adm-2 (Figs. 3a,b and 3c,d) are observed polycrystalline faces which are very rough, with a lot of unevennesses so there are ideal conditions for creation of new nucleuses and the crystal growth (mixed activation-diffusion control).
Some dendritic branches of massive dendrites are defined by the flat cubic {100} and octahedral {111} faces (Fig.3b). With increased current density the diffusion control share is also increased, at which particles become more dendritic, with a corn-like (Fig.3e,f) that is a fern-like structure (Fig.3g,h).
[image:5.596.77.524.76.429.2]
Figure 2. SEM photomicrographs of copper powder particles deposited at constant current density; a) j=7.71 Adm-2; b) j=10.28 Adm-2; c) j=30 Adm-2; d) j=36 Adm-2
Typical particle-size distributions of copper powders obtained at four different current densities are shown in Fig.4a. It is observed from Fig.4b that the mean particle-size decreases with increasing of current density. The analysis of in this way obtained results shows that over 50% values are less than 50 µm and that the obtained mean values particle sizes based on cumulative curved distribution (at the point 50%) are within range 52.90 µm and 73.63 µm (Fig.4b). With increased current density the mean particle size decreases. Insignificant deviation with single samples can be explained with unreliabilit y of sieve analysis at powder analysis of smaller granulation (below 50 µm) which is the case with the examined samples containing dendrites of small granulation.
As relevant parameters for describing copper powder particles using quantitative microscope analysis [30,31] were selected: area, perimeter and roundness (roundness is shape factor which unites the area and the perimeter as stereological parameters of structure).
a)
b)
Figure 4. (a) Particle size distribution of copper powders deposited by galvanostatic regime. Histogram obtained by sieved analysis; (b) The effect of change current density on the value of mean particle size
[image:8.596.155.436.73.556.2]Roundness 2.66 2.08 2.18 1.92
RSE (%) 6.70 4.94 3.41 2.29
Perimeter, [µm] 220.13 166.55 113.13 84.19
RSE (%) 10.23 10.6 6.01 5.05
Area, [µm2] 1638.55 1249.91 509.06 336.19
RSE (%) 14.76 14.89 7.98 8.26
Figure 5. The effect of current density on the value of perimeter (galvanostatic regime)
[image:9.596.66.533.105.447.2] [image:9.596.181.408.503.695.2][image:10.596.177.409.318.495.2]
Figure 7. The roundness as a function of current density (galvanostatic regime)
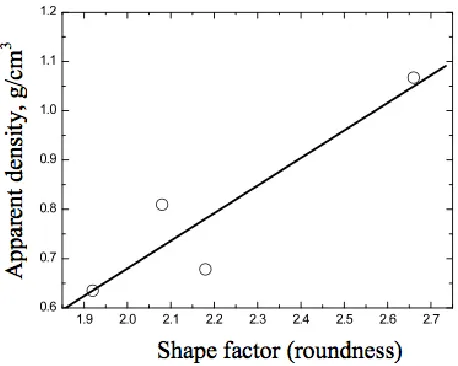
Figure 8. The apparent density as a function of current density (galvanostatic regime)
[image:10.596.180.409.550.733.2]The shape factor – roundness is an especially useful parameter when comparing of powder morphology deposited at potentiostatical and galvanostatical regime is done [17], as well as in the reverse current regime. With the powder samples obtained in the conditions of reverse current, the values of the changes of values of perimeter and area do not follow the linear dependence, as it is case with powders obtained at constant current density [32]. The dependence of the apparent density, (Fig.8.) shows the linear decreasing dependence of current density while the apparent density increases with increase of the shape factor – roundness (Fig.9).
In the case of deposition of powder at constant current, the apparent current density remains constant, but the real current density decreases due to an increased surface of the electrode. This results in a decrease of overpotential of the deposition. A higher decrease of deposition overpotentional means the formation of disperses deposition. With an increase of current density the process is carried out with enlarge diffusion difficulties: a large number of changes in copper powder characteristics appear and a large number of new crystallization centers is formed.
These factors influence an increase of powder particles dispersity and their more dendritic structure. It leads to reduction of particle size and apparent density and to enlargement of specific area [16].
It is known that the proportion of powder metal deposit in the total amount of deposit, as well as the size of the particles in the powder deposit can affect, on one hand, change in the composition of electrolyte, its temperature, viscosity and hydrodynamic regime, and on the other hand selection of deposition regimes (galvanostatic or potentiostatic). If the metal, instead of constant regime, is deposited at a periodically changing rate, new possibilities open up for adjustment of the size and morphology of particles, by varying the wave of periodically changing current or overpotential [1]. From a theoretical point of view of particular importance is pulsating overpotential regime, but for wider application in practice it is more convenient to use a reverse current of square-wave shape.
Induction time for dendritic growth initiation is equal to the transition time in galvanostatic deposition at current densities larger than limiting diffusuion current [21,22,28]. Doubtless, at very beginning of the deposition the dendrites are formed, leading to a strong increase in the real electrode surface area [25], and the real deposition current density and overpotential decrease rapidly [29]. At overpotentials lower than some critical value only compact metal is deposited onto the initial dendritic structure. Due to this the powder particles are not dendritic but corn-like.
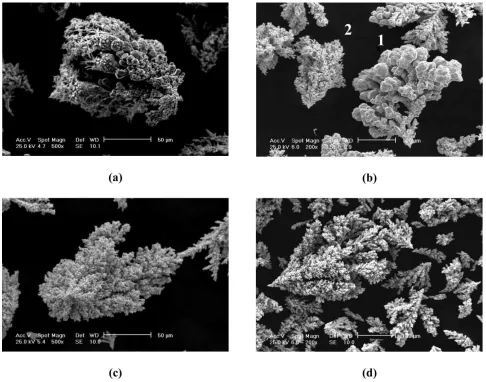
Figure 10. SEM photomicrographs of copper powder particles obtained by reversing currents. Cathodic-to-anodic time ratio 2.5. Cathodic pulse duration 1s. Anodic pulse duration 0.4s. Cathodic (anodic) amplitude current densities and average current densities: a) jc=ja=18 A/dm2,
jav=7.71A/dm2, b) ) jc=ja= 24 A/dm2, jav=10.28 A/dm2, c) jc=ja= 30 A/dm2, jav=12.85 A/dm2
and d) jc=ja= 36 A/dm2, jav=15.42 A/dm2
It was shown [33] that the protrusions characterized by lower tip radii are dissolved faster during anodic pulses than those with larger ones because of the effect of tip radii on the reversible electrode potential [34]. During the DC deposition all the stable nuclei formed in the beginning grow during further deposition; under RC conditions many nuclei are dissolved during the anodic pulses making further growth possible at considerably lower growth sites. In this way an increase in the subparticle size in RC deposition can be expected compared to the DC case. Polycrystalline copper deposits are obtained at overpotentials lower than that critical for dendritic growth initiation but still in diffusion-controlled deposition [24,35]. Hence, this kind of deposit can be expected in prolonged deposition of powder particles because of the decrease in the overpotential, due to the increasing real surface area. In the RC case the anodic current density is activation controlled. It is known that the value of j0 (exchange current density) strongly depends on the crystal orientation [36]. Being different
[image:12.596.78.521.70.424.2]Figure 11. SEM photomicrographs of copper powder particles obtained by reversing currents. Cathodic-to-anodic time ratio 5. Cathodic (anodic) amplitude current density and average current density: a) jc=ja=18 A/dm2, jav=12 A/dm2. Cathodic pulse duration: a) 10s and b) 0.5s
The effect of reversing current time period is illustrated by Fig.11. The net time of dendritic growth increases with the increase in the period of reversing current wave, leading to the more disperse deposit.
The decreased anodic current amplitude exhibits a strong effect on the structure of subgrains, i.e. decreasing anodic amplitude current permits formation of a more disperse structure of subgrains, as coluld be expected from earlier discussion (from well defined crystal planes to polycrystalline ones, Figs. 10,11).
[image:13.596.74.524.68.241.2] [image:13.596.67.278.68.234.2]
Figure 12. Particle size distribution of copper powder particles obtained by reversing currents ( sieve analysis)
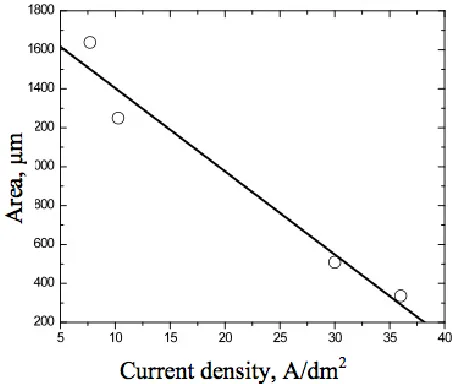
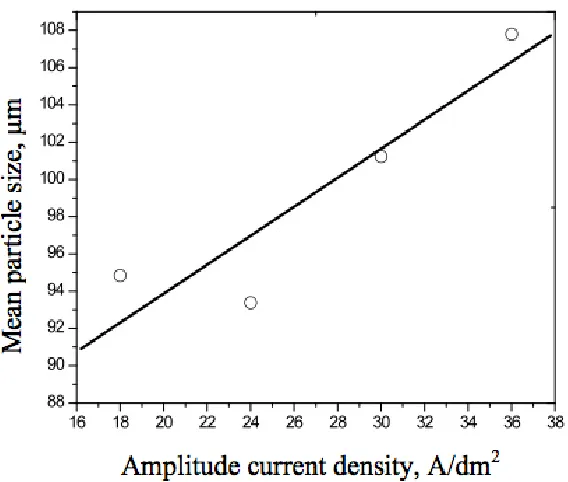
Figure 13. The effect of amplitude current density on the value of mean particle size (reversing current-sieve analysis)
Perimeter change and area do not follow linear pattern with powder samples obtained in reversing current regime, as it was the case in constant current density regime.
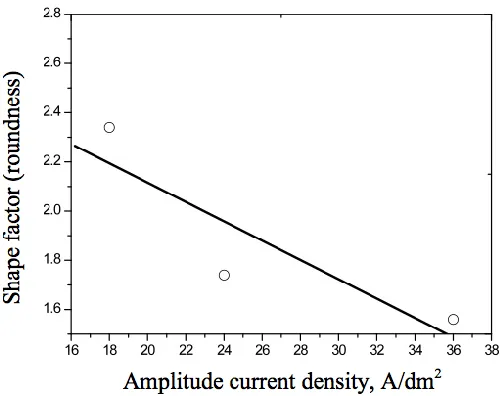
[image:14.596.157.441.361.602.2]Figure 14. The roundness (a shape factor of area) of copper powder particles as a function of amplitude current density (reversing current)
Increase in current density leads to decrease in shape factor of copper powder particles obtained with constant current density and under reversing current regime. Lower values of shape factor that are characteristic for copper powders obtained by reversing electrolyse regime show that dendrites are less elongated.
Figure 15. The apparent density of copper powder particles as a function of amplitude current density (reversing current)
[image:15.596.171.421.74.272.2] [image:15.596.168.421.439.634.2]
particle structure in the direction of increase of particle density (compactness). This leads to increase of apparent density of copper powder, compared to galvanostatic regime (Figures 8 and 15).
4. CONCLUSIONS
The effect of various parameters in DC and RC conditions were investigated. The quantitative microstructural analysis of copper powder as well as the scanning electron microscopy analysis of the copper powders particles were performed. During the DC deposition, with the increase of current density the morphology of copper powder particles is changed from compact, massive dendrites to disperse dendrites with corn-like and fern-like surface ending. At the same time the mean particle size is decreased. All selected parameters are shown linear decreasing dependence of current density. In the RC case, the effects of the current amplitude, cathodic-to-anodic time ratio and period of the current wave are discussed. It is shown that the parameters determining the reversing current wave determine the micromorphology of the copper powder particles deposited. The shape factor – roundness could be useful parameter for describing of powder morphology.
ACKNOWLEDGEMENT
This work was financially supported by Ministry of Science of the Republic of Serbia under the research project "Deposition of Ultrafine Powders of Metals and Alloys and Nanostructured Surfaces by Electrochemical Techniques" (142032G/2006).
References
1. K.I. Popov and M. D. Maksimović: in Modern Aspects of Electrochemistry, Theory of the Effects of Electrodeposition at a Periodically Changing Rate on the Morphology of Metal Deposits, B. E. Conway, J. O’M. Bockris and R. E. White, Eds., Plenum Press, New York, Vol. XIX, 1989, p.193 2. K.I. Popov and M.G. Pavlović in: Modern Aspects of Electrochemistry, Electrodeposition of Metal
Powders with Controlled Particle Grain Size and Morphology, Vol. XXIV, R.W. White, J.O'M. Bockris, B.E. Conway (Eds.), Plenum Press, New York, 1973. p.299
3. R.M.German, Powder Metallurgy Science, 2nd ed., Metal Powder Industries Federation, Princeton, New Jersey, 1994, pp. 15-429
4. M.G. Pavlović and K.I. Popov,Electrochem. Encyclopedia, http://electrochem.cwru.edu/ed/encycl/, 2005
5. A.Despić and K.I.Popov: in Modern Aspects of Electrochemistry, Transport Controlled Deposition and Dissolution of Metals, in: B.E.Conway, J.O'M. Bockris (Eds.), Vol. VII, Plenum Press, New York, 1972. pp.199-313
6. N.D. Nikolić, Lj.J. Pavlović, M.G. Pavlović and K.I. Popov, Powder Technol., 185 (2008) 195 7. V. Mikli, H. Käerdi, P. Kulu and M.Besterci, Proc. Estonian Acad. Sci. Eng., 7 (2001) 22 8. Heon-Cheol Shin, Jian Dong and M. Liu, Adv. Mat. 15 (2003) 1610
9. N.D. Nikolić, K.I. Popov, Lj.J. Pavlović and M.G.Pavlović, Sensors, 7 (2007) 1
Eng. 4 (1998) 3
16. M.G. Pavlović, Lj.J. Pavlović, E.R. Ivanović, V. Radmilović and K.I. Popov, J. Serb. Chem. Soc. 66 (2001) 923
17. V.M. Maksimović, Lj.J. Pavlović, M.G. Pavlović, M.V. Tomić, Journal of Metallurgy, 15 (2009) 1 18. J. Xue, Q. Wu, Z. Wang, and S. Yi, Hydrometallurgy 82 (2006) 154
19. M.G. Pavlović, Lj.J. Pavlović, I.D. Doroslovački, N.D. Nikolić, Hydrometallurgy, 73 (2004) 155 20. ASTM B214-ISO 4497
21. O. Kudra, M.E. Lerner, Ukrain. Khim. Zh. 17 (1951) 890
22. K.I. Popov, M.G. Pavlović and M.D.Maksimović, J.Appl.Electrochem. 12 (1982) 525 23. I. Gucov, Izv. Inst. Fizickochim. Bulg. Akad. Nauk, 4 (1964) 69
24. M.G. Pavlović, K.I. Popov, G.Ţ. Remović, V.P. Komnenić and Ţ.V. Štrbački, Hydrometallurgy, 35 (1994) 267
25. G. Wranglen, Electrochim. Acta, 2 (1960) 130
26. V.M. Maksimović, M.G. Pavlović, Lj.J. Pavlović, M.V. Tomić and V.D. Jović, Hydrometallurgy, 86 (2007) 22
27. Y. Sun, Y. Xia, Science, 298 (2002) 2176
28. O. Kudra and E. Gitman, Elektroliticheskoe Poluchenie Metallicheskiekh Poroshkov, Iz. Akad. Nauk Ukr. SSR Kiev (1952), p.43
29. M.D. Maksimović, K.I. Popov, Lj.J. Jović and M.G. Pavlović, Bull. Soc. Chim. Beograd, 44 (1979) 547
30. R.T. De Hoff and F.N. Rhines, Quantitative Microscopy, Mac Graw Hill Bool Comp., New York, 1968
31. H. Modin and S. Modin, Metallurgical Microscopy, Butterworths, London, 1973
32. M.V. Tomić, V.M. Maksimović, Lj.J. Pavlović, M.G. Pavlović, K.I. Popov, M.J. Gligorićand V.D. Jović, Zaštita materijala, 47 (2006) 25, (in serbian language)
33. K.I. Popov, M.G. Pavlović and G.Ţ. Remović, J. Appl. Electrochem. 21 (1991) 743 34. J.L. Barton and J.O'M. Bockris, Proc. R. Soc. London Ser. A268 (1972) 485
35. K.I. Popov, Lj.J. Pavlović, M.G. Pavlović and M.I. Čekerevac, Surf. Coat. Technol. 35 (1988) 39 36. A. Damjanović, Plating, 52 (1965) 1017
37. K.I. Popov, M.G. Pavlović, M.I. Čekerevac and G.Ţ. Remović, Surf. Coat. Technol. 34 (1988) 355 38. K.I. Popov, S.S. Đokić, B.N. Grgur, Fundamental Aspects of Electrometallurgy, Kluwer
Academic/plenum Publisher, N. York, 2002, p.158.