Int. J. Electrochem. Sci., 6 (2011) 91 - 102
International Journal of
ELECTROCHEMICAL
SCIENCE
www.electrochemsci.org
Influence of Process Parameters on Paste Morphology
in Lead-Acid Battery Cured Plates
M. Mohamed Sharif 1, P. Senthil Kumar1, K. S. N. Murthy1,*, S. Vijayanand1, S. Ambalavanan2 1
Research and Engineering Centre, Amara Raja Batteries Limited (ARBL), Tirupati, Andhra Pradesh, India – 517520
2
Lead-acid battery division, CSIR - Central Electrochemical Research Institute (CECRI), Karaikudi, India - 630006
*
E-mail: [email protected]
Received: 4 October 2010 / Accepted: 30 October 2010 / Published: 1 January 2011
This study aim is to understand the effects of paste preparation process parameters Acid/Oxide ratio, paste peak temperature and curing temperature on establishing the crystal morphology of paste and to optimize the conditions to favor homogeneity and good crystal morphology. Full factorial DoE technique with three factors in three levels was used to design the experiments. The paste prepared as per experiment design was analyzed for surface area using gas adsorption method, for crystal size using scanning electron microscope and analyzed by XRD to confirm the relative proportions of crystals. It was found that paste peak temperature and curing temperature exhibited significant influence in controlling the surface area and crystal growth. While Acid/Oxide ratio having influence in surface area and a effect on crystal distribution.
Keywords: Acid/Oxide ratio, Paste peak temperature, Curing temperature, 3BS, 4BS
1. INTRODUCTION
Lead-acid chemistry is the versatile battery technology in terms of reliability and performance for various end user applications that range from emergency lamp at home to telecom back-up provisions. Each of these applications is unique in their requirements therefore demand different battery designs. In an endeavor to meet such varied and unique requirements, the prima focus lies in having the right plate chemistry
different plate making processes in establishing desired concentration levels of 3BS and 4BS crystals. Pavlov explained the semi-suspension technology to produce 4BS crystals [2]. A.D. Vidal et al [3] emphasized the reactive grinding mechanism for preparing 3BS and 4BS crystals. Vogel [4] described how would the vacuum mixing reduces the interference of climatic changes in paste making process. Further an exclusive method for producing cureless paste is explained by D.P.Boden [5]. Preparation of positive electrode by hydrothermal method was reported J. Morales [6] and D. Pavlov [7].
In addition to the above, use of additives to the paste has also been explored by various authors [8-14]. These additives are studied with an aim to improve the life of plates or to facilitate better active material utilization. In certain cases, additives have also been used with a special focus on to control the paste morphology [15]. In likewise the importance of process parameters to attain 3BS and 4BS crystals as required for a particular application has been studied [16]. Earlier studies however mainly focused on the paste mixing peak temperature and curing temperature. But other important process parameter acid/oxide ratio and its interaction with peak and curing temperatures in morphology establishment and the battery performance was scarcely studied. In this paper the work is devoted to understand how the aforesaid process parameters namely acid/oxide ratio, paste peak temperature and curing temperature (hereafter referred as AO, PT and CT respectively) have been selected for studying their effect on paste morphology.
2. EXPERIMENTATION 2.1. Full factorial design
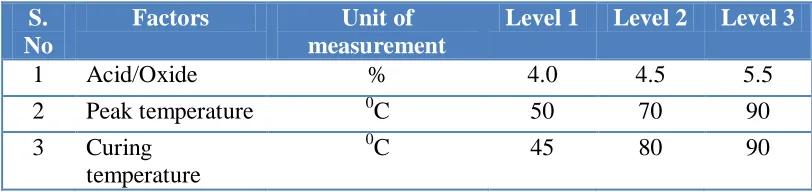
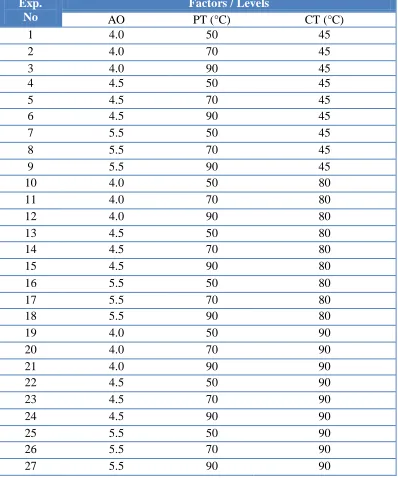
[image:2.596.95.501.666.762.2]The experiment is designed based on a full factorial design with three factors at three levels (DoE - Design of Experiment). The list of factors and levels of the experiment is given in Table.1. These factors are nothing but the selected process parameters whose effects are of interest to understand. The levels are selected in such a way to represent the typical industrial values that are in line with the objective of the present study. The effect of PT (50°C/70°C /90°C)is studied by choosing low temperature curing at 45°C. On the other hand, the influence of curing temperature is studied by choosing low PT i.e. 50°C. The AO is studied at three different ratios, namely 4.0, 4.5, 5.5 as a function of PT and CT. This objective translates into factorial permutations of different experiments as stated in Table.2. Experiments considered for SEM & XRD analysis is shown in the Table.2 as a note
Table 1. Factors and levels considered for DoE
S. No
Factors Unit of
measurement
Level 1 Level 2 Level 3
1 Acid/Oxide % 4.0 4.5 5.5
2 Peak temperature 0C 50 70 90
3 Curing temperature
0
Table 2. Experimental design inline with Full factorial DoE
Exp. No
Factors / Levels
AO PT (°C) CT (°C)
1 4.0 50 45
2 4.0 70 45
3 4.0 90 45
4 4.5 50 45
5 4.5 70 45
6 4.5 90 45
7 5.5 50 45
8 5.5 70 45
9 5.5 90 45
10 4.0 50 80
11 4.0 70 80
12 4.0 90 80
13 4.5 50 80
14 4.5 70 80
15 4.5 90 80
16 5.5 50 80
17 5.5 70 80
18 5.5 90 80
19 4.0 50 90
20 4.0 70 90
21 4.0 90 90
22 4.5 50 90
23 4.5 70 90
24 4.5 90 90
25 5.5 50 90
26 5.5 70 90
27 5.5 90 90
All the above experiments are considered for BET analysis Exp No: 1, 2 and 3 are considered to study the effect of PT Exp No: 1, 10 and 19 are considered to study the effect of CT Exp No: 1, 4 and 7 are considered to study the effect of AO
Exp No: 24 and 27 are considered to study the effect of extreme conditions
2.2. Materials and reagents
2.3. Procedure for plate preparation
The oxide sample was subjected to dry and wet mixing for 2 and 6 minutes respectively in a conventional mixer followed by water and acid additions. The final mixing was done i.e. until the paste temperature falls below 45°C after completion of acid addition. It is to be noted that the desired paste peak temperature is maintained throughout the acid addition. This was achieved automatically for experiments at 50°C peak temperature and with the help of heating for experiments designed at 70°Cand 90°C peak temperatures. The temperature of the paste was monitored using a mercury thermometer.
The paste was pasted onto Lead-calcium grids (50x10x1.5)mm and the plates were subsequently cured at three different conditions such as 45°C, 80°C and 90°C with minimum 95% relative humidity in all the cases and constant curing cycle time was followed.
2.4. Analytical methods:
In the end, plates prepared under different experimental conditions were analyzed for surface area, paste morphology and relative proportion of crystals in it.
2.4.1. Surface area
Surface area is the measure of how much exposed area a solid object has and expressed in square units. It is one of the most vital parameter for characterizing the porous materials and porosity within the material. The Brauner −Emmett−Teller (BET) analysis is used for determining surface area of cured plates. The test samples are analyzed with COULTER SA3100 Model surface area analyzer.
2.4.2. Paste morphology
Scanning electron microscopy (SEM) was used to analyze the morphology of cured plate samples. All samples were sputter coated with a thin layer of gold, ~10 nm in thickness, to reduce charging and improve image quality. Examination was carried out in a HITACHI-S3000N high vacuum model SEM using a working distance of 24 mm, a spot size of 4 or 5, and an electron beam voltage of 10 kV.
2.4.3. Crystal character
Committee for Power Diffraction Studies (JCPDS) files. This is used to validate the presence of various crystals (3BS, 4BS, PbO etc.) and further, relative proportions of these crystals are studied.
3. RESULTS AND DISCUSSION 3.1. Surface area
The surface area of cured plates has a vital role on the battery performance. For example, higher surface area would accelerate the process of acid diffusion not only into the plate but also within it, thereby improving the high rate performance of the battery and vice versa. In high current applications, the available surface of the electrodes becomes important and is diffusion limited by the amount of acid that can freely flow into the porous material to react with the inner active sites [25]. While paste formulation is chosen critically as to obtain required porosity within the plate, the process parameters do have an impact on the surface area.
Therefore, understanding the influence of process parameters on the surface area assumes a greater significance.
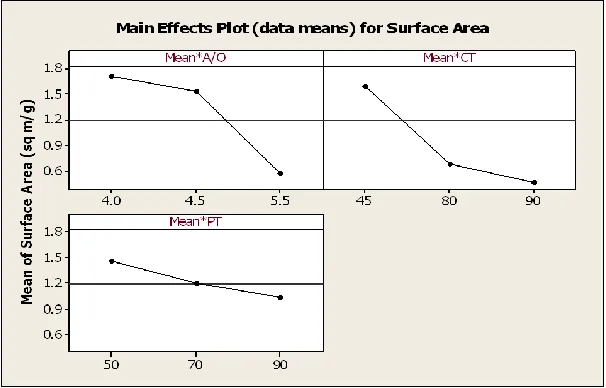
3.1.1. Influence of Process Parameters
[image:5.596.147.450.539.733.2]The effects of AO, PT and CT on the surface area are studied as designed in the Table.2 with the help of Minitab software (14.12.1) and are depicted in (Fig.1). As evident from plot, the surface area gets reduced with increasing AO ratio. This may be attributed to the increase in the formation of “Sulphates of Lead which are bulkier than PbO”, with increased acid quantities. In view of the fact that plate is of constant volume and the bulkier lead sulphates would occupy more space and the available pore volume is reduced with a proportional decrease in surface area. .
The reduced surface area is also evident when either paste peak temperature or curing temperature is increased but the influence of paste peak temperature has observed to be modest. While the reduction in surface area with increase in curing temperature can be attributed to the growth of 3BS/4BS, the less pronounced effect of paste peak temperature is for reasons that exposure to such a high temperature is only for a short duration.
3.2. Paste Morphology
The nature of crystals formed during either pasting or curing exhibit a profound influence on the plate composition after formation and hence pasting/curing processes assume a greater significance in the battery manufacturing activity [7]. The two most important and critical crystallographic precursors that subsequently govern the quality of formation are 3BS and 4BS [19]. The earlier studies [20] indicate while the plate with 3BS yields higher capacity and 4BS provides higher cycle life. Hence, pasting and curing often go hand in hand to produce batteries with desired performance levels. .
In the present study, paste morphology is looked at from view point of crystal type (4BS/3BS), crystal growth- specifically its length (µm), phase distribution and finally packing intensity.
As to have a better and deeper understanding, the following section is dealt with understanding the role that is played by each of the process parameters, namely PT, CT and AO. The inter-relation of these parameters on the paste morphology is then understood.
3.2.1. Influence of paste peak temperature
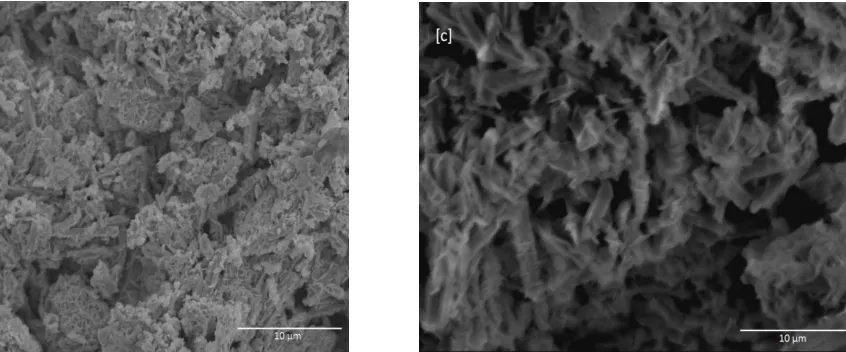
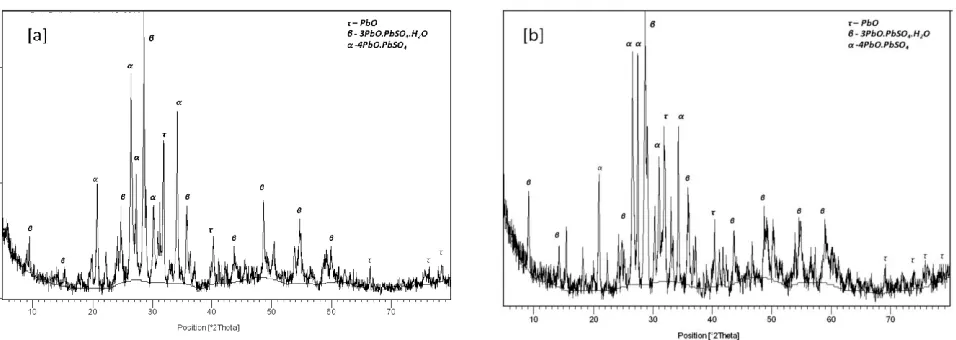
The first set of experiment done at (4.0 AO-50°C PT and 45°CT.) was analyzed for morphology. The SEM micrograph reveals uniformly distributed crystals of 3BS (Fig2a). The XRD results (Fig3a) corroborate the considerable existence of peaks corresponding to 3BS, PbO and lesser amount of 4BS.
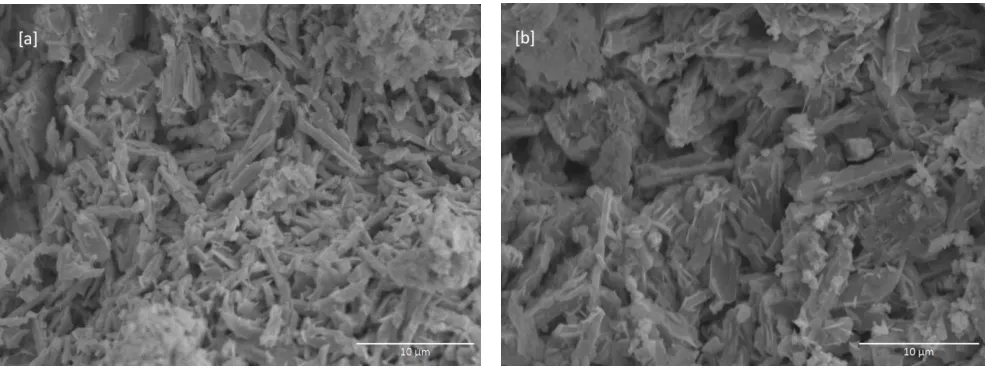
[image:7.596.106.529.70.246.2]
Figure 2. SEM Image: 4.0 AO paste (a) mixed at 500C PT (b) mixed at 70°C PT. (c) mixed at 90°C PT and cured at 450C.
As discussed, an important aspect of the present study is to see whether significant concentrations of 4BS can be achieved with higher paste peak temperatures, if so what would be the need for adopting higher curing temperatures, particularly when long life is a prerequisite. For this purpose, the study is performed at two different peak temperatures, namely, 70°C and 90oC. It is to be noted that curing temperature is maintained at 45°C so as to nullify the role of curing temperature on 4BS formations and therefore having a better understanding of the PT effect on 4 BS.
It is noteworthy that there exists significant amount of 4BS along with 3BS crystals in case of higher PT (70°C or 90°C) (Fig2b & 2c) even curing is performed at much lesser temperature i.e. 45oC.
The XRD shows the peaks corresponding to both 3BS and 4BS as depicted in (Fig3b & 3c). The dominance of a particular crystal type depends on the peak temperature.
Figure 3. XRD patterns: 4.0 AO paste (a) mixed at 500C PT(b) mixed at 70°C PT. (c) mixed at 90°C PT and cured at 450C.
3.2.2. Influence of curing temperature
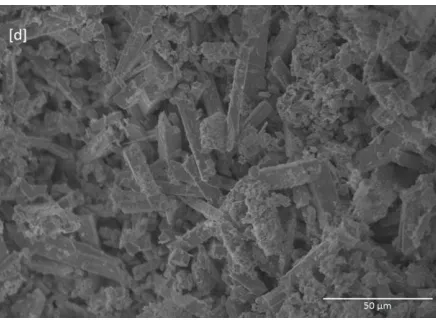
Another important process variable in lead acid battery manufacturing is curing temperature. The curing temperature and humidity play a vital role in governing the paste morphology. The micrographs obtained when curing temperature is increased to 80°C and 90°C with respect to first set experiment (Fig 2a) are presented in (Fig 4). Further, XRD pattern shows predominantly 4BS with traces of 3BS (Fig 5). As in case of paste peak temperature above 70°C, presence of 4BS crystals is evident when the curing is carried out at 80°C or 90°C. Nevertheless, two distinctions observed are crystal distribution and its size between high PT and high CT experiments (2c & 4b). The length of crystals is observed to be longer at high temperature curing. It can be attributed to such a long time exposure in the high temperature environment. In Fig 6d, a combination of both high PT and CT shows a well grown 4BS and small amount of 3BS.This is as well reflected in XRD as shown in Fig 7b.
[image:8.596.52.545.524.709.2]
Figure 5. XRD patterns: 4.0 AO paste mixed at 500C PT and (a) cured at 800C. (b) cured at 90°C
The results clearly indicate the profound influence of temperature either pasting or curing on the paste morphology and in agreement with earlier findings that the paste consisting of 3BS preferentially formed when cured below 60°C [17&21] and 4BS being the dominant at higher curing temperatures [17&18].
3.2.3. Influence of acid/oxide ratio
The influence of AO ratio with respect to PT and CT is less understood and scarce in the literature. It is with this objective, the present study is performed with two more levels of AOs (4.5 and 5.5) keeping pasting and curing conditions as in case of first set of experiments.
Reviewing the results in retrospect, i.e. results obtained for three AO ratios, it is learnt that AO ratio has significance as far as 4BS and 3BS crystal size is concerned. While 3BS crystals are smaller at 5.5 AO, they happened to be bigger while moving to lower AO i.e. 4.0. This is in line with the findings of Pavlov [22] that higher AO will reduce the size of 3BS crystals. On the contradictory, the size of 4BS increases with increased AO [18].
[image:9.596.61.539.73.243.2][image:10.596.326.544.68.228.2]
Figure 6. SEM Image: (a) 4.5 & (b) 5.5 AO paste mixed at 500C PT and cured at 450C. (c) 4.5 & (d) 5.5 AO mixed at 90°C PT and cured at 90°C.
Figure 7. XRD patterns: (a) 4.5 & (b) 5.5 AO paste mixed at 90°C PT and cured at 90°C.
Another major distinction observed is close packing of 3BS/4BS which increased with increase in AO ratio (Figs. 6a-6d). Further, XRD diffraction pattern as given in Fig 7b shows predominance of 4BS when a paste of AO 5.5 is mixed at 90°C and subsequently cured at 90°C. This is obviously for a reason that ample availability of sulphuric acid facilitating 4BS formation. The reduced surface area at higher AO (Fig.1) further indicates the presence of 4BS.
4. CONCLUSIONS
The effects of three process parameters namely acid/oxide ratio, paste peak temperature and curing temperature on establishing the morphology of pastes were studied through BET,SEM and XRD analysis.
[image:10.596.56.533.319.496.2]
The surface area of cured plate reduced with increased AO ratio. This eventually resulted in tightly packed crystal structure. The higher PT and CT have shown a similar effect though the effect of PT has observed to be modest.
The PT has a remarkable effect on crystal morphology. Higher PT resulted in the formation of 4BS crystals, though small in size when compared to an equivalent curing temperature.
The effect of CT is clearly perceptible that lower curing temperatures i.e. 45°C yield predominantly 3BS.
On the other hand, higher curing temperatures i.e. 80°C and 90°C yielded 4BS predominantly, the crystal size increased with curing temperature. Further, the crystal distribution is observed to be homogeneous unlike in case of high temperature PT.
The higher AO results in increasing the quantity of 4BS under favourable PT and CT conditions
The study reveals the importance of judicious selection of process parameters as to obtain the most favorable battery performance for a given application.
ACKNOWLEDGEMENT
The authors wish to acknowledge the staff in Central Instrumentation Facility division & Management of CSIR - CECRI, the technical professionals in R&D chemical lab & Management of ARBL for providing funding and other facilities for this project.
References
1. D. Pavlov and N. Kapkov, J. Electrochem. Soc., Volume 137, Issue 1, p. 16-21 (1990) 2. D. Pavlov, J. Power Sources 95 (2001) 191-202
3. A. Delahaye-Vidal et al, J. Power Sources 72 (1998) 126–131 4. H. J. Vogel, J. Power Sources 53 (1995) 269-271
5. David P. Boden., J. Power Sources 168 (2007) 90–94 6. J. Morales, J. Power Sources 157 (2006) 579–583
7. D. Pavlov and N. Kapkov , J. Electrochem. Soc., Volume 137, Issue 1, pp. 21-28 (1990) 8. Jenn-Shing Chen, J. Power Sources 90 (2000) 125–134
9. R. David Prengaman, J. Power Sources 144 (2005) 426–437 10.Troy C. Dayton, J. Power Sources 85 (2000) 137–144 11.Francis Chenga, J. Power Sources 173 (2007) 882–886 12.Dean B. Edwards.J.Power Sources 135 (2004) 297–303 13.G. Zguris. J. Power Sources 133 (2004) 39–46
14.Yu.Kamenev et al, J. Power Sources 114 (2003) 303-308 15.David P. Boden. J. Power Sources 158 (2006) 1133–1139
16.D.Pavlov, Essential of Lead-Acid batteries, 2006, Society for Advancement of Electrochemical Science and Technology
17.W.R. Kitchens a, R.C. Osten a D.W.H. Lambert b J.Power Sources 53 (1995) 263-267 18.D. Pavlov, M. Dimitrov, T. Rogachev, L. Bogdanova J.Power Sources 114 (2003) 137-159 19.C.H. Yeh et al, J. Power Sources 101 (2001) 219-225
20. D.A.J. Rand et al, Valve regulated lead acid batteries, 2004, Elsevier publications. 21.Jenn-Shing Chen , L.F. Wang, J. Power Sources 70 (1998) 269-275
23.D.Pavlov and V Elektrokhimiya, 11 (1975) 1627
24.L. T. Lam, O. Lim, H. Ozgun and D. A. J. Rand, J. Power Sources, 48 (1994) 83-111 25.H. Bode, Lead Acid Batteries, Wiley, New York, 1977, pp. 189–191.
26.H.-J. Vogel, Journal of Power Sources 53 (1995) 269-271