Int. J. Electrochem. Sci., 6 (2011) 4700 - 4713
International Journal of
ELECTROCHEMICAL
SCIENCE
www.electrochemsci.org
Electron Transfer of Co-immobilized Cytochrome
c
and
Horseradish Peroxidase in Chitosan-Graphene Oxide Modified
Electrode
Lingli Wan, Yonghai Song*, Haozhi Zhu, Yu Wang and Li Wang
College of Chemistry and Chemical Engineering, Jiangxi Normal University, 99 Ziyang Road, Nanchang 330022, People’s Republic of China
*
E-mail: yhsong20048@hotmail.com
Received: 31 July 2011 / Accepted: 2 September 2011 / Published: 1 October 2011
Cytochrome c (Cyt c) and horseradish peroxidase (HRP) were co-immobilized on graphene oxide (GO)-chitosan (CHIT) modified Au electrode and the electron-transfer between the two proteins was investigated. The GO-CHIT nanocomposite was assembled on an Au electrode which covered by a mixed self-assembled monolayer of mecraptoundecanoic acid (MUA) and 6-mercapto-1-hexanol (MCH) and coated with Cyt c. The GO-CHIT nanocomposite as a novel electrochemical platform designed by combining the biocompatibility of CHIT and the conductivity of GO was used for the immobilization of the redox enzymes. Based on electrostatic interactions, the Cyt c-HRP/GO-CHIT/Cyt c/MUA-MCH/Au electrode was constructed by a layer-by-layer technique. Electron transfer and electrocatalytic performances of the modified electrode were investigated. Results showed that direct electron transfer has been established for the bi-protein system and the average rate constant of electron transfer ks, (Cyt c - HRP) =2.63 s-1 was larger than those values at the electrodes modified with
single protein (ks, (Cyt c) =1.44 s-1, ks, (HRP) =1.53 s-1). The bi-protein modified electrode exhibited good
electrocatalytic response to reduction of oxygen (O2) and hydrogen peroxide (H2O2), suggesting that a
third-generation biosensor could be obtained for the detection of O2 and H2O2.
Keywords: Electron transfer; Cytochrome c; Horseradish peroxidase; Graphene oxide; Electrochemistry
1. INTRODUCTION
enhancing the sensitivity of biosensor. To achieve this aim, proteins immobilized on vertically aligned carbon nanofibers [11] and protein multilayers within a ployelectrolyte [12, 13] and DNA [14] by layer-by-layer arrangement have been developed. However, in thicker films or multilayers, generally only protein molecules near the electrode surface are electroactive.
Recently, many efforts were focused on the enlargement of the signal in biosensor by constructing artificial signal chains [15-17]. For example, a novel amperometric biosensor based on the simultaneous entrapment of acid phosphatase (AcP) and polyphenol oxidase (PPO) into anionic clays was developed for the specific detection of As(V) [15]. The functioning principle of the bi-protein electrode consisted of the successive hydrolysis of phenyl phosphate into phenol by AcP, followed by the oxidation of phenol into electro-active o-quinone by PPO. The detection of As(V) was based on its inhibitory effect on AcP activity toward the hydrolysis of phenyl phosphate into phenol. Another novel biosensor was made by simultaneous immobilization of glucose oxidase (GOD) and horseradish peroxidase (HRP) in an electropolymerized pyrrole (PPy) film on a single-wall carbon nanotubes (SWNT) coated electrode for glucose detection [17]. In this construction, the glucose could be oxidized into gluconic acid by GOD, followed by the reduction of O2 into H2O2, which could be
further reduced into H2O by HRP. A new type of signal chain based on the mixed proteins consisted of
cytochrome c (Cyt c) and blue copper enzyme has been developed [18-21]. Cyt c is a basic redox heme protein comprising only 104 amino acids and plays an important role in the living organisms by receiving electrons from Cyt c reductase and delivering them to Cyt c oxidase [22, 23]. As a well-characterized electron-transfer protein, Cyt c has been used extensively as a test system for direct electron transfer (DET) of redox proteins or for communication in a protein stack by assembling it with other proteins in a matrix [24-26]. The DET is known to be strongly dependent upon a combination of interfacial electrostatic and chemical interactions. In the new type of signal chain based on the mixed proteins consisted of Cyt c and blue copper enzyme, the electron produced in which the blue copper enzyme catalyzed the substrate could transfer to electrode by Cyt c. The signal chain is formed by the electron transfer between proteins. The studies prove that it is possible to assemble Cyt c and blue copper enzyme directly through layer-by-layer technique and will stimulate progress in the multilayer design of even more complex biomimetic signal cascades that take advantage of direct communication between proteins.
electron-transfer properties. Moreover, under the design of co-immobilization, a great enhancement of electron transfer was achieved.
2. EXPERIMENTAL
2.1. Reagents
Cytochrome c (Cyt c, 98%), horseradish peroxidase (HRP, type X, 250 units mg-1) and chitosan (CHIT, 75% deacetylation), 11-mecraptoundecanoic acid (MUA, 95%) and 6-mercapto-1-hexanol (MCH, 97%) were purchased from Sigma and used as received. Graphite power (99.95%, 325 mesh) was purchased from Aladdin and used as received. The other reagents were purchased from Beijing Chemical Reagent Factory (Beijing, China) and were of analytical reagent grade. A series of phosphate buffer solution (PBS, 0.2 M) were prepared by mixing solution of 0.2 M Na2HPO4 and 0.2 M
NaH2PO4 and used as supporting electrolyte. All solutions were prepared with ultra-pure water purified
by a Millipore-Q System (18.2 M cm). A Cyt c solution (400 μM) and HRP solution (75 μM) were prepared in 0.2 M PBS (pH 7.0).
2.2. Preparation of GO-CHIT nanocomposite
Synthesis of GO: GO was synthesized according to previous methods [35]. Briefly, graphite powder (1.0 g) was dispersed into 23 mL concentrated H2SO4 (18.0 M) in ice bath. Then, KMnO4 (3.0
g) was gradually added into above solution under continuous vigorous stirring at the temperature below 20 °C. After that, the ice bath was replaced by an oil bath and the mixture was heated to 35 °C for 30 min under continuous stirring. Then, ultra-pure water was slowly added into above solution, which produced a rapid increase in solution temperature up to a maximum of 100 °C. The reaction was maintained at 98 °C for a further 15 min, and terminated by sequential addition of more distilled water (140 mL in total) and H2O2 (30%, 10 mL). The solid product was separated by centrifugation at 5000
rpm and washed initially with 5% HCl until SO42- ions were no longer detectable with BaCl2. Finally,
the solid product was washed three times with acetone and dried overnight at 65 °C.
Synthesis of GO-CHIT nanocomposites: GO-CHIT nanocomposite was prepared as followed [36]. GO was dissolved in 20 mL of ultra-pure water and treated with ultrasound for 45 min. CHIT solution of 1.0 wt % was prepared by dissolving CHIT in 0.5 vol% aqueous acetic acid solution. Then GO solution was added into the CHIT solution and stirred for 24 h to produce a homogeneous GO-CHIT solution.
2.3. Preparation of the HRP-Cyt c/GO-CHIT/Cyt c/MUA-MCH/Au electrode
solution was casted onto the surface of MUA-MCH modified electrode and the resulted electrode was kept at 4 ºC for 4 h. After it was rinsed by ultra-pure water, 5 μL of GO-CHIT nanocomposite (1.0 mg/mL) was dropped on the Cyt c/MUA-MCH/Au electrode and the resulted electrode was kept at 4 ºC for 4 h. Subsequently, it was rinsed by ultra-pure water. Finally, 5 μL of Cyt c-HRP mixture with different ratio (nCyt c/nHRP) was dropped onto the GO-CHIT/Cyt c/MUA-MCH/Au electrode to
construct the Cyt c-HRP/ GO-CHIT/Cyt c/MUA-MCH/Au electrode. The procedure for the modified electrode construction was shown in Fig. 1. When the resulted electrodes were not in use, they were stored at 4 ºC.
Au
HS-(CH2)10COOH
HS-(CH2)5CH2OH
NH3+ NH3+ +H
3N +H
3N
NH3+ NH3+ +H
3N +H
3N
NH3+ NH3+ +H
3N +H
3N
NH3+ NH3+ +H 3N +H 3N +H 3N +H 3N
NH3+ NH3+ +H
3N +H
3N
NH3+ NH3+ +H
3N +H
3N
NH3+ NH3+
NH3+ NH3+ +H
3N +H
3N
Cyt c: GO-CHIT: Cyt c-HRP:
S O -C O S S O -O -C O
S O -S O -C O S S O -O -C O S O -C O S S O -O -C O
S O -S O -C O S S O -O -C S -O C O S S -O -O C O S -O S -O C O S S -O -O C +H 3N +H 3N
NH3+ NH3+ +H
3N +H
3N
NH3+ NH3+ +H
3N +H
3N
NH3+
NH3+ S
-O C O S S -O C O S -O S -O C O S S -O -O C e -e -HRP:
Figure 1. Schematic representation of the construction procedure for the Cyt c-HRP/GO-CHIT/Cyt c/MUA-MCH/Au electrode and the direct electron transfer between immobilized bi-protein and the underlying Au electrode.
2.4. Preparation samples for UV-vis spectroscopy
A quartz substrate was cleaned by firstly immersed in a solution of H2SO4 (98%, w/v) and
H2O2 (30%, w/v) with a volume ratio of 7/3 for 30 min. Then, it was flushed with ultra-pure water and
dried in air at room temperature. After that, the same amount of cyt c , HRP and the mixture of cyt c and HRP were dropped on three quartzs respectively and kept at 4 ºC for 4 h.
2.5. Apparatus
[image:4.596.82.511.233.515.2]
as the auxiliary electrode, a bare or modified Au electrode as the working electrode, and a saturated calomel electrode (SCE) as the reference electrode. The cyclic voltammetric experiments were performed in a quiescent solution. The amperometric experiments were carried out in a continuous stirring solution using a magnetic stirrer. UV–vis spectra were obtained by using a Lameda35 UV–vis spectrometer.
3. RESULTS AND DISCUSSION
3.1. Spectroscopic analysis of the interaction between the proteins of Cyt c and HRP
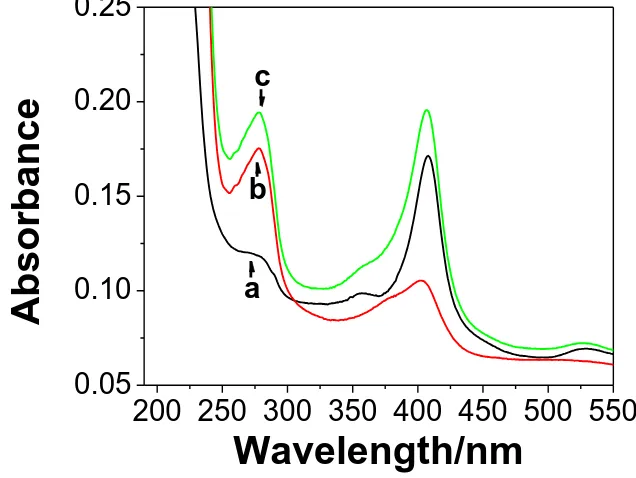
UV–vis absorbance spectroscopy is usually employed to characterize the conformational change of protein and the interaction between protein and other composition [37]. Fig. 2 shows the UV-vis spectra of Cyt c (curve a), HRP (curve b) and the mixed proteins (curve c) immobilized in GO-CHIT nanocomposite on a quartz substrate. It can be seen that each of them has an absorption peak at about 280 nm which is the absorption of the conjugated double bond in the residue of aromatic amino acids (such as tyrosine, tryptophan, phenylalanine) in the protein.
200 250 300 350 400 450 500 550
0.05
0.10
0.15
0.20
0.25
c
b
a
Ab
sorb
anc
e
Wavelength/nm
Figure 2. UV-vis spectra of Cyt c (a), HRP (b), and Cyt c-HRP (nCyt c/nHRP=32:9) (c) on GO-CHIT
modified quartz slide at room temperature.
[image:5.596.135.453.386.625.2]
Soret bond [38]. Thus the blue shift (from 410 nm to 408 nm) of Soret bond indicated that Cyt c was strongly adsorbed on the quarz. The HRP has two characteristic absorption bands at about 402 and 527 nm (curve b in Fig. 2), respectively. After these two proteins were co-immobilized on GO-CHIT nanocomposite, the two adsorption bands were observed at 406 and 527 nm, respectively (curve c in Fig. 2). Furthermore, these adsorption bands were obviously enhanced, especially at Soret bond. The intensity of Cyt c at Soret bond has some connection with the dipole moment of transition produced by the π-π* at the porphyrin ring [39], and accordingly the change of the symmetry properties of the porphyrin ring originated from the change of the conformation of the protein would do effect on the intensity at Soret bond. The change of the symmetry properties of the porphyrin ring would do effect on the change of the coordination in axial direction of the heme and then influence the microenvironment of the heme. The adsorption of the mixed proteins has a blue shift (from 408 nm to 406nm) at Soret compared to Cyt c. These results suggested that the interaction between Cyt c and HRP resulted in the change of the conformation of the proteins.
3.2. Electrochemical behaviors of the bi-protein modified electrodes
Fig.3 shows the cyclic voltammograms (CVs) of the different electrodes in 0.2 M nitrogen-saturated PBS (pH 7.0) at a scan rate of 100 mV s-1. No redox peak was observed at the MUA-MCH/Au electrode (curve f in Fig. 3).
-0.2
-0.1
0.0
0.1
0.2
-450
-300
-150
0
150
300
450
f
e
d
c b
a
a Cyt c-HRP/GO-CHIT/Cyt c/MUA-MCH/Au
b Cyt c/GO-CHIT/Cyt c/MUA-MCH/Au
c HRP/GO-CHIT/Cyt c/MUA-MCH/Au
d GO-CHIT/Cyt c/MUA-MCH/Au
e Cyt c/MUA-MCH/Au
f MUA-MCH/Au
I/
nA
E vs SCE/V
[image:6.596.120.482.427.698.2]
A pair of quasi-reversible peak with a peak-to-peak separation (ΔEp) of 66 mV was obtained
for the Cyt c/MUA-MCH/Au electrode (curve e in Fig. 3), which suggests that Cyt c is a good protein for electron transfer and can be used as a test system for direct electron transfer (DET) of redox proteins or for communication in a protein stack by assembling it with other proteins in a matrix [23-25]. After the GO-CHIT nanocomposite adsorbed on the Cyt c/MUA-MCH/Au electrode, the GO-CHIT/Cyt c/MUA-MCH/Au electrode (curve d in Fig. 3) showed a pair of stronger redox peak and the current was increased as compared to the Cyt c/MUA-MCH/Au electrode, suggesting that the electron transfer was promoted by the GO-CHIT nanocomposite. It was noticeable that after the Cyt c and HRP were co-immobilized on the GO-CHIT/Cyt c/MUA-MCH/Au electrode, the peak current of Cyt c-HRP /GO-CHIT/Cyt c/MUA-MCH/Au electrode increased obviously and the ΔEp reduced to 71 mV (curve
a in Fig. 3). As a control experiment, two other electrodes modified with single protein, either Cyt c or HRP, were constructed in the same way and their electrochemical behaviors (curves b, c in Fig. 3) were investigated. Results showed that the peak currents for the two electrodes were much smaller and the ΔEp were larger than the bi-protein electrode. It was confirmed that the co-immobilized Cyt c and
HRP has greatly promoted the electron transfer between proteins and electrode, possibly due to the interaction between Cyt c and HRP, resulting in a favorable orientation of protein molecules which was helpful for its DET.
The effect of scan rate on the electrochemical behaviors of bi-protein electrode was investigated (Fig. 4). Fig. 4A shows the CVs of the electrode of Cyt c-HRP /GO-CHIT/Cyt c/MUA-MCH/Au (nCyt c/nHRP=32:9) in 0.2 M PBS (pH 7.0) at different scan rates. It could be seen that both
anodic and cathodic peak currents were linearly proportional to the scan rate in the range from 50 to 900 mV s-1 (Fig. 4B).
-0.2 -0.1 0.0 0.1 0.2
-1500 -1000 -500 0 500 1000 1500
-0.25 -0.20 -0.15 -0.10 -0.05 -0.10 -0.05 0.00 0.05 0.10 0.15 D
R2=0.9911 R2=0.9928
E pc Epa Ep e a k v s S C E /V
log(/V s-1 )
-1.5 -1.2 -0.9 -0.6 -0.3 0.0 -0.06 -0.03 0.00 0.03 0.06 0.09 0.12C Epc Epa
Epea
k v s S C E /V
log(/V s-1
)
0.0 0.2 0.4 0.6 0.8 1.0
-1500 -1000 -500 0 500 1000 1500 B
R2=0.9993 R2=0.9999
ipc i pa I/ n A
/V s-1
50 900
A
I/n
A
E vs SCE/V
Figure 4. (A) CVs of the Cyt c-HRP/GO-CHIT/Cyt c/MUA-MCH/Au electrode at different scan rates (from inner to outer 50, 100, 150, 200, 250, 300, 350, 400, 450, 500, 550, 600, 650, 700, 750, 800, 850 and 900 mV s-1) in 0.2 M PBS (pH 7.0). (B) Plot of ipeak versus scan rate (υ), (C) Plot
[image:7.596.135.460.477.692.2]
This suggested the electrochemical behaviors of co-immobilized proteins was typical of a surface-controlled quasi-reversible process. Using Laviron’s expressions for the surface-confined electroactive species, it is possible to determine the apparent electron transfer rate constant (ks) as well
as the transfer coefficient (α) between the mixed proteins and the underlying electrode. For this purpose changes of the anodic and cathodic peak potential were studied versus the logarithm of scan rates (as shown in Fig. 4C). It can be seen that, with the increasing of scan rates, the oxidation peak shifts to more positive potentials, while the reduction peak shifts to more negative potentials. Fig. 4D shows that when the scan rates changed from 600 mV s−1 to 900 mV s−1, the values of Ep were
proportional to the logarithm of the scan rate which is in agreement with the Laviron’s theory [41]: a plot of Ep versus logυ yields two straight lines with slopes of -2.3RT/αnF and 2.3RT/(1-α)nF for the
cathodic peak and for the anodic peak, respectively. Thus the average value of α could be estimated as 0.61 which was used in the subsequent studies. Under these conditions the average kinetic parameter ks
could be obtained as 2.63 s-1 according to equation ks=αnFυ/RT [41].
Table 1. Some important parameters for various resulted gold electrodes.
Various resulted electrodes ΔEp(mV) ipa (nA) ipc (nA) ks (s-1)
Cyt c-HRP/GO-CHIT/Cyt c/MUA-MCH/Au 71 424 -403 2.63
Cyt c/GO-CHIT/Cyt c/MUA-MCH/Au 75 347 -369 1.44
HRP/GO-CHIT/Cytc/MUA-MCH/Au 78 332 -319 1.53
For Cyt c/GO-CHIT/Cyt c/MUA-MCH/Au and HRP/GO-CHIT/Cyt c/MUA-MCH/Au electrodes, the values of ks (ks,Cyt c=1.44 s-1 and ks,HRP=1.53 s-1 respectively) estimated in the same way
are obviously smaller than that of the mixed proteins modified electrode. The larger value of ks of
mixed proteins indicates that the co-immobilized proteins show good reversibility of the electron transfer process. Some important parameters were also summarized in Table 1. The co-immobilized electrode has a larger value of ks, (Cyt c - HRP) might be ascribed to the following factors. First, the
electron transfer rate (ks) of the two proteins was strongly dependent on their conformation at the
electrode surface. The interaction between HRP and Cyt c might result in an optical conformation to facilitate electron transfer. Second, the electron produced from one protein could transfer to electrode surface by the other protein. Last, the interaction between HRP and Cyt c might result in porous structure, which was helpful for the diffusion of electrolyte between proteins and electrode surface, which might improve the electron transfer.
The ratio of Cyt c and HRP on GO-CHIT nanocomposite played an important role in electron transfer between mixed proteins and underlying electrode. As shown in Fig. 5, a remarkable change of peak currents was observed as the ratio of nCyt c/nHRP varied from 16/9 to 16/1. The peak current of the
co-immobilized proteins increased gradually with the increase of nCyt c/nHRP ratio and reached the
maximum at 16:3. When the ratio of nCyt c/nHRP continued to further increased, the peak current turned
electrode was fastest. The phenomenon may be ascribed to the following factor. When HRP get in touch with Cyt c, Cyt c had a change in the coordination in axial direction of the heme and then changed the microenvironment of the heme which was a favorable conformation for electron transfer.
16/9 8/3 32/9 16/3 8/1 32/3 16/1
-600
-400
-200
0
200
400
600
i
pc
i
pa
I
peak/nA
n
[image:9.596.134.466.151.399.2]Cyt c
/n
HRPFigure 5. Effect of the ratio of nCyt c / nHRP (16:9, 8:3, 32:9, 16:3, 8:1, 32:3, 16:1 ) on the redox peak
current of the Cyt c-HRP/GO-CHIT/Cyt c/MUA-MCH/Au electrode in 0.2 M PBS (pH 7.0) at room temperature. Scan rate: 100 mV s-1.
3.3. Electrocatalysis of the bi-protein modified electrode toward H2O2 and O2
The electrocatalytic behaviors of the co-immobilized Cyt c and HRP modified electrode towards oxygen (O2) and hydrogen peroxide (H2O2) were investigated. The Cyt c-HRP/GO-CHIT/Cyt
c/MUA-MCH/Au electrode showed a good electrocatalytic property to reduction of O2 as shown in
Fig. 6A. When the scan rate was 5 mV s-1, a small current was observed in 0.2 M PBS of pH 7.0 in the presence of N2 (curve a in Fig. 6A). However, the peak current obviously increased in the presence of
air (curve b in Fig. 6A) and O2 in 0.2 M PBS of pH 7.0 (curve c in Fig. 6A). The experiment showed
the dependence of the reduction current on the oxygen content in solution at low scat rate, suggesting the constructed Cyt c-HRP/GO-CHIT/Cyt c/MUA-MCH/Au electrode could be used to electrocatalyze the reduction of O2.
Fig. 6B showed the bioelectrocatalytic response of Cyt c-HRP/GO-CHIT/Cyt c/MUA-MCH/Au electrode towards H2O2 in 0.2 M PBS (pH 7.0). It could be seen that with the increasing of
H2O2 concentration (varied from 0 mM to 0.03 mM ), the reduction peak current increased obviously,
-0.4 -0.3 -0.2 -0.1 0.0 0.1 0.2
-5 -4 -3 -2 -1 0 1
A
c b
a
I/
A
E vs SCE/V
-0.2
-0.1
0.0
0.1
0.2
-200
-150
-100
-50
0
50
100
B
c
d
b
a
I/
n
A
E vs SCE/V
Figure 6. (A) CVs of the Cyt c-HRP/GO-CHIT/Cyt c/MUA-MCH/Au electrode (nCyt c/nHRP=32:9) in
N2-saturated (a), air-saturated (b) and O2-saturated (c) 0.2 M PBS (pH 7.0) at the scan rate of 5
mV s-1. (B) CVs of the Cyt c-HRP/GO-CHIT/Cyt c/MUA-MCH/Au electrode in 0.2 M PBS (pH 7.0) with 0 (a), 0.01 (b), 0.02 (c) and 0.03 (d) mM H2O2. Scan rate: 50 mV s-1.
The most appropriate working potential suited for the bioelectrochemical catalytic reduction of H2O2 at the Cyt c-HRP/GO-CHIT/Cyt c/MUA-MCH/Au modified electrode was further estimated.
Dynamic current responses for the successive addition of 10 μM H2O2 at Cyt c-HRP/GO-CHIT/Cyt
[image:10.596.126.475.76.567.2]
noticed from −100 mV to 0 V. A highest current response was observed at 0 V. Hence, a working potential of 0 V was chosen for subsequent investigations to achieve high sensitivity and also to minimize possible interferences in the biosensing of H2O2.
The amperometric responses of the different modified electrodes contained Cyt c /GO-CHIT/Cyt c/MUA-MCH/Au (curve a in Fig 7), HRP/GO-/GO-CHIT/Cyt c/MUA-MCH/Au (curve b in Fig 7), Cyt c-HRP/GO-CHIT/Cyt c/MUA-MCH/Au (curve c in Fig 7) (at 0 V) for successive addition of 10 μM H2O2 were recorded in a stirred PBS (10 mL). The inset in Fig. 7 showed the calibration curve
of the different modified electrodes respectively. The Cyt c-HRP/GO-CHIT/Cyt c/MUA-MCH/Au modified electrode responds effectively to the addition of H2O2 through current signals within 2 s. The
linear range of the H2O2 detection was from 20 μM to 330 μM (R2 = 0.9991; n=34), and the detection
limit was estimated to be 6.68 μM based on the criterion of a signal-to-noise ratio of 3.
0
200
400
600
800
1000
-100
-80
-60
-40
-20
0
0 50 100150200250300350 -0.03
0.00 0.03 0.06 0.09 0.12 0.15 0.18
c
b
a
I/
c
H2O2 / mol L -1
c
b
a
I/n
A
t/s
Figure 7. Current response to successive addition of 10 μM H2O2 at Cyt c/GO-CHIT/Cyt
c/MUA-MCH/Au (a), HRP/GO-CHIT/Cyt c/MUA-MCH/Au (b), Cyt c-HRP/GO-CHIT/Cyt c/MUA-MCH/Au (c) in 0.2 M PBS (pH 7.0). Inset:Calibration curve between current and the concentration of H2O2. Applied potential: 0 V.
The selectivity of the sensor was measured by sequential additions of 5 μM H2O2, 4.0 mM
ascorbic acid (AA) and 4.0 mM uric acid (UA) into the stirring 0.2 M PBS (pH 7.0) as shown in Fig. 8. The results indicated that AA and UA had no obvious interference on the detection of H2O2 at the
[image:11.596.108.489.293.580.2]
200
300
400
500
600
-25
-20
-15
-10
-5
0
5 M H
2O2
5 M H2O2 5 M H
2O2
4.0mM UA 4.0mM AA
I/n
A
t/s
Figure 8. Typical steady-state response of Cyt c-HRP/GO-CHIT/Cyt c/MUA-MCH/Au to sequential addition of 5 μM of H2O2, 4.0 mM AA, 4.0 mM UA into the stirring 0.2 M PBS (pH 7.0).
Applied potential: 0 V
3.4. Reproducibility and stability of the bi-protein modified electrode
The reproducibility of the current signal for the same electrode and for electrode-to-electrode was 4.21% and 4.62% (RSD, n = 10), respectively. When the electrode was stored in N2-saturated PBS
(pH 7.0) for 2 weeks, there was no obvious change of current in the response to 10 μM H2O2.
4. CONCLUSIONS
A novel bi-protein (Cyt c and HRP) electrode was fabricated based on a nanocomposite of GO and CHIT through self-assembly method. An electron transfer protein of Cyt c was used as a test system for direct electron transfer (DET) of redox proteins and for communication in the HRP stacks by co-immobilizing it with HRP. The experimental results indicated that the biocompatible matrix supplied a necessary pathway for the co-immobilized proteins to achieve DET and promoted the electron transfer between the coexist proteins and underlying electrode. Furthermore, the co-immobilized electrode exhibited a larger electron transfer rate constant compared to the electrode modified with single protein. The bi-protein electrode exhibited fast electron transfer and good electro-catalytic activity toward the reduction of H2O2 and O2. The resulted biosensor exhibited a sensitive and
fast amperometric response to H2O2 low detection limit and wide linear range. This approach revealed
[image:12.596.139.462.81.314.2]
ACKNOWLEDGEMENTS
This work was financially supported by National Natural Science Foundation of China (20905032, 21065005), Natural Science Foundation of Jiangxi Province (2008GZH0028), Foundation of Jiangxi Educational Committee (GJJ10389), the State Key Laboratory of Electroanalytical
References
1. D. Chen, G. Wang and J. Li, J. Phys. Chem. C, 111 (2007) 2351.
2. J. Xu, F. Shang, J.H.T. Luong, K.M. Razeeb and J.D. Glennonb, Biosens. Bioelectron., 25 (2010) 1313.
3. B.J. Privett, J.H. Shin and M.H. Schoenfisch, Anal. Chem., 80 (2008) 4499. 4. I.Willner and E. Katz, Angew Chem. Int. Ed., 39 (2000) 1180.
5. Y. Xiao, F. Patolsky, E. Katz, J.F. Hainfeld and I. Willner, Science, 299 (2003) 1877. 6. H. Cheng, Y. Wang, S. Dong and E. Wang, Electroanal., 17 (2005) 1801.
7. X. Ji, J. Ren, J. Jin and T. Nakamura, Biosens. Bioelectron., 23 (2007) 241. 8. L. Zhang, J. Zhang and C. Zhang, Biosens. Bioelectron., 24 (2009) 2085. 9. C. Xiang, Y. Zou, L. Sun and F. Xu, Electrochem. Commun., 10 (2008) 38.
10.S. Li, J. Xia, C. Liu, W. Cao, J. Hu and Q. Li, J. Electroanal. Chem., 633(2009) 273. 11.S.E. Baker, P.E. Colavita, K.Y. Tse and R.J. Hamers, Chem. Mater., 18 (2006) 4415.
12.M.K. Beissenhirtz, F.W. Scheller, W.F.M. Stöcklein, D.G. Kurth, H. Möhwald and F. Lisdat, Angew Chem. Int. Ed., 43 (2004) 4357.
13.R. Dronov, D.G. Kurth, H. Möhwald, F.W. Scheller, J. Friedmann, D. Pum, U.B. Sleytr and F. Lisdat, Lagmuir, 24 (2008) 8779.
14.D. Sarauli, J. Tanne, D. Schäfer, I.W. Schubart and F. Lisdat, Electrochem. Commun., 11 (2009) 2288.
15.S. Cosnier, C. Mousty, X. Cui, X. Yang and S. Dong, Anal. Chem., 78 (2006) 4985.
16.V. Vojinović, C.R. Calado, A.I. Silva, M. Mateus, J.M.S. Cabral and L.P. Fonseca, Biosens. Bioelectron., 20 (2005) 1955.
17.L. Zhu, R. Yang, J. Zhai and C. Tian, Biosens. Bioelectron., 23(2007) 528.
18.F. Wegerich, P. Turano, M. Allegrozzi, H. Möhwald and F. Lisdat, Langmuir, 27(2011) 4202. 19.Th. Balkenhohl, S. Adelt, R. Dronov and F. Lisdat, Electrochem. Commun., 10 (2008) 914. 20.R. Dronov, D.G. Kurth, F.W. Scheller and F. Lisdat, Electroanal., 19(2007) 1642.
21.R. Dronov, D.G. Kurth, H. Möhwald, R. Spricigo, S. Leimkühler, U. Wollenberger, K.V. Rajagopalan, F.W. Scheller and F. Lisdat, J. Am. Chem. Soc., 130 (2008) 1122.
22.S.F. Ding, W. Wei and G.C. Zhao, Electrochem. Commun., 9 (2007) 2202.
23.C. Mu, Q. Zhao, D. Xu, Q. Zhuang and Y. Shao, J. Phys. Chem. B, 111 (2007) 1491. 24.S.A. Mozaffari, T. Chang and S.M. Park, J. Phys. Chem. C, 113 (2009) 12434. 25.K. Nakano, T. Yoshitake, Y. Yamashita and E.F. Bowden, Langmuir, 23 (2007) 6270.
26.R. Dronov, D.G. Kurth, H. Möhwald, F.W. Scheller and F. Lisdat, Angew Chem. Int. Ed., 47 (2008) 3000.
27.H. Yi, L.Q. Wu, W.E. Bentley, R. Ghodss, G.W. Rubloff, J.N. Culver and G.F. Payne, Biomacromolecules, 6 (2005) 2881.
28.I.R.W.Z. De Oliveira and I.C. Vieira, Enzyme Microb. Technol., 38 (2006) 449. 29.Y. Wan, K.A.M. Creber, B. Peppley and V.T. Bui, Polymer, 44 (2003) 1057. 30.Y. Deng, D. Liu, G. Du, X. Li and J. Chen, Polym. Int., 56 (2007) 738.
31.D. Li, M.B. Muller, S. Gilje, R.B. Kaner and G.G. Wallance, Nature Nanotechnol., 3 (2008) 101. 32.S. Park and R.S. Ruoff, Nature Nanotechnol., 4 (2009) 217.
33.V.C. Tung, M.J. Allen, Y. Yang and R.B. Kaner, Nature Nanotechnol., 4 (2009) 25.
(2010) 6083.
35.W.S. Hummers Jr and R.E. Offeman, J. Am. Chem. Soc., 80 (1958) 1339.
36.X.M. Yang, Y.F. Tu, L. Li, S.M. Shang and X.M. Tao, ACS Appl. Mater. Inter., 2 (2010) 1707. 37.C. Guo, Y. Song, H. Wei, P. Li, L. Wang, L. Sun, Y. Sun and Z. Li, Anal. Bioanal. Chem., 389
(2007) 527.
38.M. Collinson and E.F. Bowden, Anal. Chem., 64 (1992) 1470.
39.K.L. Hanrahan, S.M. Macdonald and S.G. Roscoe, Electrochim. Acta., 41 (1996) 2469.
40.X.L. Zhou, S.J. He, D. Li, C. Peng, Q. Huang, S.P. Song and C.H. Fan, Langmuir, 26 (2010) 1936. 41.E. Laviron, J. Electroanal. Chem., 101 (1979) 19.