Methods
journal homepage:www.elsevier.com/locate/ymeth
Microbial expression systems for membrane proteins
Marvin V. Dilworth
a,1,2, Mathilde S. Piel
b,1, Kim E. Bettaney
c,1, Pikyee Ma
c,3, Ji Luo
c,
David Sharples
c, David R. Poyner
a, Stephane R. Gross
a, Karine Moncoq
b, Peter J.F. Henderson
c,⁎,
Bruno Miroux
b,⁎, Roslyn M. Bill
a,⁎aSchool of Life & Health Sciences, Aston University, Aston Triangle, Birmingham B4 7ET, UK
bLaboratoire de Biologie Physico-Chimique des Protéines Membranaires, UMR 7099, CNRS, Université Paris Diderot, Institut de Biologie Physico-Chimique, 13 rue Pierre et Marie Curie, 75005 Paris, France
cAstbury Centre for Structural Molecular Biology and School of Biomedical Sciences, University of Leeds, Leeds LS2 9JT, UK
A R T I C L E I N F O
Keywords:
Recombinant membrane proteins Expression plasmid vector Tag
Promoter Detergent
A B S T R A C T
Despite many high-profile successes, recombinant membrane protein production remains a technical challenge; it is still the case that many fewer membrane protein structures have been published than those of soluble proteins. However, progress is being made because empirical methods have been developed to produce the required quantity and quality of these challenging targets. This review focuses on the microbial expression systems that are a key source of recombinant prokaryotic and eukaryotic membrane proteins for structural studies. We provide an overview of the host strains, tags and promoters that, in our experience, are most likely to yield protein suitable for structural and functional characterization. We also catalogue the detergents used for solubilization and crystallization studies of these proteins. Here, we emphasize a combination of practical methods, not necessarily high-throughput, which can be implemented in any laboratory equipped for re-combinant DNA technology and microbial cell culture.
1. Recombinant membrane protein production in microbes
Few membrane proteins are naturally abundant in their native membranes; in order to characterize them biophysically and bio-chemically, recombination of their genes with more efficient promoters and regulators of expression are required[1]. Unsurprisingly, the few naturally-abundant membrane proteins (including mammalian and bacterial rhodopsins, aquaporins and complexes involved in respiration and photosynthesis) were amongst the first to have their crystal-lographic structures solved: the first high-resolution structure of a membrane protein was that of the photosynthetic reaction centre from
Blastochloris viridispublished in 1995[2]. In 1998, thefirstrecombinant
membrane protein structures were published: those of the prokaryotic proteins MscL[3]and KcsA[4], both produced inEscherichia coli. The first structures of recombinant mammalian membrane proteins were solved in 2005 using protein that had been produced in yeast cells: the rabbit Ca2+-ATPase, SERCA1a, was produced inSaccharomyces
cerevi-siae [5]and the rat voltage-dependent potassium ion channel, Kv1.2 was produced in Pichia pastoris [6]. These early results established
microbes as efficient and effective host systems for synthesizing mem-brane proteins.
While baculovirus-infected insect cells and mammalian cell-lines have been used very successfully for both prokaryotic and eukaryotic membrane protein production [1], we note that microbes have re-mained a consistently-popular choice because they are quick, easy and cheap to culture and they can produce high-quality protein suitable for subsequent study. In November 2017, Stephen White’s database (blanco.biomol.uci.edu/mpstruc/) recorded that almost a third (31%) of all membrane protein coordinatefiles deposited in the Protein Data Bank (www.rcsb.org/pdb/home/home.do; PDB) were derived from recombinant proteins; notably, 71% of alluniquestructures were de-rived from microbial sources. Of these, 64% were produced inE. coli, 4% inP. pastorisand 3% inS. cerevisiae.
This review focuses on current approaches to selecting expression plasmids (especially with respect to their purification tags and pro-moters), microbial strains and culture conditions to enable the de-tergent-based purification of functional membrane proteins for bio-physical characterization and crystallization trials (for subsequent
https://doi.org/10.1016/j.ymeth.2018.04.009
Received 18 January 2018; Received in revised form 8 March 2018; Accepted 10 April 2018 ⁎Corresponding authors.
1Equal contributions by: Marvin V. Dilworth, Mathilde Piel and Kim E. Bettaney.
2Current address: Department of Chemistry, King’s College London, Britannia House, 7 Trinity Street, London SE1 1DB, UK. 3Current address: Paul Scherrer Institute, CH-5232 Villigen PSI, Switzerland.
E-mail addresses:[email protected](P.J.F. Henderson),[email protected](B. Miroux),[email protected](R.M. Bill).
Available online 12 April 2018
1046-2023/ © 2018 The Authors. Published by Elsevier Inc. This is an open access article under the CC BY license (http://creativecommons.org/licenses/BY/4.0/).
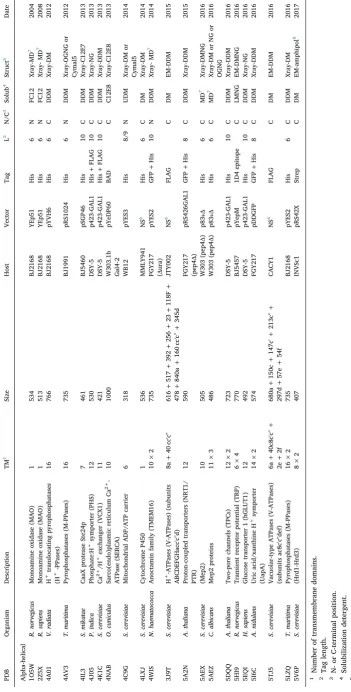
Table 1 ( continued ) PDB Name TM 1 Length Strain(s) Vector Tag Size N/C 2 Solubilization 3 Structure 4 Date 5F5B Rhomboid protease (GlpG) 6 211 C43(DE3) pGEX-6P-1 GST N DDM Xray-CHAPSO (bicelles) 2016 5KBN F-ion channel homologue (Fluc) 4 × 2 126 BL21(DE3) pASK-IBA2 His 6 C DM Xray-DM 2016 5J4N Arginine:agmatine antiporter (AdiC) 12 445 BL21(DE3) pLysS pZUDF21 His 10 C NG Xray-NG 2016 5SV0, 5SV1 (ExbB/ExbD) 3 + 1 244 + 58 BL21(DE3) pET28b(ExbB) + pCDF-1b(ExbD) His 10 C DDM Xray-DDM 2016 5GXB Lactose permease (LacY) 12 417 BL21(DE3) PT7-5 His 6 C DDM Xray-DDM (LCP) 2016 5T4O F1 Fo ATP synthase 5 + 1 + 2 513 + 460 + 287 + 177 + 139 + 271 + 155 + 79 DK8 NA 8 pFV2 NI 9 His 6 N Digitonin EM-Digitonin 2016 5IJI Sensor histidine kinase (NarQ) 4 230 SE1 pSCodon1.2 His 6 C DDM Xray-DM (LCP) 2017 5N6H Apoplipoprotein N-acyltransferase (Lnt) 8 512 C43(DE3) pET28a His 6 N LMNG Xray-LMNG (LCP) 2017 5XHQ Apoplipoprotein N-acyltransferase (Lnt) 8 512 C41(DE3) pET22b His 8 C DM Xray-MD 10 2017 5TV4 Lipid “ fl ippase ” (MsbA) 6 582 BL21(DE3) Star pLysS pET19b His 10 N DDM EM-POPG (nanodisc) 2017 Beta-barrel 1MPF Porin from colicin-resistant (OmpF) 16 340 BZB1107 NA 8 Native NT 5 OPOE Xray-MD 10 1995 1GFM Porin (OmpF) 16 340 Top10 pGEM-7Zf (+) lac NT 5 OPOE Xray-MD 10 1996 1MPM, 1MAL, 1AF6 Maltoporin (LamB) 18 421 Pop6510 NA 8 pAC1 NT 5 OPOE XRAY-OPOE or MD 10 1997 1BT9, 3O0E Porin (OmpF) 16 340 BL21(DE3) pGEM-5Zf (+) NT 5 SDS Xray-OPOE 1999 1BY3, 1BY5 Ferrichrome-iron receptor (FhuA) 22 747 B834(DE3)/BL21(DE3) pET NT 5 OPOE Xray-OPOE 1999 1FEP Siderophore transporter (FecA) 22 747 BL21(DE3) pET17b NT 5 TX100 Xray-LDAO 1999 1QJ8 Porin (OmpX) 8 148 BL21(DE3) pLysS pET3b NT 5 IB-gua 6 Xray-C8E4 1999 1QKC, 1FI1, 2FCP, 1FCP Ferrichrome-iron receptor (FhuA) 22 747 AW740 [ Δ ompF
zch:TnlO ΔotnpC
Table 1 ( continued ) PDB Name TM 1 Length Strain(s) Vector Tag Size N/C 2 Solubilization 3 Structure 4 2JQY Porin (OmpG) 14 280 BL21(DE3) pLysS pT7-SMC NT 5 IB-urea lsNMR-FC12 2QOM Autotransporter (EspP) 12 285 BL21(DE3) PC6H1 His 6 C Elugent Xray-MD 10 2VDE OM protein (TolC) 4 × 3 460 C43(DE3)/C41(DE3) pET14b His 8 C Tx100 Xray-DDM 2VQI P pilus usher translocation (PapC) 24 515 B834(DE3) pDG2 His 6 C DDM Xray-MD 10 3DWN Long-chain fatty acid transporter (FadL) 14 427 C43(DE3) pBAD His 6 C LDAO Xray-C8E4 2WJR (Mb), 2WJQ (IB) Porin (NanC) 12 214 BL21(DE3) pLysS pT7 NT 5 OPOE, IB-urea Xray-LDAO, Xray-FC-12 3HW9, 2ZFG Porin (OmpF) 16 340 MH225 NA 8 pR272 NT 5 OPOE Xray-MD 10 2XE1 Osmoporin (OmpC) 16 346 HN705 Δ omp8 NA 8 PHSG575 NT 5 SB3-14 Xray-MD 10 or OG 3AEH Hemoglobin protease (Hbp) 12 308 C43(DE3) pET22b His 6 C SB3-12 Xray-OG 3PIK, 4K7R, 4K34 Heavy metal e ffl ux pump (CusC) 4 × 3 446 C43(DE3) pBAD22 His 6 C LDAO or DDM or Cymal6 Xray-DDM or Cymal6 3RFZ P pilus (FimD) 24 843 + 211 + 279 B834(DE3) / pAN2 ( fi mD) + pETS1001 ( fi mC) Strep + His 6 C DDM Xray-MD 10 3OHN P pilus (FimD) 24 558 B834(DE3) pNH297/pETS4 His 6 C DDM Xray-C8E4 4E1S, 1F02 Intimin outer membrane β -domain 12 242 BL21(DE3) pET9/pET21a His 10 N Elugent Xray-LDAO 2M06 Porin (OmpX) 8 148 BL21(DE3) pET11a NT 5 IB-gua 6
lsNMR-DMPC/ DMPG (nanodisc)
structural studies by X-ray crystallography, as well as the newly-in-vigorated technique of electron microscopy[7]). We have experience of automated methods using robots that, once commissioned and opti-mized, can dramatically increase the number of constructs and hosts explored and reduce the time required to reach success. This review is intended for laboratories without access to such facilities, meaning that the approaches discussed here should be widely applicable.
2. An overview of microbial expression hosts, tags and promoters
2.1. An overview of microbial host usage
The expression systems used in generating high-resolution struc-tures of recombinant membrane proteins have been documented by Stephen White in his analysis of the PDB (blanco.biomol.uci.edu/ mpstruc/). Biophysical studies of membrane proteins (especially NMR and crystallographic techniques) require large quantities (0.1–10 mM) of homogenous, correctly-folded, purified protein; a focus on data ex-tracted from the PDB has therefore allowed us to identify systems that have the capability of producing the required quantity and quality of these challenging targets. This review updates our previous study[8]of
E. coliexpression systems and extends that work to includeS. cerevisiae
and P. pastoris. Together, these three host systems account for the production of the vast majority of recombinant membrane proteins in microbes, although Lactococcus lactis (see PDB entry 4US3), Pseudo-monasfluorescens(5KUD) andSchizosaccharomyces pombe(2PNO) have also been used successfully as microbial cell factories in a minority of cases.
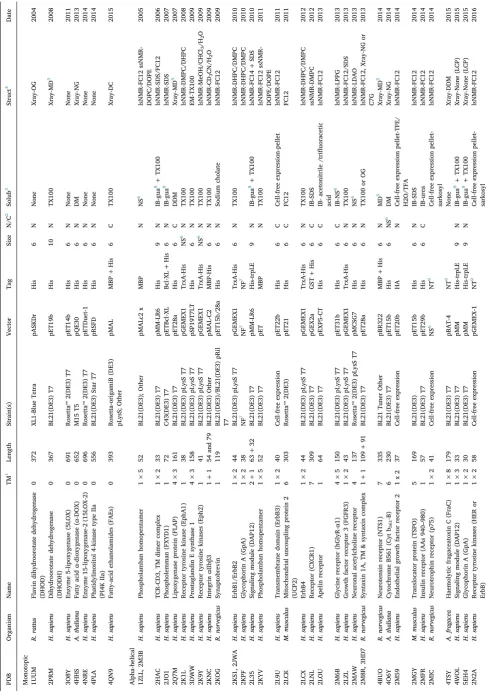
In November 2017, of the 729 unique membrane protein structures (uMPS) derived from recombinant proteins and deposited in the PDB, 521 were produced in microbial host cells.E. coliwas clearly the cell factory of choice (producing 468 uMPS,Tables 1 and 2), followed by the yeast hosts, P. pastoris (31 uMPS, Table 3) and S. cerevisiae(22 uMPS,Table 4).Table 5summarizes the use of microbial expression systems and the origin of the target uMPS. With a growing number of uMPS being deposited in the PDB, heterologous membrane protein production is becoming dominant over the production of homologous targets. Higher eukaryotic uMPS, in particular, have more recently been obtained using all three microbial systems (Table 5).
Yeast expression systems have been used almost exclusively in the production of large, eukaryotic membrane proteins; in the case ofP. pastoris, the targets were mainly of mammalian and plant origin
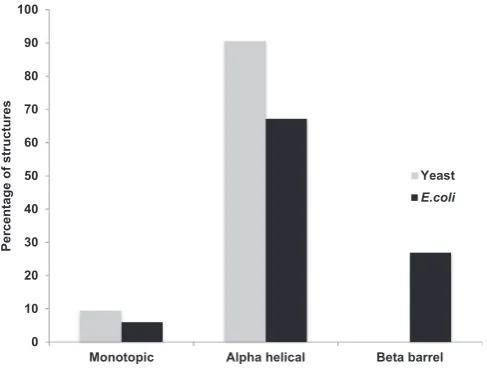
(Table 3). Yeast hosts have mainly producedα-helical membrane
pro-teins, while E. coli has also been used to produce β-barrel proteins, probably because many such proteins are found natively in theE. coli
outer membrane (Fig. 1).
Fig. 2shows that above 500–600 amino acids (∼50–60 kDa), the
number of uMPS decreases dramatically, suggesting thatE. colicannot efficiently produce large proteins; this may be because ribosomes drop off very long mRNAs leading to incomplete synthesis products. In contrast, yeast expression systems can cope with larger proteins up to 1400 residues in length (∼150 kDa) (Fig. 2). When we interrogated the data for eukaryotic (mammalian, plant, fish, anemone and worm) membrane proteins produced in E. coli (Table 6), we identified 47 uMPS. Of these 47 uMPS, 7 were monotopic membrane proteins and 23 were small peptides or proteins containing only one transmembrane domain. Fifteen uMPS were produced as inclusion bodies and subse-quently refolded, 17 were purified in mild detergent and, of those, 3 were membrane proteins with more than 4 transmembraneα-helices that had been crystallized in the presence of detergent (PDB codes: 2Q7M; 4BUO; 4O6Y) and 1 was studied by electron microscopy (3DWW).
2.2. An overview of tag usage in microbial expression systems
Construct design is an integral part of defining an appropriate
expression system, with key considerations being the size and predicted secondary structure of the target protein as well as the planned pur-ification strategy. SMART (protein domain identification;http://smart.
embl-heidelberg.de/help/smart_about.shtml) or Jpred (secondary
structure prediction; http://www.compbio.dundee.ac.uk/jpred/) ap-proaches can be used to describe the protein architecture and may help in deciding where to place any tags.
Addition of a polyhistidine tag is the most popular strategy for large-scale purification of recombinant membrane proteins on nickel-affinity columns. This is especially true forE. coli, where other affinity pur-ification tags have had very little impact: 392 of the 447 tagged proteins produced inE. colicontain a polyhistidine tag; 18 contain a GFP tag and 17 were fused to maltose binding protein (MBP). Other tags such as Strep and Flag account for no more than 13 uMPS (Fig. 3A,Tables 1 and 2). While the overall numbers are lower for uMPS from yeast-derived proteins, GFP is emerging as a useful tag to track the purification of proteins from yeast membranes (Fig. 3B,Tables 3 and 4). GFP can be particularly useful for monitoring production yields or the oligomeric state of a membrane protein-GFP fusionviafluorescent size exclusion chromatography experiments (F-Sec) [9]. Other tags (e.g. Strep and Flag) are also more frequently used in yeast expression systems
(Fig. 3B).
Irrespective of the host used, polyhistidine tag placement is ap-proximately equally favoured at the amino- or carboxyl-terminus of the target protein (Fig. 4A,Tables 1–4). For constructs with amino-terminal tags, protein synthesis is usually initiated using a sequence of at least three amino acids before that of the tag. For example, in plasmid pRSET (Invitrogen), the sequence is MRGSHis6, while the protein used to solve structure 4V3G contained the following amino-terminal tag: AN-VRLQHis7LE (Table 2).Fig. 4B shows that 35% of uMPS produced in microbial host cells contained polyhistidine tags with more than 6 histidines. An interesting example is the insertion of a tandem array of 6 histidines separated by a glycine (see 5DO7,Table 3).
Fluorescent tags are an increasingly popular choice for examination of protein quality[10]. In bacteria, dual Ribosome-Binding-Site (RBS) expression vectors such as pET-Duet (Novagen) enable the cloning of a gene encoding a reporterfluorescent protein downstream of the target gene. This allows the cell population to be assessed byflow cytometry for stability and toxicity of the expression construct and to establish optimal induction conditions. Double RBS vectors from the pET-Duet series have been used to produce nine multi-subunit membrane proteins
(see Table 2for 4HZU, 4HUQ, 4HG6, 4NRE, 4N4R, 5AWW, 4YMS,
3DL8 andTable 1for 4C48), withfive being produced inE. colihost strain C43(DE3).
There is no general rule regarding cleavage sequences, but TEV protease, which is easy to produce in-house, is widely used for mem-brane protein purification (see 4C00, 3WVF, 4X5M and 4JA3 for ex-amples) because it is still active in the presence of the most commonly-used detergents[11]. Thrombin protease is also widely used (see 2VQI, 2ABM and 3B5D for examples).
2.3. Promoter usage forE. coliexpression
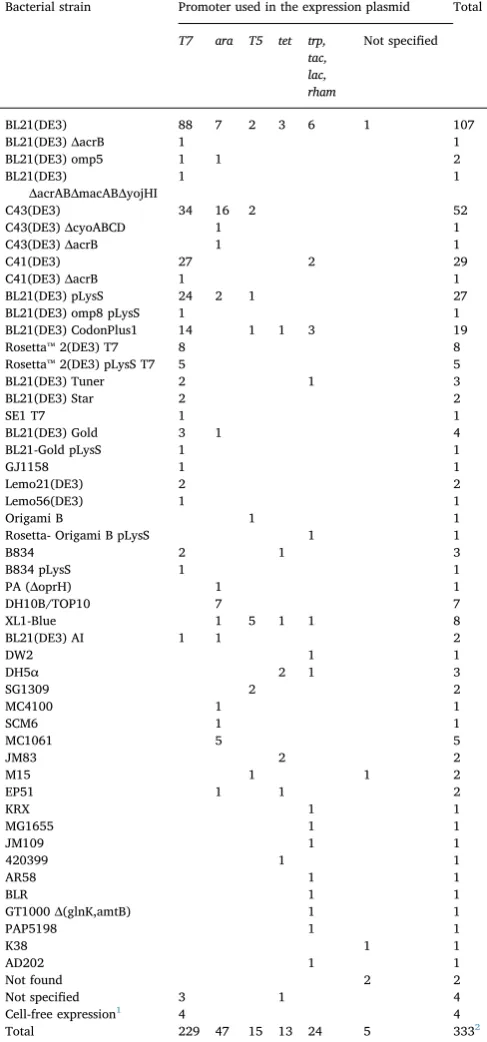
We analyzed how the 468 membrane proteins inTable 5had been produced. Some uMPS were produced in more than one expression system and thereforeTables 7 and 8list a total of 477 combinations of promoter andE. colihost strain. As we previously observed (in our 2015 analysis of 213 uMPS[8]), the T7 RNA polymerase (T7RNAP)-based expression system is the most widely-used followed by theara,T5and
tetpromoter-based expression systems (Fig. 5). The data inTables 1 and 2are presented in chronological order, meaning that the later entries reflect the most recent trends in promoter, strain and vector choice.
Table
2
Unique
membrane
protein
structures
derived
from
recombinant
non-E.
coli
proteins
produced
in
E.
coli
(heterologous
expression).
PDB
Organism
Name
TM
1
Length
Strain(s)
Vector
Tag
Size
N/C
2
Solubilization
3
Structure
4
Date
Monotopic 1UUM
R.
rattus
Flavin
dihydroorotate
dehydrogenase
(DHOD)
0
372
XL1-Blue
pASKDr
His
6
N
None
Xray-OG
2004
2FNQ,
3FG4
P.
homomalla
Lipoxygenases
(LOXs)
0
699
BL21(DE3)
NS
5
His
6
N
None
None
2006
2OQO
A.
aeolicus
Peptidoglycan glycosyltransferase
(PGT)
0
200
BL21(DE3)
pET48b
His
6
N
CHAPS
CHAPS
2007
2PRM
H.
sapiens
Dihydroorotate
dehydrogenase
(DHODH)
0
367
BL21(DE3)
pET19b
His
10
N
TX100
Xray-MD
6
2008
2K5U,
2KSQ
S.
cerevisiae
ADP-ribosylation
factors
(ARFs)
0
181
BL21(DE3)
pET20b
His
6
C
None
lsNMR- DMPC/ DHPC
2009
3I65
P.
falciparum
Dihydroorotate
dehydrogenase
(PfDHODH)
0
415
BL21(DE3)
pET28b
His
6
N
C12E9
Xray-LDAO
2009
3L7I
S.
epidermidis
Polymerase
(TagF)
0
729
BL21(DE3)
pET28b
His
6
C
CHAPS
Xray-CHAPS
2010
3O8Y
H.
sapiens
Enzyme
5-lipoxygenase
(5LOX)
0
691
Rosetta
™
2(DE3)
pET14b
His
6
N
None
None
2011
2XCI
A.
aeolicus
Glycosyltransferase
(WaaA,
KdsB)
0
374
BL21(DE3)
CodonPlus
pUM212/216
His
10
N
TX100
Xray-Cymal6
2011
3RST,
4KWB
B.
subtilis
Signal
peptide
peptidase
A
(SppA)
0
240
BL21(DE3)
Tuner
pET28b
His
6
N
None
Xray-DDM
2012
4EHW
A.
aeolicus
Kinase
(LpxK)
0
317
C41(DE3)
pET21b
GST
N
DDM
Xray-DDM
2012
4G9K
S.
cerevisiae
NADH
dehydrogenase
(Ndi1)
0
471
BL21(DE3)
pLysS
pET16b
His
10
N
DDM
Xray-DDM
or
DM
2012
4GGM
C.
crescentus
Phosphodiester
hydrolase
(LpxI)
0
283
C41(DE3)
T7
based
His
10
N
None
None
2012
4G6G
S.
cerevisiae
Dehydrogenase
(Ndi1)
0
502
C43(DE3)
pQE80L
His
6
N
TX100
Xray-TX100
2012
4HHS
A.
thaliana
Fatty
acid
α
-dioxygenase
(
α
-DOX)
0
652
M15
pQE30
His
6
N
DM
Xray-NG
2013
3VV9
T.
brucei
Alternative
oxidase
(AOX)
0
329
BL21(DE3)
pET15b
His
6
N
OG
Xray-MD
6
2013
2YOC
K.
oxytoca
Lipoprotein
pullulanase
(PulA)
0
1078
pAP5198
pCHAP4486
His
6
C
NS
5
NS
5
2013
4NRE
H.
sapiens
Enzyme
15-lipoxygenase-2
(15LOX-2)
0
696
Rosetta
™
2(DE3)
pETDuet-1
His
6
N
None
None
2014
4NM9
G.
sulfurreducens
Proline
utilization
A
(PutA)
0
1005
BL21AI
pNIC28-Bsa4
His
6
N
None
None
2014
4NWZ
C.
thermarum
Non-proton
pumping
type
II
NADH
dehydrogenase
(NDH-2)
0
405
C41(DE3)
pTRCndh2
His
6
C
OG
Xray-OG
2014
4PLA
H.
sapiens
Phatidylinositol
4-kinase
type
IIa
(PI4K
IIa)
0
556
BL21(DE3)
Star
pRSFD
His
6
N
None
None
2014
4QN9
H.
sapiens
Fatty-acid
ethanolamides
(FAEs)
0
393
Rosetta-origamiB
(DE3)
pLysS
pMAL
MBP
+
His
6
C
TX100
Xray-DC
2015
4WVG
S.
aureus
Bacterial
type
I
signal
peptidases
0
542
BL21(DE3)
CodonPlus
pProExHta
MBP
N
None
None
2015
5B49
P.
aeruginosa
UDP-diacylglucosamine pyrophosphohydrase
(LpxH)
0
248
B834(DE3)
pLysS
pET26b
His
6
C
TX100
None
2016
5KN7
A.
baumannii
Lipid
A
acyltransferase
LpxM
0
333
C41(DE3)
pRham
His
6
N
DDM
Xray-LMNG
2016
Alpha-helical 3STL,
3OR7,
3EFF, 1BL8, 1K4C, 2BOB, 2ITC, 3PJS, 4MSW, 2JK5
S.
lividans
Channel
(KcsA)
2
×
4
160
XL1-Blue
pQE32
His
6
N
DM
EPR-DDM; Xray-DM
or
LDAO
1998
2CPB
Phage
M13
Major
coat
protein
of
M13
1
50
K38
NF
7
NF
7
NF
7
lsNMR-FC12 or
SDS
1998
1F6G
S.
lividans
Potassium
channel
(KcsA
)
2
×
4
160
XL1-Blue
pQE32
His
4
N
or
C
DDM
2001
(
continued
on
[image:7.595.61.550.67.746.2]Table 2 ( continued ) PDB Organism Name TM 1 Length Strain(s) Vector Tag Size N/C 2 Solubilization 3 Structure 4 Date
EPR- asolectin liposome
1KPL S. typhimurium Transporter (H +/Cl −) 18 × 2 473 BL21(DE3) pET28b His 6 C DM Xray-OM 2002 3RBZ, 4EI2,
4HYO, 4L73, 1LNQ, 3LDC,
M. thermauto-trophicus Potassium channel (MthK) 2 × 4 340 XL1-Blue, SG1309 pQE70 His 6 C DM Xray-LDAO 2002 1ORQ, 2A0L, 2KYH A. pernix Channel (KyAP) 6 223 XL1-Blue pQE60 His 6 C DM Xray-DM 2003 1XFH, 3KBC, 3V8F P. horikoshii Glutamate transporter homol (GltPh) 8 × 3 422 TOP10 or DH10B pBAD His 8 N DM Xray-DM 2004 1WAZ, 2LJ2 M. morganii Transporter (MerF) 2 46 C43(DE3) pET31b His 6 C IB-gua + SDS
lsNMR-SDS ssNMR- DMPC
2005 1ZLL, 2M3B H. sapiens Phospholamban homopentamer 1 × 5 52 BL21(DE3) pMALc2x MBP N NS 5
lsNMR-FC12 ssNMR- DOPC/DOPE
2005 2B2F A. fulgidus Transporter (Amt-1) 11 × 3 399 C43(DE3) pET21a His 6 C DDM Xray-LDAO 2005 2F2B M. marburgensis Aquaporin (AqpM) 6 × 4 246 BL21(DE3) CodonPlus NS 5 His 10 N OG Xray-OG 2005 2BBJ T. maritima Mg 2+ transporter (CorA) 2 × 5 351 NS 5 pET15b His 6 N DDM Xray-DDM 2005 2A9H S. lividans Channel (KcsA) 2 × 4 155 C41(DE3) pIVEX-2.4d His 6 N FC12 lsNMR-FC12 2006 3E86, 3K0D,
3OUF, 3T1C, 3E86, 2Q67, 2AHY
B. cereus Channel (NaK) 2 × 4 '96 – 114 SG1309 pQE60 His 6 C DM Xray-DM 2006 2HN2, 2IUB T. maritima Transporter (CorA Mg 2+ ) 2 × 5 351 BL21(DE3) CodonPlus pET15b His 6 N DDM Xray-DDM 2006 2H3O M. morganii Transporter (MerF HgII) 2 61 BL21(DE3) pLysS pET31 His 6 C IB-gua ssNMR-14-O- PC/6-O-PC 2006 2HAC H. sapiens TCR-CD3, TM dimer complex 1 × 2 33 BL21(DE3) pMM-LR6 His 9 N IB-gua + TX100 lsNMR-SDS/ FC12 2006 2NR9 H. in fl uenzae Intramembrane peptidase (GlpG) 6 × 2 196 TOP10 pBAD His 6 C DDM Xray-C12E8 2006 2NWL P. horikoshii Aspartate transporter (GltPh) 8 422 Top10 pBAD24 His 8 NS 5 DDM Xray-DM 2007 2JO1 H. sapiens Phospholemman (FXYD1) 1 72 C43(DE3) pETBcl-XL Bcl-XL + His 6 N IB-gua lsNMR-SDS 2007 2Q7M H. sapiens Lipoxygenase protein (FLAP) 4 × 3 161 BL21(DE3) pET28a His 6 C DDM Xray-MD 6 2007 2QJU A. aeolicus Leucine transporter (LeuT) 12 511 BL21(DE3) pLysS pBAD His NS 5 NS 5 DDM Xray-OG 2007 2YVX, 2ZY9 T. thermophilus Transporter (MgtE) 5 × 2 473 C41(DE3) pET28a His 6 N DDM Xray-DDM 2007 3B9W N. europaea Rh protein ammonia or CO 2 channel 11 407 GT1000 D (glnK, amtB) pAD7; nitrogen promoter His 6 C OG Xray-OG 2007 3B60 S. typhimurium Flippase (MsbA) 6 × 2 582 BL21(DE3) pET19b His 10 N UDM Xray-UDM 2007 3BEH M. loti Cyclic nucleotide-regulated K + channel 6 × 4 355 JM83 pASK-IBA2 His 6 C DM Xray-DM 2008 2LJB, 2RLF In fl uenza A, B Channel (M2) 1 × 4 35 BL21(DE3) pMM-LR6 His-trpLE 9 N IB-gua + TX100 lsNMR- DHPC 2008 2VL0 E. chrysanthemi Channel (pentameric ELIC) 4 × 5 321 BL21(DE3) pET26b MBP + His 10 N UDM Xray-UDM 2008 2VQG C. glutamicum Porin B (PorB) 1 × 5 99 BL21(DE3) pGEX-3X GST N None Xray-C10E9, OG, NG, DM 2008 3DH4 V. parahaemolyticus Na +/galactose transporter (ySGLT) 14 530 XL1-Blue pBAD His 6 C DM Xray-DM 2008 2K1L H. sapiens Receptor tyrosine kinase (EphA1) 1 38 BL21(DE3) pLysS pGEMEX1 TrxA-His NS 5 N TX100
lsNMR- DMPC/ DHPC
Table 2 ( continued ) PDB Organism Name TM 1 Length Strain(s) Vector Tag Size N/C 2 Solubilization 3 Structure 4 Date 3DIN T. maritima SecYEG protein in complex with SecA 10 (Y) + (E) + 2 (G) 431 + 65 + 76 BL21(DE3) pBAD22, pACYC No tag DDM Xray-Cymal6 2008 2ZJS T. thermophilus Translocon (SecYE) 10 + 1 438 + 60 AD202 pTV118N lac His 6 C DDM Xray-DDM 2008 2JLN, 2X79 M. liquefaciens Benzyl-hydantoin transporter (Mhp1) 12 501 BLR pTTQ18 His 6 C DDM Xray-NM 2008 3DL8 A. aeolicus Channel (SecYEG) 10 (Y) + 1 (E) + 2 (G) 429 + 65 + 107 C43(DE3) pET Duet-1, pCDF Duet-1 His 6 C DM Xray-Cymal6 2008 3F3A, 2QEI,
2A65, 3GJD, 3MPN, 3TT1, 3USG 3QS4, 4MM4
A. aeolicus VF5 Symporter (LeuT) 12 × 2 519 C41(DE3) pET16b His 8 C DDM Xray-OG 2008 2V50 P. aeruginosa Transporter (MexB) 12 × 3 1052 C43(DE3) pET28 His 6 C DDM Xray-DDM 2009 4DOJ, 2WIT C. glutamicum Glycine betaine transporter (BetP) 12 × 3 566 DH5a, BL21(DE3) CodonPlus IBA7 Strep N DDM Xray-Cymal5 2009 3DWW H. sapiens Prostaglandin E synthase 1 4 × 3 158 BL21(DE3) pLysS pSP19T7LT His 6 N TX100 EM-TX100 2009 2K9Y H. sapiens Receptor tyrosine kinase (Eph2) 1 41 BL21(DE3) pLysS pGEMEX1 TrxA-His NS 5 N TX100 NMR-MeOH/ CHCl 3 /water 2009 3GIA M. jannaschii Protein MJ0609 (ApcT) 12 444 C41(DE3) pET3a-GFP GFP + His 8 C DDM Xray-OTG 2009 2KNC H. sapiens Integrin α IIb β 3 1 + 1 54 and 79 BL21(DE3) pMAL-C2 MBP-His 6 N TX100 lsNMR- CD 3 CN/H2O 2009 3K3F D. vulgaris Transporter (urea) 10 × 3 533 BL21(DE3) pET-SUMO SUMO + His NS 5 N DDM Xray-OM 2009 3IGA S. lividans Potassium channel (KcsA) 2 × 4 124 JM83 pASK90 His 6 N DM Xray-DM 2009 2KOG R. norvegicus Synaptobrevin 1 119 BL21 (DE3)/BL21(DE3) pRil pET15b/28a His 6 N Sodium cholate lsNMR-FC12 2009 3KLY V. cholerae Formate transporter (FocA) 6 × 5 280 C43(DE3) pBAD His 10 C DDM Xray-OG 2009 3KP9 Synechococcus sp. Thioredoxin domain protein (VKORC1) 5 291 C43(DE3) pET20b His 6 C DDM Xray-DDM 2010 4NV5, 3KP9 Synechococcus sp. Vitamin K epoxide reductase (VKOR) 5 291 BL21 (DE3) NS 5 His 6 C DDM Xray-DDM 2010 3M71 H. in fl uenzae Anion channel (SLAC1) 10 × 3 328 BL21(DE3) pLysS pET His 10 C DDM Xray-LDAO or OG 2010 2KS1, 2JWA H. sapiens ErbB1/ErbB2 1 × 2 44 BL21(DE3) pLysS pGEM-EX1 TrxA-His 6 N TX100
lsNMR- DHPC/ DMPC
2010 3NCY S. enterica Antiporter (AdiC) 12 × 2 445 BL21(DE3) pASK-IBA2 His 6 N DM Xray-DM 2010 2KPF H. sapiens Glycophorin A (GpA) 1 × 2 38 NF 7 NF 7 NF 7
lsNMR- DHPC/ DMPC
2010 3MKT V. cholerae MATE transporter (NorM) 12 461 BL21(DE3) pET19b His 10 N DDM Xray-DDM 2010 3MP7 P. furiosus Primed channel (SecYEb) 10 (Y) + 1 (E) 482 + 61 BL21AI pBAD His 6 C DDM + OG Xray-OG 2010 3P5N S. aureus Transporter (RibU) 6 × 2 189 BL21(DE3) pET15b His 6 N NG Xray-NG 2010 2L35 H. sapiens Signaling module (DAP12) 2 + 1 63 + 32 BL21(DE3) pMM-LR6 His-trpLE 9 N IB-Gua + TX100 lsNMR- FC14 + SDS 2010 2L0J, 2LY0 In fl uenza A Channel (AM2) 1 × 4 44 BL21(DE3) pLysS PET30-23d pMALc2x MBP or His NS 5 C DDM OG
ssNMR- DOPC/ DOPCE lsNMR-FC12
Table 2 ( continued ) PDB Organism Name TM 1 Length Strain(s) Vector Tag Size N/C 2 Solubilization 3 Structure 4 Date 2XQA, 3EHZ, 4HFI 2XQ2 V. parahaemolyticus Na +/galactose transporter (ySGLT) 14 593 TOP10 pBAD His 6 C DM Xray-Tri-DM 2010 2XUT S. oneidensis Transporter (PepTSt) 14 524 C43(DE3) pWaldo-GFPe GFP + His 8 C DDM Xray-DDM 2010 4A2N M. acetivorans Transferase (ICMT) 5 194 C41(DE3) pTriEX/pOPIN GFP + His 7 C DDM Xray-DDM 2012 – 01 – 11 3P50, 3P4W,
3EAM, 3IGQ, 4QH5, 5HCJ, 5L4E
G. violaceus Ligand-gated ion channel (GLIC) 4 × 5 359 C43(DE3) pET20b MBP + His 6 N DDM Xray-DDM 2011 3PJZ V. para-hemolyticus Transporter (TrkH) 10 × 2 485 BL21(DE3) pET31 His 10 C DM Xray-DM 2011 3ND0 Synechocystis sp. pcc 6803 H + /Cl − exchange transporter 18 466 420399 pASK His 6 C DM Xray-DM 2011 3ODJ H. in fl uenzae Peptidase (GlpG) 6 196 TOP10 pBAD His 6 C DDM Xray-C12E8 2011 3QNQ B. cereus Transporter (ChbC EIIC) 10 × 2 433 BL21(DE3) pET His 10 C DDM Xray-NM 2011 2KYV H. sapiens Phospholamban homopentamer 1 × 5 52 BL21(DE3) pET MBP N TX100
lsNMR-FC12 ssNMR- DOPC/DOPE
Table 2 ( continued ) PDB Organism Name TM 1 Length Strain(s) Vector Tag Size N/C 2 Solubilization 3 Structure 4 Date
lsNMR- DHPC/ DMPC
4DXW A. proteo-bacterium himb114 Na + channel (NaV) 6 × 4 228 BL21(DE3) pET21b His 6 C DDM Xray-NG 2012 4APS S. thermophilus Transporter (PepTSo) 12 + 2 491 C43(DE3) pWaldo-GFPe GFP + His 8 C DDM Xray-DDM 2012 4F8H G. violaceus Ligand-gated ion channel with ketamine (GLIC) 4 × 5 359 Rosetta ™ 2(DE3) pLysS pET26b MBP + His 10 N DDM Xray-TDM 2012 4F4L M. marinus Voltage-gated sodium channel pore 2 × 4 112 C41(DE3) pET15b His 6 N DDM Xray-MD 6 2012 2LNL H. sapiens Receptor (CXCR1) 7 309 BL21(DE3) pGEX2a GST + His 6 C IB-SDS ssNMR- DMPC 2012 4F35 V. cholerae Symporter 11 × 2 462 BL21(DE3) pET His 10 N DM Xray-MD 6 2012 4EV6 M. jannaschii Transporter (CorA Mg 2+ ) 2 × 5 317 Rosetta ™ 2(DE3) pNIC28 (pET28) His 6 N UDM Xray-UDM 2012 4H33 L. monocytogenes Channel (KyLm) 2 × 4 137 XL1-Blue pQE70 His 6 C DM Xray-DM (LCP) 2012 4EEB T. maritima Mg 2+ transporter (CorA) 2 × 5 351 BL21(DE3) CodonPlus pET15b His 6 N DDM Xray-DDM 2012 4B4A A. aeolicus Twin-arginine translocase (TatC) 6 240 Lemo56(DE3) pWaldo-GFPe GFP + His 8 C LMNG Xray-LMNG 2012 3UX4 H. pylori Channel (urea) 6 × 6 195 C43(DE3) pET His 6 Oth 8 DM Xray-MD 6 2012 4HYG M. marisnigri Presenilin (PSH) 9 × 4 301 BL21(DE3) pET21b His 8 N NM Xray-MD 6 2012 4HG6 R. sphaeroides Cellulose synthase (BcsA-BcsB) 8 + 1 802 + 707 Rosetta ™ 2(DE3) pETDuet His 12 N TX100 Xray-LDAO 2012 4G1U Y. pestis Transporter (HmuUV) 10 × 2 334 BL21(DE3) Gold pET19b His 10 N DDM Xray-DDM 2012 4GX0 G. sulfurreducens Channel (GsuK) 2 × 4 565 BL21(DE3) pQE70 His NS 5 C DM Xray-DM 2012 2LOU H. sapiens Apelin receptor 1 64 BL21(DE3) pEXP5-CT His 6 C IB-acetonitrile /tri fl uoroacetic acid lsNMR-FC12 2013 3ZKR E. chrysanthemi Ligand-gated ion channel (ELIC) 4 × 5 307 C43(DE3) pET11a MBP N UDM Xray-UDM 2013 4HUK N. gonorrhoeae MATE transporter (NorM) 12 459 BL21(DE3) pET15b His 6 N DDM Xray-DDM 2013 3VVN P. furiosus Multidrug and toxin compound extrusion (MATE) 12 461 C41(DE3) Δ acrB pET11a His 6 C DDM Xray-Cymal6 (LCP) 2013 4J9U V. parahaemolyticus Potassium ion transporter (TrkH) 10 × 2 485 BL21(DE3) pET31b His NS 5 C DM Xray-DM 2013 4HZU L. brevis ECF transporter complex 2 + 5 166 + 266 C43(DE3) pRSF-Duet-1 His 12 N DDM Xray-DM 2013 4HUQ L. brevis Folate ECF transporter (FolT + EcfT) 2 + 5 174/280 BL21(DE3) PET-Duet His 6 N DDM Xray-DM 2013 4J7C B. subtilis Potassium ion transporter (KtrAB) 8 × 2 465 + 222 BL21(DE3) pET24d His NS 5 N DDM Xray-Cymal6 2013 4HTS A. aeolicus Twin-arginine translocase (TatC) 6 236 BL21(DE3) pET33b His 6 N DDM Xray-DHPC or DDM 2013 4JQ6 Isolated from the Mediterranean Sea Proteorhodopsin (blue-light absorbing) 7 × 6 235 C43(DE3) pET28 His NS 5 NS 5 DM Xray-DM (bicelles) 2013 4KLY Gammaproteo- bacterium Proteorhodopsins (PRs), 7 259 C43(DE3) pET28a His 6 C DM Xray-DM 2013 2M6X Hepatitis C virus p7 hexamer channels 2 × 6 63 BL21(DE3) pMM-LR6 His-trpLE 9 N IB-gua + TX100 lsNMR-FC12 2013 4KPP A. fulgidus Ca 2+ /H + antiporter (CaX) 12 405 C41(DE3) pET GFP + His 8 C DDM Xray-DMNG (LCP) 2013 4KJS B. subtilis Ca 2+ /H + antiporter (YfkE) 11 × 3 351 BL21(DE3) pET22b His 6 Oth 8 DDM Xray-DDM 2013 3W9J P. aeruginosa Multi-drug e ffl ux transporter (MexB) 12 × 3 1052 MG1655 pUCP20-BHis His 10 C DDM Xray-DDM 2013 4IKV G. kaustophilus Proton-dependent oligopeptide transporter (POT) 12 507 C41(DE3) Δ acrB pCGFP-BC GFP + His 8 C DDM Xray-DDM (LCP) 2013 4HYJ E. sibiricum Proteorhodopsin 7 258 Rosetta ™ 2(DE3) pLysS pET32a His 6 C DDM Xray-DDM (LCP) 2013 2M3G Anabaena sp. PCC7120 Sensory rhodopsin 7x3 235 BL21(DE3) CodonPlus His 6 C DDM
ssNMR- DMPC/ DMPA
Table 2 ( continued ) PDB Organism Name TM 1 Length Strain(s) Vector Tag Size N/C 2 Solubilization 3 Structure 4 Date 2M6B H. sapiens Glycine receptor (hGlyR-α 1) 4 × 5 150 BL21(DE3) pLysS pET31b His 6 C IB-NS 5 lsNMR-LPPG 2013 4J72, 5CKR A. aeolicus MurNAc-pentapeptide translocase (MraY) 10 365 C41(DE3) NS 5 MBP + His 10 N DDM Xray-DM 2013 4KY0 T. kodakarensis Aspartate transporter 8 431 MC1061 pBAD24 His 8 C DM Xray-OG 2013 3ZJZ, 4CBC, 5BZB M. marinus Sodium channels 4 149 C41(DE3) pET15b His NS 5 NS 5 DDM Xray- HEGA10 2013 2LZL H. sapiens Growth factor receptor 3 (FGFR3) 1 × 2 43 BL21(DE3) pLysS pGEMEX1 TrxA-His 6 N TX100 lsNMR- FC12/SDS 2013 4M8J P. mirabilis Carnitine transporter (CaiT) 12 × 3 504 BL21(DE3) pLysS pET15b FLAG-His 6 C Cymal5 Xray-Cymal5 2013 4LDS S. epidermidis Glucose/H + symporter (GlcP) 12 446 C41(DE3) pET15b His NS 5 N DDM Xray-DDM 2013 4K0J C. metallidurans ZneA Zn(II)/proton antiporter 12 1045 C43(DE3) pET30b His 6 C DDM Xray-DDM 2013 4LTO A. ehrlichii Voltage-gated sodium channel (NaVAe1p) 2 × 4 152 C41(DE3) pET24 MBP + His 6 N DDM Xray-DDM 2013 4LZ6, 5C6N B. halodurans MATE transporter (DinF-BH) 12 446
BL21(DE3) ΔacrAB
Δ macAB Δ yojHI pET15b His 6 C DDM Xray-DDM 2013 3WAJ A. fulgidus OST (AglB) 13 875 C43(DE3) pET52b His 10 C DDM Xray-MD 6 2013 4C7R C. glutamicum Glycine betaine transporter (BetP) 12 × 3 566 DH5 α pIBA7 Strep N DDM Xray-Cymal5 2013 2MAW H. sapiens Neuronal acetylcholine receptor 4 137 Rosetta ™ 2(DE3) pLysS pMCSG7 His 6 N NS 5 lsNMR-LDAO 2013 2M8R, 3HD7 R. norvegicus Syntaxin 1A, TM & syntaxin complex 1 + 1 109 + 91 BL21(DE3) pET28a His 6 N TX100 or OG lsNMR-FC12, Xray-NG or C7G 2013 4CAD M. maripaludis Protease Rce1 (CAAX) 8 271 C41(DE3) pTriEX His 7 C UDM Xray-MD 6 2013 4N7W Y. frederiksenii Bile acid symporter 10 307 BL21(DE3) Gold pET His 10 N DDM DM 2013 4M64 S. typhimurium Na +/melibiose symporter (MelB) 12 476 DW2 pK95 native His 10 C UDM Xray-MD 6 2014 4BUO R. norvegicus Neurotensin receptor (NTS1) 7 335 BL21 Tuner pBR322 MBP + His 6 N MD 6 Xray-MD 6 2014 4O6Y A. thaliana Cytochrome B561 (Cyt b561 -B) 6 230 BL21(DE3) pET15b His 6 NS 5 DM Xray-NG 2014 4O9Y P. luminescens Tc toxin (TcA) 2 × 5 2516 BL21(DE3) CodonPlus pET28a His 6 N None None 2014 2M59 H. sapiens Endothelial growth factor receptor 2 1 × 2 37 Cell-free expression pET20b HA N Cell-free expression
pellet- trifl
Table 2 ( continued ) PDB Organism Name TM 1 Length Strain(s) Vector Tag Size N/C 2 Solubilization 3 Structure 4 Date 3SY9, 3SYS P. aeruginosa OM carboxylate channels (Occ) 18 430 BL21(DE3) pB22 His 6 N MD 6 Xray-C8E4 2012 3V8X N. meningitidis Transferrin (TbpA) 22 915 BL21(DE3) pET20b His 10 N Elugent Xray-C8E4 2012 4E1T Y. pseudo-tuberculosis Invasin beta-domain 12 245 BL21(DE3) pET9 His 10 N Elugent Xray-MD 6 (LCP) 2012 4GEY P. putida Carbohydrate transporter (OprB) 16 436 BL21(DE3) pBAD22 His 7 N Elugent Xray-C8E4 2012 2LME Y. entero-colitica Autotransporter (trimeric YadA) 12 105 BL21(DE3) pIBAYadM NT 9 OPOE
ssNMR- OPOE (micro- crystals)
2012 3VZT N. meningitidis OM protein (PorB) 16 355 BL21(DE3) pET21b His 6 C IB-urea Xray-TDDG 2012 4AFK, 4XNL P. aeruginosa Export protein (AlgE) 18 458 BL21(DE3) pET200 NS 5 OG Xray-LDAO (LCP) 2013 4K3C H. ducreyi β -barrel assembly machinery (BamA) 16 532 BL21(DE3) pET20b His 10 NS 5 Elugent Xray-C8E4 (bicelles) 2013 4HSC S. pyogenes Streptolysin O pore-forming toxin 4 571 XL1-Blue NF 7 NF 7 NF 7 NF 7 2013 4BUM D. rerio Voltage-dependent anion channel 2 19 289 M15 pQE60 His 6 C IB-gua Xray-LDAO 2014 4PR7 D. dadantii OM porin (KdgM) 12 222 BL21(DE3) omp8 pLysS pKSM717 His 6 C OPOE Xray-C8E4 2014 4N4R S. enterica LPS transport proteins (LptD – LptE complex) 26 786(LptD) + 196 (LptE) C43(DE3) pET28b and pACYCDuet-1 His 6 C SB3-14 Xray-OG 2014 4Q35 S. fl exneri Lipopolysaccharide transport (Lpt) 26 802 (LptD) + 175(LptE) BL21(DE3) pBAD22 His 6 C LDAO Xray-C8E4 2014 4MT0 N. gonorrhoeae OM multidrug e ffl ux pump (MtrE) 4 467 C43(DE3) pBAD22b Ω mtrE His 6 C DDM Xray-MD 6 2014 3J9C B. anthracis Protective antigen (PA-63) 14 562 BL21(DE3) pET22b-PA NT 9 None EM-Igepal 2015 4MKO P. entomophila β -barrel pore-forming toxins ( β -PFT), 2 236 Rosetta ™ 2(DE3) pLysS pETG-20A TrxA-His 6 N None None 2015 4RL9 A. baumannii Carbapenem-associated OM protein 8 255 BL21(DE3) and C43(DE3) pET15, pB22 His 6 N or C IB-urea Xray-C8E4 2015 4V3G K. oxytoca OM protein (CymA) 14 339 C43(DE3) Δ cyoABCD pB22 His 7 N Elugent Xray-C8E4 2015 2N2M Y pestis Attachment invasion locus (Ail) 8 156 NF 7 NF 7 NF 7 NF 7 NF 7 NS 5 lsNMR-DePC 2015 4RL8 P. putida OM channel (COG4313) 12 275 C43(DE3) pB22 His 6 C IB-urea Xray-C8E4 or MD 6 2015 5BUN S. enterica Antigenic OM protein 12 467 BL21(DE3) pHDST His NS 5 NS 5 DDM Xray-DDM 2015 2N6L P. aeruginosa OM protein (OprG) 8 215 BL21(DE3) pET30a His 6 C IB-urea
ssNMR- DHPC (micelles)
mutant hosts, C43(DE3) and C41(DE3) (54 and 30 uMPS, respectively). The BL21(DE3) host together with plasmids expressing either lysozyme or a rare tRNA (28 and 19 uMPS) follows in fourth andfifth position, respectively. Rosetta™2(DE3) was used for a total of 13 uMPS. Bacterial hosts other than those mentioned above have only had a marginal impact in the field (1 to 8 uMPS each). Production of homologous membrane proteins inE. colishows a similar pattern (Table 8), although nativeE. coli promoters were more frequently used (Fig. 5). As ex-pected, rare tRNA plasmids were not typically used for the production of homologous membrane proteins. The two most used bacterial hosts were BL21(DE3) and C43(DE3) yielding 41 and 26 uMPS, respectively
(Table 8).Table 9lists the genotypes of the bacterial hosts identified in
this analysis.
Expression systems that are not T7RNAP-based do not require λDE3-containing hosts. Despite this, it is noticeable that in the case of thearaexpression system, C43(DE3) is used more than any other strain: 16 out of 47 non-E. coliuMPS and 5 out of 12E. coliuMPS were pro-duced in C43(DE3). Whether thelacIsuper-repressor mutation or an-other mutation found in this host[12]is advantageous for the regula-tion of the arabinose promoter remains to be demonstrated.
The T7RNAP-based expression system in combination with C41(DE3) or C43(DE3) has been mostly used to produce α-helical membrane proteins, while BL21(DE3) and other BL21(DE3) derivatives were also used to produceβ-barrel membrane proteins. The situation is opposite for the arabinose expression system where C43(DE3) hosts produced mainlyβ-barrels. In the T7RNAP-based expression system, C41(DE3) and C43(DE3) hosts were more frequently used for uMPS containing more than 7 transmembrane domains, while BL21(DE3) was preferentially used for smaller proteins, typically with 1–2 transmem-brane domains (Tables 1 and 2).
It is clear that selecting the optimal combination of promoter, tag and bacterial host is key to achieving suitable recombinant membrane protein yields for biophysical studies. In order to provide some gui-dance, in our experience the following applies to the T7RNAP-based expression system with the C41(DE3) and C43(DE3) bacterial strains, which were originally derived using high copy number plasmids (200–600 copies/cell, such as those containing the pMB1 origin of re-plication). A non-exhaustive list of suitable plasmids includes pMW7 and derivatives (pHis and pRun)[13,14], pGEM (Promega), pRSET and pDEST (Invitrogen), pIVEX (5prime) and pPR-IBA (IBA). It is important to note that the chosen plasmid should not containlacI or lacO se-quences because further attenuation of the T7 promoter is often not needed for those expression hosts (see also comments on stability testing in Section3). For BL21(DE3) derivatives, medium copy number vectors (pET series) and those containinglacIandlacOsequences (e.g. pET 3, 9, 14, 17, 20 or 23 from Novagen) are more suitable because they reduce the amount of T7RNAP before induction. Use of the com-panion plasmid pLyS inhibits T7RNAP after induction. The BL21AI host, which contains the T7RNAP gene under the control of the arabi-nose promoter or the Lemo21 host[15], which contains a companion plasmid expressing the lysozyme gene under the control of the rham-nose promoter, may also be useful to titrate the amount or activity of T7RNAP.
[image:17.595.52.184.63.759.2]2.4. Promoter usage for yeast expression
Table 10 lists the yeast promoters and strains that are integral
components of yeast expression systems. Table 11 lists the corre-sponding genotypes. Typically, episomal plasmids are used for expres-sion inS. cerevisiae, while the expression cassette is integrated into the genome of P. pastoris. This situation probably results from the re-production of early successes with these combinations. Since theP. pastorissystem depends upon very strong promoters, only a few copies of the gene (as present in stably-integrated strains) are required to
Table
2
(
continued
)
PDB
Organism
Name
TM
1
Length
Strain(s)
Vector
Tag
Size
N/C
2
Solubilization
3
Structure
4
Date
5IMW
S.
intermedius
Cholesterol-dependent
cytolysins
(CDCs)
4
471
BL21(DE3)
pMCSg7
His
6
N
None
None
2016
5IMY
G.
vaginalis
Cholesterol-dependent
cytolysins
(CDCs)
4
490
BL21(DE3)
pMCSg7
His
6
N
None
None
2016
4ZGV
P.
atrosepticum
Plant-ferredoxin
receptor
(FusA)
22
868
BL21(DE3)
pET28a
His
6
N
IB-urea
Xray-MD
6
2016
5LDV
C.
jejuni
Major
OM
protein
(MOMP)
18
408
C43(DE3)
pTAMA
His
6
N
Elugent
Xray-C8E4
2016
5WQ8
V.
cholerae
Secretin
(GspD)
60
650
DH5
α
pASK-IBA3c
Strep
C
MD
6
EM-LDAO
2016
5LY6
S.
pneumoniae
Pneumolysin
4
×
42
471
BL21(DE3)
pET15b
His
6
N
None
None
2017
5VJ8
Yersinia
pestis
Attachment
invasion
locus
(Ail)
8
157
BL21(DE3)
pET30b
His
or
NT
9
6
C
IB-urea
lsNMR- DMPC/ DMPG (nanodisc)
2017
1
Number
of
transmembrane
domains.
2
N-or
C-terminal
position.
3
Solubilization
detergent.
4
Detergent
used
for
structure
determination.
5
Mixed
detergents.
6
Not
speci
fi
ed
in
PDB
or
corresponding
publication.
7
Not
found
or
article
was
not
accessible.
8
Inclusion
bodies
solubilised
in
6
M
guanidine
hydrochloride.
9
No
impact of secretory stress and clonal instability are areas on which in-vestigators have focussed attention in the search for productive re-combinantP. pastorisstrains[16]. A recent report has streamlined the
‘time-to-strain pipeline’inP. pastoris[17]. In contrast, inS. cerevisiae, the promoter may be 10- to 100-fold weaker, so the use of episomal plasmids with high copy numbers is advantageous; episomal plasmids are available forP. pastoris[18], but are not yet widely used in struc-tural biology projects.
The strongS. cerevisiaepromoter, PGAL1, is induced with galactose while PAOX1(a very strongP. pastorispromoter) is induced with me-thanol[19]. In choosing a strong promoter, the idea is that transcrip-tion should not be rate limiting. However, high mRNA synthesis rates may be countered by high rates of mRNA degradation[20]. Evidence from bacterial expression systems suggests that lowering promoter ef-ficiency via mutation can lead to improved functional yields of mem-brane proteins for some, but not all, targets[21]. It has been proposed that the ideal inducible system would completely uncouple cell growth from recombinant synthesis, which requires the host cell to remain metabolically capable of transcription and translation in a growth-ar-rested state. In this scenario, all metabolicfluxes would be diverted to the production of recombinant protein[22]. While this approach is yet to be demonstrated for membrane protein production in yeast cells, soluble chloramphenicol acetyltransferase was produced to more than 40% of total cell protein inE. coli[23]suggesting that this may be a strategy worth exploring in yeast. As for bacteria, yeast growth rates often (but not always) decline dramatically upon induction of yeast cultures, in part achieving this state.
3. Bacterial expression systems for membrane protein production:
PT7-based expression protocols
3.1. Optimization of culture growth conditions for improved membrane protein production
We have previously examined the importance of optimizing growth conditions for improved membrane protein production in bacterial host cells [24,25] and have published an analysis of the T7RNAP-based expression system[8]. Here we combine these insights with our up-dated analysis of the PDB. For simplicity, we refer only to the T7RNAP-based expression system in this section, but the principles of most of our advice can be applied more widely to other microbial expression hosts. An important, but simple, test that should be done prior to culturing recombinant strains is to assess whether the selected plasmid/bacterial host combination is stable over time in the medium to be used for large-scale production. We suggest assessing individual cultures from five independent colonies. After overnight growth in the presence of a sui-table antibiotic, 10−6, 10−7and 10−8dilutions should be plated on 2∗TY agar with and without antibiotic. If the same number of colonies is obtained in the absence or presence of antibiotic, then the plasmid is stable and it is appropriate to proceed to growing large-scale cultures. However, if the number of colonies is higher in the absence of anti-biotic, the expression plasmid is unstable (even prior to inducing ex-pression of the target gene), and it is not advisable to prepare a large-scale culture. In this scenario, it would be prudent to change to a better regulated host strain such as C41(DE3), C43(DE3), Lemo21(DE3) or BL21(DE3) pLysS. Alternatively, some investigators do not plate cells after heat shock but use the whole transformation medium as a pre-culture [26]. By doing this, they take advantage of the significant variability in target gene expression level from one colony to another, in the hope of achieving a reasonable recombinant protein yield.
In general, however, it is preferable to start from freshly-trans-formed bacterial cells. A typical approach is to inoculate 5 ml 2∗TY medium with an isolated colony and incubate overnight. The next morning, this should be used to inoculate 500 ml of 2∗TY medium in a
be impairing cell growth, which usually affects the stability of the ex-pression plasmid. Instead of the typical induction protocol (0.7 mM IPTG at A600= 0.6), two options are also worth trying. Thefirst is not to add IPTG and instead to let the culture grow overnight at 30 °C or 37 °C. This protocol works well for high copy number plasmids that are not regulated (i.e. they lack the T7lacpromoter and/or multicopylacI
or lysozyme gene expression); two membrane protein structures were obtained without inducing the culture in this way[27,28]. The second method is to add IPTG at the beginning of the stationary phase (A600= 1) either in trace amounts (10μM) following the improved protocol of Alfasi and colleagues [29] or at a high concentration (0.7 mM) in the stationary phase (Table 12). However, adding IPTG in the stationary phase is not recommended when using C41(DE3) or C43(DE3) and will result in decreased expression levels of the target gene.
3.2. Selection of mutant T7RNAP-based expression strains for toxic genes
C41(DE3) and C43(DE3) were originally selected as part of a strategy to produce a membrane protein target that was toxic to BL21(DE3) host cells[30]. The protocol summarized here allows the selection of a bacterial strain to produce any given toxic target mem-brane protein. Having a reporter gene such as GFP makes the experi-ment faster but is not essential; C41(DE3) and C43(DE3) were selected without the use of afluorescent reporter.
The expression plasmid containing the gene of interest should be transformed into BL21(DE3) using calcium chloride and with 1–10 ng of plasmid. After incubation of the 1 ml transformation culture for 1 h at 37 °C, 100μl are spread onto a 2∗TY plates with antibiotic and onto 2∗TY plates with antibiotic supplemented with either 0.4 mM or 0.7 mM IPTG (this range avoids the non-specific toxicity of IPTG above 0.7 mM). If the vector expressing the target membrane protein does not prevent cell growth on IPTG-containing plates, mutant strains cannot be selected. If there are hundreds of colonies in the absence of IPTG but very few in the presence of IPTG, some mutants may appear at high frequency.
Typically,five selection experiments can be performed in one day: five 250 ml flasks containing 50 ml 2∗TY medium with antibiotic are each inoculated with one bacterial colony. Once the culture has reached A600= 0.4–0.6, IPTG is added at 0.7 mMfinal concentration to induce gene expression. One to two hours after induction, 1 ml culture is harvested and serial 10−1to 10−4dilutions are plated onto the IPTG-and antibiotic-containing plates. The frequency of appearance of mu-tant hosts varies from 10−4to 10−6[30]. After an overnight incubation at 37 °C, the number of colonies of different sizes is counted. Large colonies have usually lost the ability to express the target gene in contrast to small colonies, which arise at a frequency of 1–20%.Fig. 6 shows selection experiments with the greenfluorescent protein (GFP) as a reporter gene. Panel A shows the size difference between mutant hosts under normal light while panel B shows the same plate under UV ex-posure. Almost all the small colonies are green and therefore express high amounts of GFP. Large colonies exhibit no or weakfluorescence. Panel C shows a selection experiment where all colonies are small. Among them, some exhibit very highfluorescence intensity. Panel D shows another independent experiment where medium colonies are fluorescent, while the very small ones are not. In the case where a GFP reporter is not being used, membrane protein production can be as-sessed by immuno-detection or by staining an SDS-PAGE gel with Coomassie Brilliant Blue.
Table 4 Unique membrane protein structures derived from recombinant proteins produced in Saccharomyces cerevisiae. PDB Organism Description TM 1 Size Host Vector Tag L 2 N/C 3 Solub 4 Struct 5 Date Alpha-helical 1O5W R. norvegicus Monoamine oxidase (MAO) 1 534 BJ2168 YEp51 His 6 N FC12 Xray-MD 7 2004 2Z5X R. sapiens Monoamine oxidase (MAO) 1 513 BJ2168 YEp51 His 6 N FC12 Xray-MD 7 2008 4A01 V. radiata H + translocating pyrophosphatases (H + -PPases) 16 766 BJ2168 pYVH6 His 6 C DDM Xray-DM 2012 4AV3 T. maritima Pyrophosphatases (M-PPases) 16 735 BJ1991 pRS1024 His 6 N DDM Xray-OGNG or Cymal5 2012 4IL3 S. mikatae CaaX protease Ste24p 7 461 BJ5460 pSGP46 His 10 C DDM Xray-C12E7 2013 4J05 P. indica Phosphate:H + symporter (PHS) 12 530 DSY-5 p423-GAL1 His + FLAG 10 C DDM Xray-NG 2013 4K1C S. cerevisiae Ca 2+ /H + exchanger (VCX1) 11 421 DSY-5 p423-GAL1 His + FLAG 10 C DDM Xray-DDM 2013 4NAB O. cuniculus Sarco(endo)plasmic reticulum Ca 2+ -ATPase (SERCA) 10 1000 W303.1b Gal4-2 pYeDP60 BAD C C12E8 Xray-C12E8 2013 4C9G S. cerevisiae Mitochondrial ADP/ATP carrier 6 318 WB12 pYES3 His 8/9 N UDM Xray-DM or Cymal5 2014 4LXJ S. cerevisiae Cytochrome P450 1 536 MMLY941 NS 6 His 6 C DM Xray-DM 2014 4WIS N. haematococca Anoctamin family (TMEM16) 10 × 2 735
FGY217 (Δ
[image:20.595.112.464.57.750.2]required to cure C41(DE3) from the pOGCP expression plasmid[30]). If the mutation is in the expression vector, transformation of the isolated plasmid into BL21(DE3) cells should give colonies on IPTG-containing plates; if there are no colonies, then the isolated colony carries the mutation.
3.3. Expression of non-toxic or moderately-toxic target genes
Expression of genes encoding non-toxic or moderately-toxic mem-brane proteins cloned in T7 expression plasmids lead to colony for-mation on IPTG-containing plates. Toxicity is inversely proportional to the size of colonies on these plates. We have observed that antibiotic use is not required in large-scale cultures, providing that antibiotic has been added to the preculture [24]. The induction protocol must be adjusted depending on the size of the colonies on IPTG plates
(Table 12). If the size reduction is marginal compared to plates lacking
IPTG (< 10%), this may suggest that the production yield of the target membrane protein is very low. To maximize the chance of obtaining high yields, 0.7 mM IPTG should be added at the early exponential phase (A600≤0.4). If the size of the colonies is decreased by 10% or more, then IPTG should be added at A600= 0.6 at the two
concentrations that are most frequently used[8]: 0.4 mM and 0.7 mM
(Table 12). Autoinduction has been used with the T7 and arabinose
expression systems ([31]andTable 2in the cases of 4HYJ, 4KJS and 3FID). InE. coli, glucose is a catabolic repressor that is catabolized before any other carbon source. Autoinduction media take advantage of this; they contain glucose to allow the bacterial cells to grow to high densities, but when the glucose has been exhausted, cells switch on operons involved in the catabolism of the other carbon sources present. Autoinduction media contain a defined amount of lactose that can bind to lacI and stimulate the expression of T7RNAP. Commercial auto-induction media are not cheap, but are a useful option when leaky expression is toxic and prevents cell growth prior to IPTG addition. Another option to circumvent toxicity is to decrease the temperature of the culture 30 min before IPTG addition. In a previous study[8], we demonstrated that in approximately 50% of studies using T7 expression systems, lowering the temperature (i) prevented the formation of in-clusion bodies, (ii) improved the solubility of the recombinant mem-brane protein, (iii) reduced toxicity or (iv) prevented overgrowth of the culture by cells that had lost the expression plasmid[30].
3.4. Collecting proliferated membranes or inclusion bodies fromE. coli
hosts
Formation of inclusion bodies containing a recombinant membrane protein (IBMP) occurs frequently in bacteria especially for non-E. coli
targets. Inclusion body formation is usually not toxic to the cell, the recombinant protein can be accumulated to very high levels and, in some cases, the protein is in an‘amyloid’form which entraps functional protein [4]. Bacterial inclusion bodies have been shown to sponta-neously penetrate mammalian cells and can be targeted to specific re-ceptors, opening the way to deliver functional drugs. Due to their natural abundance and the fact that Ni2+-affinity chromatography can be performed in denaturing conditions, IBMP can be purified in large quantities. One application is their use as an alternative to peptides for raising specific antibodies against eukaryotic proteins[5,6]. As men-tioned in Section2.1, large scale refolding of inclusion bodies has been attempted in thefield of structural biology and some progress has been made especially for NMR analysis. For instance, several G protein-coupled receptors (GPCRs) have been produced in a functional form (after refolding ofE. coli-produced inclusion bodies in amphipols[7,8]) proteins produced in microbial expression systems.
Origin of membrane protein
Expression system
Escherichia coli Pichia pastoris
Saccharomyces cerevisiae
Total
E. coli 144 0 0 144
Non-E. coli bacteria 237 0 2 239
Plant 2 5 3 10
Mammal 41 18 5 64
Bird 0 3 0 3
Virus 5 0 0 5
Fungus 4 1 12 17
Archaea 28 0 0 28
Parasite 2 0 0 2
Other1 5 4 0 9
Total2 468 31 22 521
1Plexaura homomalla, Danio rerio, Eisenia fetida, Actinia fragacea,
Caenorhabditis elegans.
[image:21.595.311.552.53.257.2]2The PDB was analyzed in November 2017.
[image:21.595.39.289.89.234.2]Fig. 1.Secondary structure analysis of recombinant membrane proteins pro-duced inE. coliand yeast for which a structure has been resolved. Data were obtained fromTables 1–4. The percentage of unique membrane protein struc-tures is plotted as a function of their secondary structure for recombinant membrane proteins produced either in yeast (grey) orE. coli(black).
[image:21.595.42.286.276.460.2]misfolded membrane proteins in solution, as exemplified by the mi-tochondrial uncoupling protein structure (2LCK,Table 2) which is not physiologically relevant[10]. Consequently, although producing IBMP for structural studies could be considered, we have focused on targeting heterologous membrane protein targets to bacterial membranes, ideally in proliferating membranes.
Intracellular formation of membranes inE. colihas been observed upon the overproduction of several classes of proteins: 1. integral membrane proteins including the whole ATP-synthase[32]or AtpF, its membrane bound subunit b[33], the chemotaxis receptor Tsr[34], the
sn-glycerol-3-phosphate acyltransferase [35] and the fumarate re-ductase[36]; 2. monotopic membrane proteins including the glyco-syltransferase MurG [37]; the monoglycosyldiacylglycerol synthase (MGS) fromAcholeplasma laidlawii[38,39]and the N-methyltransferase PmtA fromAgrobacterium tumefaciens[40]; and 3. Amphipatic protein oligomers made of caveolin[41,42]or deriving from elastin-like pep-tide repeats (ELP,[43]).
AtpF is a good example of anE. colimembrane protein that can be produced either as inclusion bodies in C41(DE3) or in a folded state within internal proliferating membranes in C43(DE3). Accumulation of
atpFmRNA is similar 3 h after induction in both expression hosts but the time course of expression is delayed by 30 min in C43(DE3)[3]. Optimized expression conditions were 16 h of induction with 0.7 mM IPTG at 25 °C. In these conditions, the viability of the cells was restored and overproduction of AtpF did not trigger toxicity.
Despite this example, inclusion body formation is frequent and difficult to avoid with eukaryotic membrane protein targets. When producing a membrane protein in bacteria, it is therefore important to check for the presence of inclusion bodies and to prepare carefully cellular or internal bacterial membranes. Inclusion bodies can be iso-lated following two centrifugation steps: 600g for 10 min to collect unbroken cells and cell debris in the pellet, followed by 10,000gfor 15 min at 4 °C to collect inclusion bodies from the supernatant. Bacterial membranes remain in the 10,000gsupernatant; they can be pelleted after high speed centrifugation, usually 100,000gfor 1 h. To collect bacterial membranes in the absence of inclusion bodies, disrupt the bacteria (at least 1 L of culture) by passing the suspension twice through a French Press or cell disruptor. If a recombinant membrane protein triggers internal membrane proliferation, such as AtpF-induced intracellular membranes [11], those membranes can be immediately collected following low speed centrifugation: 2500g for 10 min (P1 pellet). The pellet contains internal membranes but also unbroken cells and debris that need to be washed away. The supernatant (S1) contains inner and outer membranes, which are collected by centrifugation of S1 at 100,000gfor 1 h at 4 °C. Proliferated membranes within P1 are then washed and unbroken cells are removed after centrifugation at 2500g
for 10 min at 4 °C. The supernatant (S2) contains the washed internal membranes, which are collected after 1 h centrifugation at 100,000g.
The next step is to separate membrane vesicles according to their spe-cific density on a sucrose gradient. For high purity requirements, con-tinuous gradients are used.
4. Ptac-based protocols: The use of plasmid pTTQ18
As shown inTable 5,E. colihas been engineered and optimized for use as an expression host to produce proteins from both prokaryotic and eukaryotic organisms. This section is concerned exclusively with the overexpression of genes encoding prokaryotic membrane proteins, for whichE. coliis usually an ideal expression host. The strain ofE. coli
illustrated here, BL21(DE3), was selected for its lack of both thelonand
ompT proteases, and as a consequence of the previous successes achieved for high-level expression of membrane transport proteins [44–51]. Overexpression of all target genes is initially examined and verified by the culture ofE. coliBL21(DE3) host cells, harbouring the
Table
6
(
continued
)
PDB
Organism
Name
TM
1
Length
Strain(s)
Vector
Tag
Size
N/C
2
Solub
3
Struct
4
2N7Q
H.
sapiens
Human
nicastrin
1
54
NS
6;
T7
pET29b
His
6
N
IB-urea
lsNMR-SDS
or
FC12
5ID3
C.
elegans
Mitochondrial
calcium
uniporter
2
×
5
159
BL21(DE3)
T7
pET21a
His
6
C
FC14
lsNMR-FC14
5KTF
M.
musculus
High
density
lipoprotein
(HDL)
2
73
BL21(DE3)
CodonPlus
pQE30
His
8
N
Empigen
lsNMR-LPPG
2K4T
H.
sapiens
Anion
channel
(VDAC-1)
19
291
BL21(DE3)
T7
pET21a
His
6
C
IB-urea
lsNMR-LDAO
Beta-barrel 3EMN,
4C69
M.
musculus
Anion
channel
(VDAC-1)
19
295
M15
pQE9
His
6
N
IB-gua
8
Xray-LDAO
(bicelles)
2JK4
H.
sapiens
Voltage-dependent
anion
channel
(VDAC)
19
294
M15
;
NS
6
PDS56
His
6
C
IB-gua
8
Xray-Cymal5
4BUM
D.
rerio
Voltage-dependent
anion
channel
2
19
289
M15T5
pQE60
His
6
C
IB-gua
8
Xray-LDAO
5GAQ
E.
fetida
β
-pore-forming
toxins
(
β
-PFTs)
2
310
Rosetta
™
2(DE3)
T7
pHis-Parallel1
His
6
C
None
EM-DDM
1
Number
of
transmembrane
domains.
2
N-or
C-terminal
position.
3
Solubilization
detergent.
4
Detergent
used
for
structure
determination.
5
Mixed
detergents.
6
Not
speci
fi
ed
in
PDB
or
corresponding
publication.
7
Not
found
or
article
was
not
accessible.
8
Inclusion
bodies
solubilised
in
6
M
guanidine
hydrochloride.
9
No
plasmid pTTQ18[45–47]containing the gene of interest, in 50 ml LB medium and inducing with 0.5 mM IPTG at mid-log phase (A680 ∼ 0.4–0.6). The cells are harvested 3 h after induction of thetacpromoter and total membranes are prepared from spheroplasts by the water lysis method (Fig. 7). The total membrane proteins are separated by SDS-PAGE and stained with Coomassie brilliant blue and/or analysed by Western blotting with an anti-His antibody. If a protein is found to overexpress well, scaling-up of bacterial culture volumes is undertaken [44]. This is often performed with 30 or 100 L fermenters [52]and inner membranes containing the protein of interest are prepared from the cells using sucrose density gradients (Fig. 7). Note that whole cell lysates can be used for this screening step, but there is a danger of missing successful expression, because the protein is located only in the membrane fraction comprising less than 10% of total cell protein, po-tentially leading to false-negative results.
In our extensive experience of using plasmid pTTQ18 for the het-erologous production of bacterial membrane proteins in E. coli
BL21(DE3), inclusion bodies did not appear. Rather the recombinant protein appeared in the membrane fraction of the disrupted host cell, where it was functionally active in all cases tested.
4.1. General choices and considerations for cloning into plasmid pTTQ18
[image:24.595.70.531.54.268.2]Our preferred cloning strategy is based on the traditional restriction enzyme method, which involves the digestion of both vector and am-plified DNA fragments with the relevant restriction enzymes to enable DNA ligation. This method is not high-throughput but is reliable. The pUC-based plasmid pTTQ18[45]is a high copy number vector, which has been used successfully for the overexpression of diverse membrane transport proteins of the Major Facilitator Superfamily (MFS) Fig. 3.Tag usage for recombinant membrane protein production in microbes. Data were obtained fromTables 1–4. The number of unique membrane protein structures is plotted as a function of the purification tag present in the corresponding recombinant membrane protein following production in (A) bacteria (black) or (B) yeast (grey).
[image:24.595.86.518.492.718.2][46,47,50,53–55], the 5-Helix Inverted Repeat Transporter superfamily (‘5-HIRT’, commonly known as the ‘LeuT’superfamily [54,55], two-component system (TCS) membrane regulatory proteins[56,57], Pro-teobacterial Acinetobacter Chlorhexidine Efflux (PACE) family efflux proteins[58]and soluble proteins (e.g.[59]). The efficacy of pTTQ18 as an expression vector for different classes of membrane proteins has been tested and compared with other types of plasmid construct
[46,47,54,60]. Also, the desirability of placing a tag (usually (His)n) at
either the carboxyl-terminus or the amino-terminus of the cloned gene has been discussed[61]. Plasmid pTTQ18 contains a polylinker/lacZα regionflanked by a hybridtrp-lac (tac) promoter. The tacpromoter consists of the -35 region of thetrppromoter fused with the lacUV5 -10 region of thelacpromoter (Fig. 8). Basal expression of thetacpromoter is minimized by binding of the LacI repressor, encoded by thelacIq gene, to thelacoperator downstream of the promoter. Also downstream of thetacpromoter is the multicloning site, which permits the use of eitherEcoRI or NdeI restriction enzyme sites at the 5ˊend of the am-plified gene, andPstI orHindIII enzyme sites at the 3ˊend of the gene, for successful ligation. The pTTQ18 plasmid also contains theblagene for the expression ofβ-lactamase, conferring ampicillin or carbenicillin resistance (Fig. 8).
The affinity tag of choice in this strategy is the RGSHis6 motif, which is present on a modified pTTQ18 between thePstI and theHindIII restriction sites, so incorporating the tag onto the carboxyl-terminus of the protein (Fig. 8). The orientation of the carboxyl-terminus of the protein is important since previous experience has shown that, if the carboxyl-terminus is periplasmic, the use of the hexahistidine tag will be unsuccessful (Saidijam, M., Baldwin, S.A., personal communica-tions). A possible cause for this is the inability of the hydrophilic his-tidine tag to traverse the hydrophobic membrane domain. It is therefore necessary before cloning to assess the predicted topology of the protein, combinant non-E. coli(heterologous) membrane proteins.
Bacterial strain Promoter used in the expression plasmid Total
T7 ara T5 tet trp, tac, lac, rham
Not specified
BL21(DE3) 88 7 2 3 6 1 107
BL21(DE3)ΔacrB 1 1
BL21(DE3) omp5 1 1 2
BL21(DE3)
ΔacrABΔmacABΔyojHI
1 1
C43(DE3) 34 16 2 52
C43(DE3)ΔcyoABCD 1 1
C43(DE3)ΔacrB 1 1
C41(DE3) 27 2 29
C41(DE3)ΔacrB 1 1
BL21(DE3) pLysS 24 2 1 27
BL21(DE3) omp8 pLysS 1 1
BL21(DE3) CodonPlus1 14 1 1 3 19
Rosetta™2(DE3) T7 8 8
Rosetta™2(DE3) pLysS T7 5 5
BL21(DE3) Tuner 2 1 3
BL21(DE3) Star 2 2
SE1 T7 1 1
BL21(DE3) Gold 3 1 4
BL21-Gold pLysS 1 1
GJ1158 1 1
Lemo21(DE3) 2 2
Lemo56(DE3) 1 1
Origami B 1 1
Rosetta- Origami B pLysS 1 1
B834 2 1 3
B834 pLysS 1 1
PA (ΔoprH) 1 1
DH10B/TOP10 7 7
XL1-Blue 1 5 1 1 8
BL21(DE3) AI 1 1 2
DW2 1 1
DH5α 2 1 3
SG1309 2 2
MC4100 1 1
SCM6 1 1
MC1061 5 5
JM83 2 2
M15 1 1 2
EP51 1 1 2
KRX 1 1
MG1655 1 1
JM109 1 1
420399 1 1
AR58 1 1
BLR 1 1
GT1000Δ(glnK,amtB) 1 1
PAP5198 1 1
K38 1 1
AD202 1 1
Not found 2 2
Not specified 3 1 4
Cell-free expression1 4 4
Total 229 47 15 13 24 5 3332
1Cell-free expression of genes encoding membrane proteins using E. coli
lysates;
2The number of expression hosts is higher than the number of uMPS because
some recombinant proteins were produced in several expression hosts.
combinantE. coli(homologous) membrane proteins.
Bacterial strain Promoter used in the expression plasmid
T7 ara T5 tet trp, tac, lac, rham Native Total
BL21(DE3) 31 2 1 5 2 41
C43(DE3) 18 5 2 1 26
C41(DE3) 9 1 10
BL21(DE3) pLysS 7 7
BL21(DE3) CodonPlus 1 1
BL21(DE3) Star 1 1
BL21(DE3) Star pLysS 3 3
Rosetta™2(DE3) 1 1
BL21(DE3) Tuner 1 1 2
SE1 T7 1 1
BL21(DE3) Gold 3 3
LE392 1 1
LMG194 1 1
TNE012 1 1
HM125 1 1
XL1-Blue 1 1 2
DW35 2 2
BZB1107 2 2
AW740 1 1
MH225 1 1
HN705Δomp8 1 1
MEG119 1 1
GO105 1 1
GL101 1 1
FT004 1 1
DK8 1 1
pop6510 1 1
B834 2 3 1 1 1 8
WH1061 1 1
HN741 1 1
MJF612 1 1
DH5α 1 1 2
TOP10 1 1 2
HDB150 1 1
M15 2 2
LCB2048 1 1
UT5600 1 1
JM109 1 1 2
Not specified 2 1 1 3 7
[image:25.595.307.558.89.473.2] [image:25.595.41.285.93.615.2]