~
z
Ll.l
~
D.
0
...1
Ll.l
>
Ll.l
c
ISSN 1012-2184
INFOFINANCE
1997
The aid managed
lly
the Directorate-General for Development (DG VIII) of the European Commission is finanud through
the European Developmen
t
Fund
(
EDF) and the General Community Budget
.
On
the one hand the EDF, the financial
instrument of the
Lome
Convention, is the subJect of ad hoc contributions
lly
the Member States.
On
the other hand, finanud
Uy
the Community oom resourus, a large number of budget headings under the Community Budget iUustrate the effort of
the European Union in favour of the developing countries of the A CP (Africa, Caribbean, Pacific), MED (Mediterranean),
ALA (Latin America and Asia) and/or of other countries concerned.
The
main budget headings cover food aid, support for
NGOs, rehabilitation actions, environment, health, derrwcracy and human rights and, more recently, South Africa.
It should be noted that development aid financed through the Community Budget can be destined for both ACP and
non-ACP countries alike, whereas the EDF, a much
less
"horizontal" instrument, is destined for the ACP countries only .
The EDF provides grants for aid programmes for the 70 ACP countries that are signatories to the Lome Convention. EDF funds are made up of ad hoc contributions by the Member States and are not included in the Union budget. In 1997, the Commission has been implementing the 6th and the 7th EDF. Their operations are governed by programmes of priority need focused mainly on areas such as education, health, rural development, infrastructure, private investments ...
The 8th EDF, is endowed with 12,967 MECU (Millions of ECU) and will continue intervening for programmable aid, Stabex, Sysmin, structural adjustment etc ... It should enter into force during 1998, following the achievement of the process of ratification of the agreement amending the 4th Lome Convention, signed in Mauritius on the 4th of November 1995.
ANNUAL BREAKDOWN OF AID BY INSTRUMENT UNDER THE EDFs
•···•··•····•••·••·•····•···•···••··•···••··•·•·•
(ACP and OCT
1)
Amounts in MECU 1997 1996 1995
Instruments Decisions' Contracts' Payments Decisions Contracts Payments Decisions Contracts Payments
; Programmed aid 403,83 824,41 891,26 656.48 847,65 833,94 828.58 816.78 740,02
.
; Structural adjustment 40.70 57,20 74.35 51,10 95,53 94,65 145,50 164,02 232,63; Risk capital
; Interest rebates
.
; Emergency aid
; Aid for refugees
: Sysmin
: Stabex
.
: TOTAL
.
EUROPEAN COMMISSION
DE 100
March 1998
13.05 6,90 118,07 47,33 205,93 122,17 256,82 273,33 123,87
-7,30* -7,75 52,94 31,60 33,01 31.90 35.53 52,60 25,20
-4,37* 0,91 10,07* -11,87 -12,62 33,84 33,68 72,39 107,30
1,73* 5.35 8,29* 1,19 1,43 7,74 4.40 11,22 12,28
168,35 55.67 38,98 33,95 54,81 28,14 84,49 27,00 19,12
0,00* 18.73 18,73 155,08 154,28 164,99 131,09 178.37 303,26
615,99 961,42 1.212,69 964,86 1.380,02 1.317,37 1.520,09 1.595,71 1.563,68
* These amounts are not included in the following pie-charts because of their low and/or negative values.
Percentage of decisions by instrument in 1997
Risk capital 2%
Structural adjustment
7% Programmed a64% id
Percentage of payments by instrument in 1997
Sysmin 3% Stabex 2%
Interest rebates 4% Risk capital
10%
Structural adjustment 6%
Programmed aid 75%
I. ACE; the countries of Afiica, the Canibean and the Pacific that are signatories to the Lome Convention. QQ: the 011erseas countries and tenitories included in the agreement of association. 2 ~ taken by the Commission in favour of development actions approved by the EDF Committee (except for projects smaller than 2 MECU). The ~rrultmeous management of several EDF\ as well
as the gap in time between the original decision and the subsequent contracts, account for the variances in the annual totals for contracts and payments.
INFOFINANCE
1997
ANNUAL BREAKDOWN OF AID BY SECTOR UNDER THE EDFs
...
(ACP and OCT)
.
Amounts in MECU 1997 1996 1995
Sector Decisions Contracts Payments Decisions Contracts Payments Decisions Contracts
: Social infrastructure and services /59,68 /69,12 195,73 228,83 /96,79 191,13 317,03 196,82
-Education -1,54 38,74 45,42 27,47 31,30 46,49 22,90 33,26
-Health -I' 12 38,22 33,31 62,09 16,65 25,12 41,81 34,32 - Population programmes 2,00 6,02 7,86 1,23 5,93 8,43 26,45 7,16 - Water supply and sanitation -4,11 15.74 47,82 26,59 57,68 44.36 53.92 53,79 - Government and civil society 137.15 34.09 27.64 48,36 21,32 23,39 22,84 16,42 - Other social infrastructures 27.30 36.31 33,68 63,09 63,91 43.34 149.11 51,87
: Economic infrastructure and services 180,90 291,49 321,39 193,58 393,30 267,15 376,86 375,00
.
-Transport and storage 155.22 273,31 208,89.
152,01 301,16 166,63 213,79 153.88-Communications -0,53 3,12 16.96 5.68 22,04 24,16 15,99 54.25
-Energy 25,86 12,04 73.18 8,99 40.51 44,06 97,68 116,35
-Finance 0.05 1,17 21.55 15.67 28.38 31.99 49,34 50.56 - Other services 0.30 1.85 0.81 11.23 1.21 0.31 0.06 -0.04
: Production 88,61 158,70 247,01 79,60 284,05 246,20 275,26 203,49
.
.
- Agriculture, fishing and forestry -11,90 75,83 117.39 -12,96 118,27 113,63 71.63 87.23 -Industry. mining and construction 99,15 59,74 92,21 77,50 127,32 99.57 172.24 90,71-Trade and tourism 1.36 23.13 37,41 15,06 38,46 33,00 31,39 25.55
.
: Multisector -13,65* 84,85 184,41 /,63 152,25 226,50 /60,/9 330,34
: Commodity aid & general progr. assistance 90,56 208,09 222,11 288,44 311,90 344,63 405,82 413,74
-Structural adjustment 89,38 186.75 190,81 134,81 157,17 177.19 276,57 233.02 - Other gen. progr. and comm. assistance 1,18 21.34 31.30 153.63 154.73 167,44 129,25 180,72
Emergency assistance -9,70* -1,68 8,86* 55,74 -8,93 35,68 49,54 89,76 Others 119,59 50,85 33,18 117,04 50,66 6,08 -64,61 -13,44
Grand Total 615,99 961,42 1.212,69 964,86 1.380,02 1.317,37 1.520,09 1.595,71
• These amounts are not Included 1n the following pie-<:harts because of their comparatively low and/or negative values.
Percentage of decisions
by sector in 1997
..
Commodity aid and general programme
assistance
14%
.
..•.•.••....•...•.•..•..••...•....•....••
.
.
Payments
149,44 27,12 24.72 6,13 36,62 13,37 41,48
210,55
135,91
9.49
41,34
23,75 0.06 192,19 105,11
64.50 22.58 289,09 619,47 312.35 307,12 105,56 -2,62 1.563,68
Percentage of payments
...
.
Multi sector 15%
.
Others3%
Production
21%
by sector in 1997
Economic infrastructure and services
27%
INFOFINANCE
1997
·· ··· ·· ··· ·
ANNUAL BREAKDOWN BY GEOGRAPHICAL AREA UNDER THE EDFs
Amounts in MECU 1997 1996 1995
Region Decisions Contracts Payments Decisions Contracts Payments Decisions Contracts Payments
Western Africa 144.35 218,04 345,29 172.50 356,69 385,83 392,47 461,02 420,00
Central Africa 53 71 10783 75 32 7923 81 17 10859 17852 91 32 10249
Eastern Africa 49.34 89,77 137.74 78,73 112,65 130,53 104,46 203,14 210,04
Horn of Africa 66,64 74.33 45.70 66,00 82,19 SO, II 32,93 50,03 67,02
Southern Africa 21.13 118,09 178,69 187,05 198,24 170,46 275,95 241,94 224.74
Indian Ocean 42,18 68,75 85.31 14,29 80,99 53.31 41,07 46,54 32,64
Total Africa 377,35 676,8/ 868,05 597,80 911,93 898,83 /.025,40 /.093,99 1.056,93
Caribbean 86,33 109,39 99,69 166,44 162,00 143,42 /92,74 177,59 186,78
Pacific 16,31 28,16 31,51 16,45 53,76 40,47 46,47 37,26 66,49
Regional Cooperation 136,00 147,06 213,44 184,17 252,33 234,65 255,48 286,87 253,48
:Total 615,99 961,42 1.212,69 964,86 1.380,02 1.317,37 1.520,09 1.595,71 1.563,68
Percentage of decisions
by
geographical region in 1997
The geographical distribution of total EDF aid for the ACP countries illustrates the substantial share which is allocated to the African countries (62%). This share reaches 83% if one adds to it the corresponding regional cooperation. However, the other major areas are not neglected and have equally large financial volumes allocated .
.•.•...•••.•..•.•...•..•..•..•.•••.••..••••.••..••.•...•••..
Regional cooperation 22%
Pacific 3%
Africa 61%
...•...••...•..•..•.•.•...•.•...
.
.
.
.
.
.
: Hom of Africa
: 18%
.
.
.
.
Pacific 2% •,
,
..Caribbean I 5%
Percentage including the portion of
the corresponding regional cooperation .
INFOF'INANCE
1997
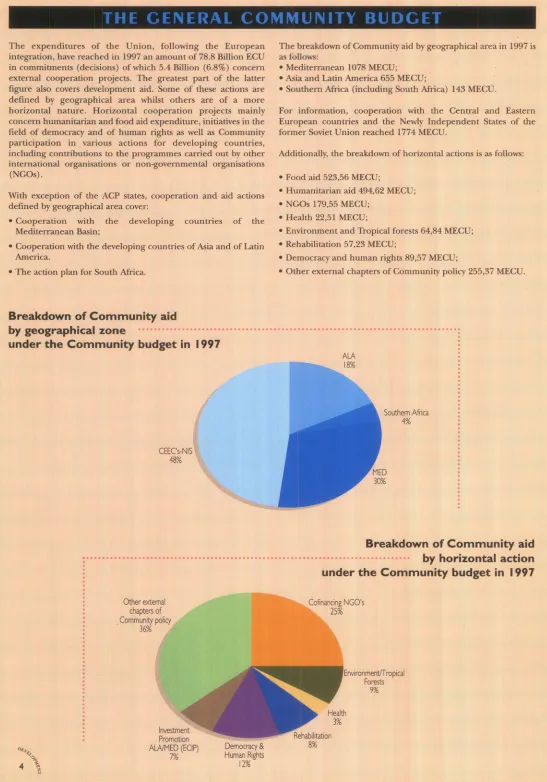
The expenditures of the Union, following the European integration, have reached in 1997 an amount of 78.8 Billion ECU in commitments (decisions) of which 5.4 Billion (6.8%) concern external cooperation projects. The greatest part of the latter figure also covers development aid. Some of these actions are defined by geographical area whilst others are of a more horizontal nature. Horizontal cooperation projects mainly concern humanitarian and food aid expenditure, initiatives in the field of democracy and of human rights as well as Community
participation in various actions for developing countries, including contributions to the programmes carried out by other international organisations or non-governmental organisations (NGOs).
With exception of the ACP states, cooperation and aid actions
defined by geographical area cover:
• Cooperation with the developing countries of the Mediterranean Basin;
• Cooperation with the developing countries of Asia and of Latin America.
• The action plan for South Africa.
Breakdown of Community aid
by geographical zone
under the Community budget in 1997
CEEC's-NIS 48%
The breakdown of Community aid by geographical area in 1997 is as follows: ·
• Mediterranean 1078 MECU;
• Asia and Latin America 655 MECU;
• Southern Africa (including South Africa) 143 MECU.
For information, cooperation with the Central and Eastern European countries and the Newly Independent States of the former Soviet Union reached 1774 MECU.
Additionally, the breakdown of horizontal actions is as follows:
• Food aid 523,56 MECU;
• Humanitarian aid 494,62 MECU;
• NGOs 179,55 MECU;
• Health 22,51 MECU;
• Environment and Tropical forests 64,84 MECU;
• Rehabilitation 57,23 MECU;
• Democracy and human rights 89,57 MECU;
• Other external chapters of Community policy 255,37 MECU.
Southem Africa
4%
Breakdown of Community aid
· · ·
by
horizontal action
Other extemal chapters of
. Community policy
36%
Investment Promotion ALNMED (ECIP)
7%
Democracy& Human Rights
12%
under the Community budget in 1997
[image:4.597.33.580.43.825.2]INFOFlNANCE
1997
ANNUAL BREAKDOWN OF DEVELOPMENT AID BY BUDGET LINE
( 1997 EXERCISE)
Amounts in MECU
Item Description• TOTAL Managed by DG VIII Managed by other DG's
Commitments Payments Commitments Payments Commitments
B7-20 .. Food Aid 523.56 407,69 523,56 407,69
B7-21.. Humanitarian Aid 494,62 669,94 494,62
B7-30 .. Asia I 400,31 252,28 400,31
B7-31 .. Latin America 254,46 148,89 254,46
B7-3200 South Africa 127,79 59,76 127,79 59,76
B7-3210 Southern Africa 14,95 11,23 14,95 11,23
B7-40 .. Mediterranean I 11,94 128,70 11,94
B7-41 MEDA i 981,34 21 1.59 981,34
B7-42 .. Near & Middle East 85,08 63,57 85,08
B7-50 .. CEEC's5 (PHARE programmes) 1.052,38 824,85 1.052,38 B7-52 .. NIS' (TACIS programmes) 475,19 396,13 475,19
B7-53 CEEC's I NIS - Nuclear security 0,00 1,97 0,00
B7-54 .. Republics of ex-Yugoslavia 246,76 42.38 246,76
B7-60 .. Cofinancing NGO's
'
179,65 160,91 170,00 154,30 9,65 B7-61 .. Training & public awareness I Women in develop. 9,35* 9,05 6,60 5,30 2,75B7-620. Environment/tropical forests 64,84 51,47 26,30 20,80 38,54
B7-621. Health 22,51 18,56 16,80 11,60 5,71
B7-61. Population I Demography 5,65" 4,87 0,40 0,30 5,25
B7-6410 Rehabilitation 57,23 43,13 23,90 25,50 33.33
B7-6430 Decentralised cooperation 4,82* 3,55 4,82 3,40 0,00
B7-65 .. Evaluation I Coordination 4.24* 4,17 3,40 4,00 0,84
B7-6610 Anti-personnel mines I 6,80* 5,96 4,10 0,70 2,70
B7-66 .. Other specific actions 15,40" 25,91 15,40
B7-70 .. Democracy & human rights 89,57 59.32 17,00 12,70 72,57
B7-8710 Bananas ACP : 1,49* 27,21 1,49 27,21 0,00
B7-8720 Investment promotion ALAIMED (ECIP) i 50,50 23,27 50,50 B7-8 ... Other external chapters of Communrty policy
i
255,37 310,46 255,37 B7-9 ... Reserve - support for external policies 5,27* 0,03 5,2787 Grand total title B-7 5.441,07 3.966,85 941,11 744,49 4.499,96
• These amounts ane not included in the following pie-charts because of their low values.
5000
4000
3000
2000
1000
Breakdown between DG VIII and other DG's in managing co-operation actions financed under the Commission Budget (in MECU)
Commitments Payments
Breakdown between DG VIII and other DG's in managing co-operation actions financed
under the Commission Budget (in %)
Commitments
DGV!II 17%
Other DG's
81%
Payments
4. Part B of the Commission Budget refer; to operational credits. It is divided into several titles of which Trtle B-7 concerns expend~ures for external actions. 5. Central and Eastern European Countries.
6. Newly independent States of the ex-Soviet Union.
Payments
669,94
252,28
148,89
128,70
211,59 63,57 824,85 396,13 1,97
42.38
6,61 3.75
30,67
6,96 4.57
17,63
0,15
0,17
5,26
25,91
46,62 0,00 23,27 310,46 0,03
3.222,36
DGVIII
INFOF'JNANCE
1997
THE GEOGRAPH
I
CAL AREAS
··· ··· · ···· · ··· ··· ...
.
...
0
The table below compares, by gtographical zone, the evolution of decisions taken by the European Commission under the EDF and the Commission Budget in the sphere of co-operation with developing countries, from 1992 onwards. Also included in this table are the data regarding the countries of Central and Eastem Europe as well as those of the Newly Independent States of the ex-Soviet Union.
Regions
ALA MED
DECISIONS OF COMMUNITY AID BY GEOGRAPHICAL AREA
(period 1992-1997)
1997 1996
I
1995l
1994 1993MECU % MECU % MECU % MECU % MECU %
655 15,9% 670 16,2% 808 18,0% I 524 10,7% 634 15,2%
I 078 26,1% 654 15,8% 491 10,9% 436 8,9% 399 9,6%
CEEONIS/Ex-Yugoslavia I 774 43,0% I 855 44,8% I 678 37,3% I 466 29.9% I 514 36,2%
Sub-total (Budget) 3 507 85,1% 3 179 76,7% 2977 66,2% 2 426 49,4% 2 547 61,0%
ACP-Oa (EDF) 6/6 14,9% 965 23,3% I 520 33,8% 2 480 50,6% I 631 39,0%
TOTAL 4 123 100,0% 4 144 100,0% 4 497 100,0% 4 906 100,0% 4 178 100,0%
Others' I 934 2 326 2 018 I 937 I I 558
GENERAL TOTAL 6 OS7 6 470 6 SIS 6 843
s
736I
1992MECU %
566 12,6% 412 9,1% I 465 32,5%
2 443 54,2%
2 062 45,8%
4 505 100,0%
I 302
s
807.
,.
.
.
.
7. The rtem "Others" includes amongst others food aid. humanitarian aid and aid to NGO's (Non-Governmental Organisations), w;ering all four of the above geograph<cal zones as well as South Africa Indeed, having since 1986 supported the process of democratJC transition 1n South Afnca the European Union committed itself to the
negotiation of a long-tenn framework of cooperation with this country. Deci~ons under the Comm1s~on Budget in favour of South Africa reached 90 MECU in 1993,
The OECD (Organisation for Economic Cooperation and Development) aims to promote policies aiming to carry out the
strongest expansion of the economy and of employment and a
progression of the standard of living in the Member States, to
contribute to a healthy economic expansion in the Member States,
as well as the non-member countries, in the process of
development, as well as to contribute to the expansion of world
trade on a multilateral and non discriminatory basis in accordance
with the international obligations. To make it possible for the
OECD to achieve its objectives, a number of committees of experts
were created. One of those is the Development Assistance
Committee (DAC), of which the members decided to arrive at an
increase in the total volume of the resources placed at the disposal
of the developing countries and to improve effectiveness of these
resources.
The following table shows the evolution of Official Development
Assistance (ODA) extended by the 21 Member States of the DAC,
during the period 1991-1996. An analysis of the figures highlights
the continuing downward trend in overall ODA disbursement
figures by DAC members. Total ODA fell from 58.926 M$ in 1995
to 55.843 M$ in 1996, a decrease of 5.84%, diminishing to pre-1991 levels (total ODA for 1991 was 56.680 M$). Japan accounted for
the lion's share of this decline going from 14.489 M$ in 1995, to
9.349 M$ in 1996, a decrease of 34,85%. Contrary to the general
downward trend since 1994, the overall performance of EU
countries<'> as a whole has been slightly increasing over the past
INFOF'INANCE
1997
years and remained stable in 1996, registering only a marginal
decline of 0.21% compared with 1995.
The EU countries<'> (including the E02
') accounted for 31.292 M$,
or 56.40% of total ODA disbursements in 1996.Japan still remains
on the top of the donors' list with 17.01% of the DAC total,
followed closely by the United States with 16.90%. Germany and
France occupy third and fourth position on the list with their
respective shares o£13.70% and 13.43% of the DAC total. The EO''
accounted for 9.83% of total ODA, and for 17.43% of total EU
countries'12' ODA in 1996.
An analysis of the situation of DAC member countries' ODA in
relation to their GNP reveals that the greatest efforts are still being
undertaken by the countries of Northern Europe. Denmark, with
1.04% (up from 0.96% in 1995), still devotes the largest relative
percentage of its GNP to ODA, followed by Norway, Sweden and
the Netherlands with ODA to GNP ratios of 0.85%, 0.84% and
0.81% respectively. The average of total DAC countries' ODA in
relation to GNP was 0.25% in 1996, a drop of 0.02% from 1995,
with the average for the EU countries<•> coming in at 0.37%, a
decline of 0.01% from the previous year.
ODA DISBURSEMENTS OF DAC COUNTRIES - PERIOD
1991-1996
...•.•...•.•.•...•••.•.•.•
(IN MI
L
LIONS OF US$)
Countries Total ODA Total ODA Total ODA Total ODA Total ODA Total ODA ODA 1996 ODA 1995 ODA 1996
1991 1992 1993 1994 1995 1996 as a% of as a% of as a% of
total DAC countries' GNP countries' GNP
: Australia 1.050 1.011 953 1.091 1.194 1.121 2,02% 0,36% 0,30%
: Austria 543 531 544 655 767 557 1,00% 0,32% 0,24%
: Belgium 831 840 810 727 1.034 913 1,65% 0,38% 0,34%
: Canada 2.604 2.515 2.400 2.250 2.067 1.795 3,24% 0,38% 0,32%
: Denmark 1.200 1.392 1.340 1.446 1.623 1.772 3,19% 0,96% 1,04%
: Finland 930 644 355 290 388 408 0,74% 0.32% 0,34%
: France 7.386 8.162 7.915 8.466 8.443 7.451 13,43% 0,55% 0,48%
; Genmany 6.890 6.963 6.954 6.818 7.524 7.601 13,70% 0,31% 0,33%
: Ireland 72 70 81 109 153 179 0,32% 0,29% 0.31%
: Italy 3.347 4.122 3.043 2.705 1.623 2.416 4,35% 0,14% 0,20%
; japan 10.945 11.119 11.259 13.239 14.489 9.439 17,01% 0,28% 0,20%
: Luxemburg 42 38 50 59 65 82 0,15% 0,36% 0.44%
: Netherlands 2.517 2.742 2.525 2.517 3.226 3.246 5.85% 0,81% 0.81%
: New Zealand 100 97 98 110 123 122 0.22% 0,23% 0,21%
: Norway 1.178 1.226 1.014 1.137 1.244 1.311 2.36% 0,87% 0,85%
: Portugal 213 302 235 303 258 218 0,39% 0,25% 0,21%
; Spain 1.262 1.518 1.304 1.305 1.348 1.251 2.25% 0,23% 0,22%
: Sweden 2.116 2.453 1.769 1.819 1.704 1.999 3,60% 0,77% 0,84%
• Switzerland 863 1.139 793 982 1.084 1.026 1,85% 0,34% 0,34%
United Kingdom 3.184 3.153 2.920 3.197 3.202 3.199 5,77% 0,29% 0,27%
United States 9.407 10.813 10.123 9.927 7.367 9.377 16,90% 0,10% 0,12%
TOTALDAC 56.680 60.850 56.485 59.152 58.926 55.483 100,00% 0,27% 0,25%
EU Countries Ill 30.533 32.930 29.845 30.416 31.358 31.292 56,40% 0,38% 0,37%
of which EC rzJ 3.818 4.461 3.948 4.825 5.501 5.455 9,83%
(I) - Total of the EU Member States, excluding Greece which is not yet a member of the DAC.
(2) -i.e. that portion of EU Member States' total ODA channelled through the Commission (EDF and Community Budget). included above.
'(..~'\"
o"""'
!
7INFOFiNANCE
1997
ODA in
1996
(in millions of US $)
~
z
Ll.l
JapanUnited States
Germany
France
Netherlands
United Kingdom
Italy
Sweden
Canada
Denmark
Norway
Spain
Australia Switzerland Belgium
Austria
Finland
Portugal
Ireland
New Zealand Luxemburg ofwhich EC
--
--
-·
•
-
·
•
-0 I 000 2000 3 000 4 000
As of 1 January 1999, the European Union will enter the last stage
of the Economic and Monetary Union (EMU). On the occasion
of the extraordinary Council of Ministers of May 1998, the
Ministers for Finance will indicate the countries which will participate in the first core of the EMU and they will fix parities
between the national currencies and the Euro, the new single
currency. With regard to the relations with the ACP countries, the first consequence of the introduction of the Euro will be its immediate use as from 1 January 1999 in all the official
documents. According to Council Regulation (EC) No 1103/97
European Commission
Directorate General for Development
Unit "General financial affairs; relations with EIB"
rue de Ia Loi, 200 - B-1 049 Brussels Fax: 32.2.296.98.42
~
D.
0
...I
Ll.l
>
Ll.l
c
5 000 6 000 7 000 8 000 9 000 10 000
of 17 June 1997, the principle to be followed is that of perfect
continuity between the ECU and the Euro, according to an
exchange rate ratio of1:1. Consequently, all the references in Ecu
of the Lome Convention, will become references in Euro.
Similarly, EDF contributions and bank accounts in Ecu will have
their denomination transformed into Euro. During 1998, the
Commission will launch an information campaign on the EMU and the Euro to better explain to its ACP partners the scope and
the consequences of the event.
y
z
L.LJA great deal of additional information on the European Union is available on the Internet. It can be accessed through the Europa server (http:/ /europa.eu.int).
6
0Luxembourg: Office for Official Publications of the European Communities, 1 998 ECSC-EC-EAEC-Brussels - Luxembourg, 1998