This is a repository copy of Some Aspects of the Mechanism of Formation of Smoke from the Combustion of Wood.
White Rose Research Online URL for this paper: http://eprints.whiterose.ac.uk/110992/
Version: Accepted Version
Article:
Atiku, FA, Lea-Langton, AR, Bartle, KD et al. (2 more authors) (2017) Some Aspects of the Mechanism of Formation of Smoke from the Combustion of Wood. Energy and Fuels, 31 (2). ISSN 0887-0624
https://doi.org/10.1021/acs.energyfuels.6b02639
© 2017, American Chemical Society. This document is the unedited author's version of a Submitted Work that was subsequently accepted for publication in Energy and Fuels, copyright © American Chemical Society after peer review. To access the final edited and published work, see http://doi.org/10.1021/acs.energyfuels.6b02639.
eprints@whiterose.ac.uk
Reuse
Unless indicated otherwise, fulltext items are protected by copyright with all rights reserved. The copyright exception in section 29 of the Copyright, Designs and Patents Act 1988 allows the making of a single copy solely for the purpose of non-commercial research or private study within the limits of fair dealing. The publisher or other rights-holder may allow further reproduction and re-use of this version - refer to the White Rose Research Online record for this item. Where records identify the publisher as the copyright holder, users can verify any specific terms of use on the publisher’s website.
Takedown
If you consider content in White Rose Research Online to be in breach of UK law, please notify us by
Some Aspects of the Mechanism of Formation of Smoke from the Combustion of Wood
F. A. Atiku1, A.R. Lea-Langton2, K.D. Bartle1, J.M. Jones1, A. Williams1,
I. Burns3 and G. Humphries3.
1Chemical and Process Engineering, University of Leeds, Leeds LS2 9JT, UK
2Department of Mechanical, Aero and Civil Engineering, Manchester University, Manchester
M13 9PL, UK.
3 Chemical and Process Engineering, University of Strathclyde, G1 1XQ UK
Abstract
This paper is concerned with an investigation of the formation of soot from the combustion of
some of the primary pyrolysis products formed during pine wood combustion. Comparisons
are made between the combustion products of model compounds, furfural for cellulose,
eugenol and anisole to represent lignin (and n-decane for comparison) and with the smoke
emissions from the previously studied combustion of pine wood. These compounds were
burned in a diffusion flame burner and the appearance and composition of the resulting
particulate and the adsorbed polynuclear aromatic hydrocarbon (PAH) precursors were
studied by TEM, mass spectrometry and Py-GC-MS. The reactions leading to soot formation
were modelled. It was concluded that wood soot formation proceeded via pyrolytic
breakdown followed by a mechanism based on HACA (H-abstraction-C2H2-addition)
reactions with the participation of cyclopentadienyl intermediates, while eugenol soot
originated predominantly through the CPDyl route. The formation of furfural soot is mainly
via HACA.
1. INTRODUCTION
The combustion of wood is widely used as a major source of heat and power covering a
range of thermal capacities from domestic appliances to large scale generation plants, the
attraction being in that they use a renewable energy source which is approximately carbon
dioxide neutral.1 The utilisation of all fuels including biomass is subject to increasingly severe
environmental legislation in terms of toxic gaseous pollutants and particulates.2 In particular
the formation of smoke arising mainly from incomplete combustion in small scale domestic
units presents major environmental problems both from being an health hazard3 and as a
major contributor to climate change.4,5 The emission of carbonaceous particles is an
important factor in climate models.4 Two major light-absorbing components of these particles
are recognised5: black carbon (BC) which absorbs across the solar spectrum; and
light-absorbing organic carbon (OC, or BrC - brown carbon, coated on the BC particles) which
absorbs at short wavelengths. Information about the chemical nature and origin of these
species is required if their absorptive and hence warming effects are to be understood.
The general mechanism of wood combustion and the concomitant generation of
environmentally unfriendly emissions have been extensively studied for a number of
years.2,6,7 The cellulose and lignin components can largely be considered to react separately.8
The cellulose decomposes readily at high temperatures to CO and H2 together with some
small organic molecules; the lignin element decomposes to give much more complex mainly
phenolic aromatic products. We have proposed that the cellulose products can largely form
smoke largely via the H-abstraction-C2H2-addition, termed the HACA9 route, and the lignin
Both hard and soft woods give similar devolatilisation products although the
distribution of the products is different, this resulting from the differences in the lignin
content. GC-MS analysis shows that the principal initial volatile decomposition products of
pine-a soft wood- include carbohydrate-derived material such as levoglucosan and furans,11,12
and at higher temperatures the guaiacols and syringols from the lignin. In flames these
decompose and form smaller but more thermally stable cyclic oxygenates and polycyclic
aromatic compounds become significant species.6,11,13 Some of the dominant primary
products are furfuryl alcohol, furfural, and levoglucosan from the cellulose, and eugenol,
isoeugenol, vanillin and guaiacols from the lignin. Overall the products can be estimated
using a computer model such as FG-Biomass.2,14
Furfural (furan-2-carbaldehyde) has been taken to be a typical product associated with
cellulose pyrolysis and eugenol (2-methoxy-4-allylphenol or 4-allylguaiacol) to be associated
with lignin. The structures and terminology of the major species used in this paper are given
in Table 1 in the Supporting Information. Previous studies have been made by us of the
formation of smoke and PAH arising from the combustion of these compounds in diffusion
flames using aerosol time of flight mass spectrometry (ATOFMS).13 There is considerable
interest in the significance of these products from the thermal decomposition of biomass not
only because of the importance of these compounds in combustion but for the synthesis of
chemical products; recent detailed studies have been made for cellulose,15 lignin,16 furfural,17
anisole18 and eugenol.19 In the present study we have extended our earlier work13,20,21 on the
2. EXPERIMENTAL SECTION
The liquid model fuels furfural, anisole and eugenol were burned as diffusion flames as
well as n-decane which was included for comparison purposes as a typical hydrocarbon fuel.
All fuels were supplied by Sigma-Aldrich, UK and were> 99% pure. The practical difficulty
with studying combustion of high molecular weight fuels such as these is that it is not
possible to vaporise them to produce gaseous premixed or diffusion flames because they
decompose. The use of a wick burner overcomes this problem and this has been previously
used by us13,21 but there are problems with repeatability and the inability to produce precision
cylindrically symmetrical flames. We have attempted to reduce these errors by using a
constant wick size and a uniform surrounding air flow; for all experiments a wick diameter of
2 mm and height of 7 mm was used. However, other refinements are possible and this issue
has been addressed by others.22 The other option of burning these fuels on a porous ceramic
substrate such as a sphere is also not possible because of carbon deposition on the ceramic
surface.23
The flames were photographed either directly or through a 430 nm optical filter to give an
images of the CH* chemiluninescence,24 which is a marker of the main reaction zone. The
mass burning rates for the liquid fuels were determined gravimetrically, that is, by measuring
the mass loss over a known time interval. Measurements of the Smoke Point were made using
the ASTM D1322 Smoke Point Test.
Samples of pine wood were burned in an analogous way using small vertical strips of
wt%; H 6.1 wt%, N 0.2 wt%; volatile matter 86.2% wt and ash 0.4 wt%. The pine consisted
of 50% cellulose, 20% lignin and 6 % moisture, the remainder being hemicellulose and ash.
Laser induced incandescence (LII) measurements25,26 were made using a pulsed
Nd:YAG laser (Surelite Continuum) emitting at 1064 nm. Excitation was undertaken using a
beam with 1-mm diameter and a top-hat spatial profile. The time-resolved LII signal was
imaged onto a 1-mm diameter pin-hole and detected using a photomultiplier tube
(Hamamatsu R636-10) with a narrow band-pass filter centred at 450 nm. Averages of 64
signal decays were recorded. Measurements were made 10 mm above the top of the wick at a
range of radial locations. These measurements were performed in flames of n-decane,
furfural, anisole and eugenol. Soot volume fractions were quantified by comparing peak
signal levels to measurements when the wick burner was replaced with a laminar flat flame
of premixed ethene and air, in which the soot volume fraction was determined by extinction
measurements. Temporal decay profiles allowed particle size to be estimated.25,26
The formation of soot was determined: (i) by measuring the total soot emitted by
collecting and filtering all the combustion products; (ii) by deposition on a cold glass slide as
previously described; 27 and (iii) by withdrawing soot samples directly from within the flame
zone captured on electron microscope grids as used by Saffaripour et al. 28 and Kholghy et
al.29 using a 0.2s residence time. The soot samples were analysed directly by Py-GC-MS as
previously described;10 2mg samples were heated to 400oC with a ramp rate of 20oC / ms and
with a hold time of 20 s. Particle sizes of soot from the flame were determined by a Fast
Particle Analyser DMS 500 (Cambustion Ltd) with samples being removed 5 cm above the
Computations of the opposed diffusion flames were made using the OPPDIF program
contained within ANSYS Chemkin-Pro30 computer code suite and the POLIMI 2012
chemical mechanism,31 although with some additional reactions to the mechanism which are
described later. The Opposed-flow Diffusion Flame simulator, OPPDIF, is a steady-state
solution which is computed for a diffusion flame between two opposing gas flows, one for the
fuel and the other for the oxidant (air). The opposed two-dimensional flow is reduced
mathematically to a one dimension simplification in which the fluid properties are functions
of the distance only. The one-dimensional model then predicts the species, temperature, and
velocity profiles in the flow between the sources. The model requires input data for reaction
kinetics for all the reactions, along with thermodynamic data for all the species in a Chemkin
format with fourteen polynomial fitting coefficients to enable specific heats and enthalpies to
be calculated up to the maximum flame temperature. Transport data are also required in a
format to enable diffusion coefficients and thermal conductivities to be calculated for all
species over the temperature range.
3. RESULTS AND DISCUSSION
3.1Flame Studies
The model fuels studied were furfural, anisole, and eugenol and a conventional
hydrocarbon fuel, namely n-decane. Their mass burning rates were determined to an
accuracy of ±5% and are given in Table 1 together with the values for the Smoke Point
Index, smoke emission factors (mass smoke produced/mass fuel burned, the errors being
±10%) , deposition rates and the fuel C/H ratios. The values of the Smoke Points are given in
descending order and include results for a 50/50 mixture of furfural and eugenol. It is clear
emission factor. The deposition rates are a function of the soot volume fraction, the particle
density and the thermophoretic drift, which in turn is a function of the temperature gradient
at the boundary layer.28 Because of the differences in burning rates they are presented here in
relative terms of mass soot/mass fuel burned /s for the same surface area in all experiments.
The errors here are ± 20%. The results follow the Smoke Point data but the C/H ratios and
the emission factors do not; in both cases furfural behaves in an anomalous way, presumably
because of its oxygen content.
Direct photographs were taken of all the flames and two typical flames, namely from
furfural and anisole, are shown in Figures 1(a) and (b). Eugenol produced a flame similar
to anisole but it had a lower mass burning rate and a smaller flame and clearly produced
more soot especially concentrated along the central axis of the burned gases. The direct
flame photographs were scanned by a densitometer and profiles of the visible soot
emission obtained. By this method the order of soot propensity at 2 cm above the wick for
all the flames is n-decane< furfural = anisole < eugenol.
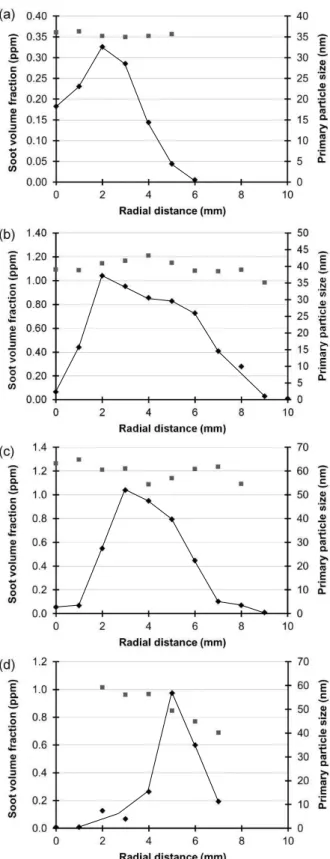
The soot forming zone in the flames were examined using LII. The soot volume
fractions and primary particle sizes determined are shown in Figure 2 for the n-decane,
anisole, furfural and eugenol flames. Each of the flames exhibits a peak soot volume
fraction at a specific distance from the centreline, and these are consistent with the flame
photographs. The anisole and furfural flames have a peak soot volume fraction of about 1
ppm, although the width of the soot-containing region varies between these flames. The
n-decane flame has a peak soot volume fraction that is about three times lower than that of
the other flames.The data obtained for the eugenol flames are also given in Figure 2 but
there were measurement problems because of flame flickering resulting from soot
deposition on the wick. High and intermittent LII signals were obtained when the thin soot
soot volume fraction in the beam path for the eugenol flame also gave rise to an audible
photoacoustic signal, consistent with a much higher soot volume fraction than in the other
flames.
The results given in Figure 2 for the soot particle sizes in the measurement volume
show that all the smallest particles are in the n-decane flame (about 35 nm diameter) and
that there is little change in the size across the flame radius. Both furfural and anisole
flames show similar behaviour with particles with diameters of about 35 and 60 nm
respectively. The eugenol flame behaves slightly differently; it has larger particles (60
nm) in the core decreasing to about 40 nm on the outside which is believed to result from
the fact that the core of the flame had visibly higher soot levels
3.2Post-flame studies of soot formation
The diameters of the soot particles, Dp, emitted from the n-decane, furfural and anisole
flames which were sampled by a probe at 5 cm above the flame tip were determined using
the DMS instrument. The results for all the flames followed a similar pattern and this is
demonstrated for the anisole flame shown in Figure 3. It shows an initial group of
particles of about 20 nm diameter, a second smaller group at about 60 nm diameter and a
third major group with sizes up to 400nm but peaking at 200nm. The first two are
consistent with the LII measurements whilst the latter group consists of chains of particles
of the type commonly seen in combustion smoke and which were observed here by
electron microscopy (but not shown here). It is interesting that the main peak starts from
about 50nm diameter. Particles of this size are identified in all the previous LII
flame there is rapid agglomeration of the 50nm particles to form chain structures and
eventually fluffy soot. The DMS of the eugenol soot has previously been shown to be
slightly different32 with extensive agglomeration of particle with sizes above 1000 nm and
this is consistent with the early stages of the formation of the cotton-like structures
described earlier.
Soot samples were obtained by deposition on a plate placed 5cm above the flame
using the method previously used before for ethene flames.27 It was clear that there were
two significantly different classes of deposits. The furfural diffusion flame gave a dense
soot deposit similar to that found previously from ethene flames.27 However, anisole and
especially the eugenol flames, produced greater yields of a cotton-like soot aggregates
typical of soot from benzene pyrolysis or flames.33 Samples were examined by TEM and
the first group was found to consist of spherical samples with about 20-40 nm diameter.
The second group which overall was cotton-like actually consisted of clusters of chains of
spherical particles with diameters of individual soot particles of about 40-60 nm. These
clusters are fragile and are easily fragmented.
Soot particles were withdrawn by the electron microscope grid sampling probe from
inside the flame as well as from above the flame. The samples were taken 10 mm above
the combustion zone (because of the geometrical complexity of these flames) and
examined by transmission electron microscopy (TEM). Here the particle diameters were
about 10-15 nm in diameter for all the flames, increasing in size with reaction time to the
exit particle size of 40-60 nm. Many of the particles are in the form of chains and thus had
overall larger particle sizes, as shown in Figure 4 (a) and (b). Particles of soot from both
microscopy. Examples of images of in-flame soot particles are shown in Figures 4 (a) and
(b) respectively. The furfural has discernible lamellae which form onion-like concentric
rings whilst the eugenol soot has slightly more disordered regions of lamellae and slightly
larger constituent units. Measurements of lattice spacing show that the difference is small:
furfural: 0.37± 0.05 and eugenol 0.45± 0.05. Post-flame the furfural and eugenol samples
look very similar with both ordered regions and disordered regions in each set.
We have previously examined post-flame samples of n-decane and the pine wood
soot; n-decane soot is similar to furfural soot but more ordered, whilst the wood soot is
largely amorphous with only a few pockets of graphitic structure.
Soot samples from pine wood and eugenol which were deposited on a cooled surface
were analysed by Py-GC-MS and the results are shown in Figures 5 (a) and (b)
respectively. These results give an insight into the species involved in the formation of the
soot in addition to condensed PAH aerosol particles, both of which have environmental
implications.
The results may be interpreted as follows. In the case of pine-combustion generated
soot the results are similar to those previously published,10 but in that instance the soot
was pyrolysed at a higher temperature of 1000oC and consequently some secondary
pyrolysis products were also released. In this case the products deposited on the cooled
surface showed the presence of the more stable cellulose decomposition products as well
as those from the decomposition of lignin. The origin of pinewood soot precursors has
been sought10,11 in the reactions of terpenes and from the phenolic constituents of lignin.
contained mainly 2-4 rings (see Figure 5(a)); single-ring aromatics, and higher PAH were
also generated. The potential importance of the CPDyl mechanism in wood combustion
seems clear in providing a starting point for the formation of PAH by the HACA route.9
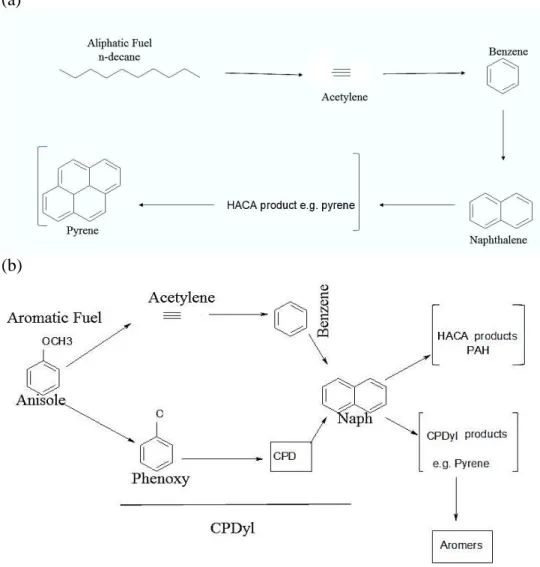
Simplified routes to soot from both aliphatic and aromatic fuels are shown in Figures 6 (a)
and (b) respectively.
The HACA route is operative for both mechanisms, but CPDyl also plays a part for
aromatics since monocyclic aromatics such as anisole, but also more complex phenols
such as eugenol, give rise to a phenoxy radical which by the loss of CO forms CPDyl.
The latter gives rise to indene and naphthalene, and from these hydrocarbons are derived
a number of PAH leading to soot both by HACA9 and by further reaction with CPDyl.
This, like eugenol, produces aromatic -like soot deposits and forms agglomerates. A
major aromatic product from eugenol, the model for the structure of lignin during
pyrolysis at the same temperature,19 is also naphthalene, which is characteristic of the
CPDyl mechanism for soot formation. After early growth from small PAH, the soot
precursors grow further in four different general ways (Figure 6(b)).
The behaviour of eugenol is of particular interest. The desorbed GC-MS results are
shown in Figure 5 (b). It is clear that in these flames there are a considerable number of
unreacted or partially reacted phenolic species which might participate in the soot forming
processes. Of special interest is 2-methoxy-4-methylphenol (4-methylguaiacol), also
identified in the products of bio-oil34 from pyrolysis at a much lower temperature than that
of the wick burner flame thus suggesting early loss of the allyl group of eugenol. These
phenols are expected to be precursors of CPDyl and importantly are components of the
in keeping with primary and secondary pyrolysis processes.8 The presence of naphthalene
in the eugenol soot (Figure 5 b) is consistent with a CPDyl mechanism, while the
identification of higher MW PAH such as phenanthrene is indicative of a HACA route.
ATOFMS spectra of eugenol soot from a wick burner13 are also consistent with a
number of PAH formed by growth from naphthalene (MW 128 Da) through phenanthrene
(178). A triad of peaks at 252, 276 and 300 Da is also prominent. The ATOFMS spectra
also shows a series of peaks at m/z >250 separated by 12 Da indicative of methyl addition
to yield five-membered rings35 and hence curvature in the growing soot.
3.4 Flame Computations-Mechanism of Smoke Formation
The reactions leading to the formation of soot was simulated using an opposed diffusion
flame computation of the combustion of evaporated furfural, anisole or eugenol reacting with
air, with both the air and the evaporated fuel stream preheated to 500K. Computations were
undertaken using the ANSYS Chemkin OPPDIF code30 and the POLIMI 1201 combustion
model.31 This reaction mechanism employed pyrolysis and oxidation reactions occurring
concurrently and involving up to 200 species and several thousand reactions. The model also
calculates the concentrations of the species leading to the inception of soot. The growth of
aromatics was followed from benzene to naphthalene (C10H8), to phenanthrene/anthracene
(C14H10) and to pyrene/isomers (C16H10). The dimerization of pyrene is often associated with
soot inception but in the present reaction mechanism growth is assumed using lumping
reactions leading to the formation of BIN 1 A (C20H16) and BIN 1B (C20H10); these species
species is also included, namelyindene (C9H8) and fluorene (C13H10). The mechanism also
contains a reaction scheme for pyrolysis and oxidation of anisole and was used without
change since it is consistent with recent published work.18
Models for the combustion of both n-decane and anisole are contained within the
POLIMI 1201 program and it also contains the soot forming routes HACA and CPDyl. This
mechanism has been validated and details are given in the references within reference 31.
There are no published models for the initial reactions of the parent fuels furfural and eugenol
and simplified schemes for these initial steps of these species were added to the POLIMI 1201
model. The basic combustion and soot forming schemes are the same as for anisole.
In the case of furfural, a mechanism largely based on recent publications17,36 was
adopted. At lower pyrolysis temperatures it is assumed that furfural undergoes unimolecular
decomposition to furan + CO: C4H3O-CHO (+ M) CO + C4H4O. Sequential decomposition
of furan leads to the production of HC CH, CH2CO, CH3C CH, CO, HCCCH2, and H atoms.
At the higher flame temperatures we have taken:
{C4H3O}-CHO = {C4H3O} + HCO (1)
{C4H3O} = C3H3 + CO (2)
{C4H3O}-CHO +OH = {C4H3O}-CO + H2O (3)
{C4H3O}-CO = {C4H3O} + CO (4)
{C4H3O}-CHO + CH3 = {C4H3O}-CO + CH4 (5)
The structures and nomenclature of the new species involved are given in Table S1.
Information. The rates chosen are based on analogous reactions in the main reaction scheme.
In the case of reaction 4 we have used a second set of reaction rate parameters (4B). The
former is based on a seeming similarity with reaction 1, but it has been pointed out that it is a
radical alpha scission similar to CH3CO. Thus for reaction 4B we have used kinetic
parameters appropriate to the decomposition of CH3CO.
The only information on the mechanism for eugenol pyrolysis is from studies at lower
temperatures.19 The initial step used for eugenol is given below-
2-methoxy-4-allylphenol = {(C6H3)(OH)(OCH3} + C3H5 (6)
That is, eug = eugenyl-1 + C3H5
eugenyl-1 = eugenyl-2 + CO (7)
eugenyl-2 = cyc-C5H5 + CH2O (8)
where the C3H5, cyclic-C5H5, CH2O and CO would further react in the POLIMI 1201
mechanism scheme, but the remaining eugenyl radical presents many reaction route options.
The derivation of eugenyl- 2 from eugenyl-1 requires a phenoxy structure for loss of CO from
eugenyl-1 and hence an isomerization of the initial eugenyl-1 structure to place the unpaired
electron on the oxygen atom. The kinetic data used for equations (6)-(8) are given in the
Supporting Information.
In order to approximate the eugenol flame it was simplified and was considered to
consist of equal amounts of anisole and C3H3 (termedModel 1). This is an approximation
based on the premise that the allyl group breaks off the aromatic ring and is used in Model 1.
occurs. Model 2 is based on reactions 6-8 and essentially the mechanism follows the
formation of eugenyl-1 (C7H7O), then eugenyl-2 (C6H7O), and then to CPDyl, which gives a
major route to soot precursors.
Computations were undertaken using OPPDIF for the combustion of n-decane,
furfural using two sets of rate constants (4A and 4 B), anisole and two models for eugenol.
The computed results give profiles of a large number of species through the flame zone
culminating in an estimate of the point of soot formation inception represented by BIN 1A,
BIN 1B and the dimerization of pyrene. These give an indication of the soot inception region
and the quantity of soot formed; but because of the way it is defined it is therefore lower than
the measured in-flame values given in Figure 2. Values for the maximum concentration of a
number of these key species are given in Table 2. Two examples of the computed profiles are
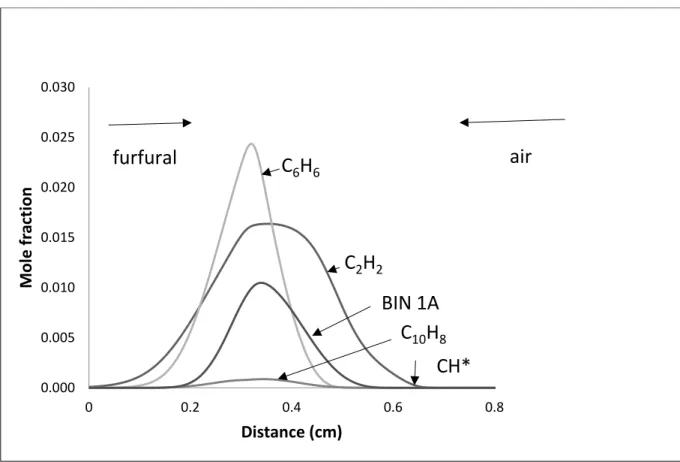
shown: furfural in Figure 7 using reaction 4 and for anisole in Figure 8. In these figures the
fuel vapour approaches the reaction zone from the left hand side and the air from the right
hand side, combustion takes place leading mainly to CO2 and H2O but with reactions leading
to soot formation. The important soot-forming species shown in both figures are ethyne
(acetylene), benzene, naphthalene and BIN 1A.
In the case of the furfural we obtained computed profiles for the two different rate
parameter and the maximum concentrations obtained are shown in Table 2. The furfural run
using the 4B rates gave an extremely wide reaction zone suggesting that the rate is too rapid.
Bond distances were calculated using MOPAC 2012 and it was found that the molecule
{C4H3O}-CO had a bond length of 0.141 nm whilst CH-CO had a bond length of 0.145 nm.
This suggests that the bond dissociation for the former is greater and that the activation
show Figure 7 based on reaction 4 but clearly more information is required about this
reaction, and preferably from a simpler reaction system .
n-Decane has also been studied and was found not to behave very differently from
furfural so this is representative of this class of products from cellulose products: anisole is
typical of the highly sooting polyphenol aromatic species produced by the pyrolysis of lignin.
The results obtained for both models for eugenol are given in Table 2 and listed as
eugenol Model 1, and eugenol: Model 2. Model 1 gave the higher soot output (BIN 1A, BIN
1B). Model 2 gave a soot precursor output (BIN 1A, BIN 1B) which is much lower than the
Model 1 output, and indeed lower than that for furfural. The limitation with Model 2 is that it
is entirely a pyrolysis model and does not include radical or atom attack on the parent
molecule, nor include O-CH3 fission because little is known about the reaction paths of the
products. It was also suggested that we ran the model with an extra reaction, reaction 9 in
Table S1, but this had no effect on the BIN 1A and BIN 1B output. Clearly additional reaction
pathways are required as well as the examination of the kinetic parameters chosen.
These results show that in the flame zone n-decane and furfural which are cellulose
products follow the HACA route. Eugenol is more aromatic and follows a different route and
other species such as CPDyl play a prominent role. It also shows a correlation between the
experimental emission factors in Table 1 and the values of BIN 1A, BIN 1B and pyrene in
Table 2. These have been used as indicators of the extent of soot formation.
The CH* chemiluminescent emission is considered to be the result of the C2H + O
reaction and an indicator of the position of the reaction zone, and the relative emission
positions of the maximum relative computed CH* chemiluminsecence are shown in Figures 7
(a) and (b) and these are on the lean side of the combustion zones shown in Figure1. The
relative intensities of the CH* emission relative to n-decane are: furfural 1.6, and anisole 0.5.
These are consistent with the observations of the flames in Figure.1. The soot concentrations
observed both visually or by LII are also consistent with the computed figures.
3.5 Soot Formation
The profiles of the higher PAH in soot resulting from wood combustion (such as pine)
are consistent with the HACA route of PAH growth.9,35,37 to dense planar ‘protographite,’
molecules. However, pentagonal curved areas in this network (protofullerenes) can arise from
five-membered rings;38 these are bowl-shaped hydrocarbon structures which can lead to
curvature of the sheet of carbon atoms and eventually to the curved or ‘onion-ring’
morphology for the soot particle which can be seen by electron micrography, for example in
Figure 2 for furfural and eugenol flame soots. These PAH structures can them stack and grow
to soot particles39-41 and chains and eventually graphitise further up in the flame.22,29
A route to (pine )wood soot involving 'curved' protofullerenes is consistent with major
contributions of a range of five-membered ring PAH:4H-cyclopenta[def]phenanthrene,
acephenanthrylene, acephenanthrylene, fluoranthene and benzo[ghi]fluoranthrene; the
concentrations of these exceeded those of identified six-membered ring compounds from
which protographenes are derived. A number of studies have shown how five-membered ring
PAH such as cyclopentapyrenes can isomerise to the bowl-shaped and highly reactive
corannulene (C20)-MW 250, a species we have previously attributed in the direct introduction
formed by dehydrocyclisation during pyrolysis of appropriate planar PAH containing
five-membered rings, while the presence of hydrocarbons with a five-five-membered ring in the
combustion of methane brought about a significant increase in sooting tendency.38
Models have been developed of the growth of these species into particle nuclei and
beyond by growth through surface reactions and finally agglomeration. In order to follow
these processes, various assumption are made and involve lumped species defined just by
number of carbon atoms or molecular units with the aim of providing the mass and size
distribution of total particulates. At the small molecular level it is possible to model the
formation of the precursors (as in section 3.4) but the next step is more complex. Violi et al.39
have used a detailed molecular model but only for the first stages leading to soot inception. In
particular this uses the assumption that aromatic radicals add to the double bond of
five-membered ring PAH. The typical size of the nucleus was first postulated by Wang et al.42 to
be that of circumcoronene, C96H24; this molecule contains 2% hydrogen, has dimensions 2 nm
x 2 nm, and is consistent with the electron microscope images observed here (Figure 4), as
well as by others.
Sirignano et al. 40 and Saggese et al.41 have used growth models based on the
following types of reaction:
Ri + H = Ri + H2 (9)
Ri + Ri = Ri-Ri (10)
The products reach a size of about C96 but the structure may not be a uniform regular
PAH. The growth picture is complicated by the fact that PAH species may just condense on
nearly pure soot, which agglomerates to form chains (see Figures 2-4) and droplets of mainly
PAH.5 This would explain the behaviour of soot when deposited on cool surfaces as opposed
to the behaviour on hot surfaces. It follows that linking the soot forming mechanism
quantitatively both to BC and to OC is complex and will be discussed elsewhere.
4. Conclusions
Representative species of wood pyrolysis products are furfural for cellulose and
anisole and eugenol for lignin. Smoke emissions from their diffusion flames are initially the
same and the initial soot particles grow to larger spherical particles. SEM measurements
show that the initial particle sizes are approximately 30 nm and the particles agglomerate or
aggregate to form chains. There is a significant difference between the final soot product
from furfural and eugenol because of the aromatic nature and concentration of soot particles.
This aromatic nature is not seen in biomass soot.
Furfural tends to follow the HACA route because of initial decomposition to suitable
species that can follow this path. Eugenol undergoes side-chain cracking, followed by
conventional phenol decomposition reactions, and also decomposition and reaction via
cyclopentadiene.
Comparison has been made to pinewood soot which contain both organic carbon and
black carbon. The decomposition products suggest an important PAH route is via
cyclopentadiene, which is derived after cracking of lignin monomer fragments.
ACKNOWLEDGEMENTS
We wish to acknowledge financial support from the EPSRC Supergen Bioenergy Hub
Kebbi State University for Science and Technology, Aliero, Nigeria. We also thank Professor
A. S. Tomlin for the use of the DMS equipment, Mr P. Mason for assistance with the optical
experiments and Dr N. Hodran for assistance with the electron microscope measurements. We
are indebted to the Reviewers for some useful comments.
REFERENCES
1. International Energy Agency. Energy and Climate Change. World Energy Outlook Special
Report, IEA Paris 2015. www.iea.org
2.Williams, A.; Jones, J.M.; Ma, L.; Pourkashanian, M. Pollutants from the combustion of
solid biomass fuels. Prog. Energy Combust. Sc. 2012, 38, 113-137.
3. Bølling, A.K.; Pagels, J. K.; Yttri, E.; Barregard, L.; Sallsten, G. P.; Schwarze, P.E.;
Boman, C. Health effects of residential wood smoke particles: the importance of combustion
conditions and physicochemical particle properties. Part. Fibre Toxicol. 2009, 6: 29.
4. Bond, T.C.; Doherty,S.J.; Fahey,D.W.; Forster, P.; Berntsen, T. et al. Bounding the role of
black carbon in the climate system. A scientific assessment. J.Geophys. Res.: Atmos. 2013,
118, 5380-5552.
5. Dickau, M.; Olfert, J.; Stettler, M.E.J.; Boies, A.; Momenimovahed, A.; Thomson, K.;
Smallwood, G.; Johnson, M. Methodology for quantifying the volatile mixing state of an
aerosol. Aerosol Sci. Tech. 2016, 50(8), 759-772.
6. Orasche, J.; Seidel, T.; Hartmann, H.; Schnelle-Kreis, J.; Chow, J.C.; Ruppert, H.;
Zimmermann, R. Comparison of emissions from wood combustion. Part 1: Emission factors
particulate matter and polycyclic aromatic hydrocarbon (PAH)-related toxicological potential
of particle-bound organic species, Energy Fuels 2012, 26 (10), 6695−6704.
7. Eriksson, A.C.; Nordin, E.Z.; Nystr̈m, R.; Pettersson, E.; Swietlicki, E.; Bergvall, C.;
Westerholm, R.; Boman, C.; Pagels, J.H. Particulate PAH emissions from residential biomass
combustion: Time-resolved analysis with aerosol mass spectrometry. Environ. Sci. Technol.
2014, 48, 7143−7150.
8. Branca, C., Di Blassi, C. A unified mechanism of the combustion reactions of
lignocellulosic fuels. Thermochem. Acta 2013, 565, 58-64.
9. Frenklach, M.; Wang, H. Detailed mechanism and modeling of soot particle formation, in:
Bockhorn, H. (Ed.), Soot Formation in Combustion: Mechanisms and Models,
Springer-Verlag, Berlin, 1994, pp.165-192.
10. Fitzpatrick, E.M., Jones, J.M., Pourkashanian, M., Ross, A.B., Williams, A., Bartle, K.D.
Mechanistic aspects of soot formation from the combustion of pine wood. Energy Fuels 2008,
22 (6), 3771–3778.
11. Fitzpatrick, E.M.; Bartle, K.D.; Kubachi,M.I.; Jones, J.M.; Pourkashanian, M.; Ross,
A.B.; Williams, A.; Kubica, K. The mechanism of the formation of soot and other pollutants
during the co-firing of coal and pine wood in a fixed bed combustor. Fuel 2009, 88, 2409–
2417.
12. Phillips, D.; Mitchell, E.J.S.; Lea-Langton, A.R.; Parmar, K.R.; Jones, J.M.; Williams A.
The use of conservation biomass feedstocks as potential bioenergy resources in the United
13. Wilson, J.M.; Baeza-Romero, M.T.; Jones, J.M.; Pourkashanian, M.; Williams, A.;
Lea-Langton, A.R.; Ross, A.B.; Bartle, K.D. Soot formation from the combustion of biomass
pyrolysis products and a hydrocarbon fuel, n-decane: an ATOFMS study. Energy Fuels 2013,
27 (3), 1668−1678.
14. FG-Biomass. www.afrinc.com.
15. Wang, S.; Guo, X.; Liang, T.; Zhou Y.; Luo, Z. Mechanism research on cellulose
pyrolysis by Py-GC/MS and subsequent density functional theory studies. Bioresource
Technol. 2012, 104, 722-728.
16. Zhang, T.; Li, X.; Qiao, X.; Zheng, M.; Guo, L.; Song,W.; Lin W. Initial mechanisms for
an overall behavior of lignin pyrolysis through large-scale ReaxFF molecular dynamics
simulations. Energy Fuels 2016, 30 (4), 3140–3150.
17.Vasiliou A.K.; Kim J.H.; Ormond, T.K.; Piech, K.M.; Urness, K.N.; Scheer, A.M.;
Robichaud, D.J.; Mukarakate, C.; Nimlos, M.R.; Daily, J.W.; Guan, Q; Carstensen, H.H.;
Ellison, G.B. Biomass pyrolysis: thermal decomposition mechanisms of furfural and
benzaldehyde. J. Chem. Phys. 2013,139 (10):104310.
18. Nowakowska, M.; Herbinet, O.; Dufour, A.; Glaude, P-A. Detailed kinetic study of
anisole pyrolysis and oxidation to understand tar formation during biomass combustion and
gasification. Combust. Flame 2014, 161, 1474–1488.
19. Ledesma, E. B.; Campos, C.; Cranmer, D. J.; Foytik, B. L.; Ton, M. N.; Dixon, E. A.;
Chirino, C.; Batamo, S.; Roy, P. Vapor-phase cracking of eugenol: distribution of tar products
20. Ross, A. B; Junyapoon, S.; Jones J. M.; Williams, A.; Bartle, K.D. A study of different
soots using pyrolysis–GC–MS and comparison with solvent extractable material. J. Anal.
Appl. Pyrol. 2005, 73, 145-152.
21.Baeza-Romero, M.T.; Wilson, JM.; Fitzpatrick, E.M.; Jones, J.M.; Williams, A. In situ
study of soot from the combustion of a biomass pyrolysis intermediate; eugenol and n-decane
using aerosol time of flight mass spectrometry. Energy Fuels 2010, 24 (1), 439-445.
22. Botero, M.L.; Chen,D.; Gonzalez-Calera, S.; Jefferson, D.; Kraft, M. HRTEM evaluation
of soot particles produced by the non-premixed combustion of liquid fuels. Carbon 2016, 96,
459-473.
23.Bartle, K.D.; Fitzpatrick, E.M.; Jones, J.M.; Kubacki, M.L.; Plant, R.; Pourkashanian, M.;
Ross, A.B.; Williams, A. The combustion of droplets of liquid fuels and biomass particles.
Fuel 2011, 90, 1113–1119.
24. Karnani, S.; Dunn-Rankin, D. Visualizing CH* chemiluminescence in sooting flames,
Combust. Flame 2013, 160, 2275–2278.
25. Schulz, C.; Kock, B.F.; Hofmann, M.; Michelsen, H.; Will, S.; Bougie, B.; Suntz, R.;
Smallwood, G. Laser-induced incandescence: recent trends and current questions. Appl. Phys.
B, 2006, 83, 333-354.
26. Bladh, H.; Johnsson, J.; Olofsson, N-E.; Bohlin, A.; Bengtsson, P-E. Optical soot
characterisation using two-color laser-induced incandescence (2C-LII) in the soot growth
27. Smedley, J.M.; Williams, A.; Mutshimwong, A. Soot deposition from ethylene / air
flames and the role of aromatic intermediates, in: H. Bockhorn (Ed.), Soot Formation in
Combustion: Mechanisms and Models. Springer –Verlag 1994 pp 403-416.
28. Saffaripour, M.; Veshkini, A.; Kholghy, M.; Thomson, M.J. Experimental investigation
and detailed modeling of soot aggregate formation and size distribution in laminar coflow
diffusion flames of Jet A-1, a synthetic kerosene, and n-decane. Combust. Flame 2014, 161,
848–863.
29. Kholghy, M.R.; Veshkini, A.; Thomson, M.J. The core-shell internal nanostructure of soot
- A criterion to model soot maturity. Carbon 2016, 100, 508-536.
30. ANSYS Chemkin Pro. www. ansys.com
31. Ranzi, E.; Faravelli, T. POLIMI 1201, (2016). www.
creckmodeling.chem.polimi.it/kinetic.html.
32. Lea-Langton, A.R.; Baeza-Romero, M.T.; Boman, G.V.; Brooks, B.; Wilson, A.J.M.;
Atiku, F.A.; Bartle, K.D.; Jones, J.M.; Williams, A. A study of smoke formation from wood
combustion. Fuel Proc. Technol. 2015, 137, 327–332
33. Frusteri, L.; Cannilla, C.; Barbera, K.; Perathoner, S.; Centi, G.; Frusteri, F. Carbon
growth evidences as a result of benzene pyrolysis. Carbon 2013, 59, 296 –307.
34. Stas, M.; Kubacka, D.; Chudoba, J.; Pospisil, M. Overview of analytical methods used for
chemical characterization of pyrolysis bio-oil. Energy Fuels 2014, 28, 385-402.
35. Shukla, B.; Koshi, M. Comparative study on the growth mechanisms of PAHs. Combust.
36. Tian, Z.; Yuan, T.; Fournet, R.; Glaude, P-A.; Sirjean, B.; Battin-Leclerc, F.; Zhang, K.;
Qei, F. An experimental and kinetic investigation of premixed furan/oxygen/argon flames.
Combust. Flame 2011, 158, 756-773.
37. Smedley, J.M.; Williams, A.; Bartle, K.D. A mechanism for the formation of soot
particles and soot deposits. Combust. Flame 1992, 91, 71-82.
38. McEnally, C.S.; Pfefferle, L.D. An experimental study in non-premixed flames of
hydrocarbon growth processes that involve five-membered carbon rings. Combust. Sci.
Technol. 1998, 131, 323-344.
39. Violi, A.; Sarofim, A.F.; Voth, G.A. Kinetic Monte Carlo-molecular dynamics approach
to model soot inception. Combust. Sci. Technol. 2004, 176 (5-6), 991-1005.
40. Sirignano, M.; Kent, J.; D’Anna, A. Modeling formation and oxidation of soot in
nonpremixed flames. Energy Fuels 2013, 27(4), 2303-2315.
41. Saggese, C.; Ferrario, S.; Camacho, J.; Cuoci, A.; Frassoldati, A.; Ranzi, E.; Wang, H.;
Faravelli, T. Kinetic modeling of particle size distribution of soot in a premixed
burner-stabilized stagnation ethylene flame. Combust Flame 2015, 162 (9), 3356-3369.
42. Wang, T.S.; Matula, R.A.; Farmer, R.C. Combustion kinetics of soot formation from
Tables
Table 1 Combustion properties of the fuels
Fuel Bp
oC
Smoke Point, mm
Mass burning rate, mg/s
Emission factor
mg soot/g fuel
Relative deposition rate of soot mg/g fuel/s
C/H ratio
n-decane 174.1 27.0 5.4 0.18 0.04 0.45
furfural 161.7 16.0 4.8 27.0 0.02 1.25
anisole 154 11.0 4.7 17.1 0.08 0.88
eugenol 254 6.5 1.4 132.2 0.11 0.83
furfural/eugenol
50/50wt%
12.0 3.1 52.2 Not
Table 2. Maximum concentrations for selected species from computed opposed diffusion flames (mol fraction)
fuel C2H2
(10-2)
cyclo-C5H5
CPDyl
(10-3)
cyclo-C5H6
CPD
(10-4)
C6H5O
phenoxy
(10-5)
C9H8
indene
(10-4)
C10H8,
naphthalene
(10-3)
C16H10
pyrene
(10-4)
BIN 1A
/BIN 1B
(10-4)
n-decane 2.3 0.07 4.5 0.004 0.8 0.3 1.0 0.2/1.1
furfural:
run 4
1.6 0.05 0.28 0.003 8.9 0.9 14.4 104/160
furfural: run 4 B
1.6 0.05 43 0.004 4.1 29 22.0 27/55
anisole 1.0 0.58 25.5 10.8 3.5 5.6 28.0 35/104
eugenol: model 1
66 1.6 20.4 3.2 44.4 6.0 30.8 106/144
eugenol: model 2
Figure Legends
Figure 1. Upper figures: direct photographs of (a) furfural (b) anisole flames on a wick
burner; and lower figures: CH* emission of the same flames through a 430 nm filter.
Figure 2. Soot volume fraction (diamonds) and primary particle size (circles) measured by
LII as a function of radial position in the flame, (a) n-decane; (b) anisole; (c) furfural; (d)
eugenol.
Figure 3. Graph of relative particle numbers (dN/dlogDp/cc) against particle diameter
Dp(nm) at 5cm above the flame tip (a) furfural and (b) anisole.
Figure 4. TEM images of soot particles deposited on an electron microscope grid sampled
just after the reaction zone flame (a) furfural, (b) eugenol, both high resolution.
Figure 5.(a) GC-MS plot (ion count against time) of adsorbed hydrocarbons pyrolysed at
400oC : (a) pine wood flame soot: selected peak identifications:1, furan; 3, phenanthrene; 4,
4H-cyclopenta[def] phenanthrene; 5, fluoranthene; 6, acephenanthrylene; 7, pyrene; 9,
benzo[ghi]fluoranthene; (b) eugenol flame soot: 1, phenol; 2, guaiacol; 3, naphthalene; 4,
2-methoxy-4-methylphenol; 5, 4,7-dimethyl-3(2H)-benzofuranone; 6, eugenol; 7, isoeugenol; 8,
phenanthrene. Other peaks are mainly complex phenols (phenanthroid) and some traces of
phenalenes and pyrenes.
Figure 6. Routes to soot formation from: (a) n-decane; and (b) an aromatic fuel such as
anisole.
Figure 7. Computed opposed diffusion flames for furfural. The fuel flow is from the left hand
side and air from the right. The position of the maximum CH* chemiluminescent emission is
indicated by a vertical arrow.
Figure 8. Computed opposed diffusion flames for anisole. The fuel flow is from the left hand
side and air from the right. The position of the maximum CH* chemiluminescent emission is
|5mm|
Figure 1. Upper figures: direct photographs of (a) furfural (b) anisole flames on a wick
burner; and lower figures: CH* emission of the same flames through a 430 nm filter.
Figure 3. Graph relative particle numbers (dN/dlogDp/cc) against particle diameter Dp(nm) at
5cm above the flame tip for anisole.
0.E+00 1.E+07 2.E+07 3.E+07 4.E+07 5.E+07 6.E+07 7.E+07 8.E+07
0 100 200 300 400 500 600 700 800
d
N
/d
lo
g
D
p
/c
c
Figure 4. TEM images of soot particles deposited on an electron microscope grid sampled
just after the reaction zone flame (a) furfural, (b) eugenol, both high resolution (scale marked 10 nm).
Figure 5. (a) GC-MS plot (ion count against time) of adsorbed hydrocarbons pyrolysed at
400oC: (a) pine wood flame soot: selected peak identifications:1, furan; 3, phenanthrene; 4, 4H-cyclopenta[def]phenanthrene; 5, fluoranthene; 6, acephenanthrylene; 7, pyrene; 8, l, 2-(octadecyloxy)ethanol; 9, benzo[ghi]fluoranthene; 10, 3,4-di-n-butoxy-3 cyclobutene-1,2 dione. (b) eugenol flame soot: 1, phenol; 2, guaiacol; 3, naphthalene; 4, 2-methoxy-4-methylphenol; 5, 4,7-dimethyl- 3(2H)-benzofuranone; 6, eugenol; 7, isoeugenol; 8,
phenanthrene. Other peaks are mainly complex phenols (phenanthroid) and some traces of phenalenes and pyrenes.
(a)
(b)
Figure 6. Routes to soot formation from: (a) from n-decane; and (b) an aromatic fuel such as
Figure 7. Computed opposed diffusion flames for furfural. The fuel flow is from the left hand side and air from the right. The position of the maximum CH* chemiluminescent emission is indicated by a vertical arrow.
0.000 0.005 0.010 0.015 0.020 0.025 0.030
0 0.2 0.4 0.6 0.8
M
o
le
f
ra
ct
io
n
Distance (cm)
C
2H
2C
6H
6BIN 1A
C
10H
8furfural
CH*
Figure 8. Computed opposed diffusion flames for anisole. The fuel flow is from the left hand side and air from the right. The position of the maximum CH* chemiluminescent emission is indicated by a vertical line.
0 0.004 0.008 0.012 0.016 0.02
0 0.2 0.4 0.6 0.8
M
o
le
f
ra
ct
io
n
Distance (cm)
C
2H
2C
6H
6C10H8
BIN1A
air
anisole
Supporting Information
Details of the structures in the reaction mechanism are given in Table S1 and the kinetic data in Table S2. The kinetic data are estimated values based on data for analogous reaction parameters given in reference 31. The furan terminology follows reference 36.
Table S1
Structure and nomenclature of some species used in the reaction mechanism
furfural (furf)
furan-2-carbaldehyde
eugenol (eug)
2-methoxy-4-allylphenol or 4-allylguaiacol
furyl-CO: [C4H3O]-CO
eugenyl-1: C7H7O2
furyl-2: C4H3O radical eugenyl-2: C6H7O radical
propargyl radical
C3H3
CH2=C=CH
allyl radical
C3H5
CH2-C=CH2
cyclopentadienyl radical
cyclo-C5H5
cyclopentadienone
Table S2. Kinetic data employed for the Arrhenius Expression, k = A Tn exp (-Ea/RT).
No. reaction products
Pre-exponential factor, A (1/s)
n Activation
Energy,
Ea (kcal/mol)
1 furf furyl-2 + HCO 8.4×10¹⁵ 0.0 83.0
2 furyl-2 C3H3 + CO 4.2×10¹⁵ 0.0 99.0
3 furf + OH furyl-CO + H2O 2.0×10¹² 0.0 0.0
4 furyl-CO furyl-2 + CO 4.2×10¹⁵ 0.0 83.0
4 B furyl-CO furyl-2 + CO 1.0×10¹⁴ 0.0 20.0
5 furf + CH3 furyl-CO + CH4 1.6×10¹² 0.0 38.7
6 eug eugenyl-1 + CH2CHCH2 1.0×10¹⁴ 0.0 50.7
7 eugenyl-1 eugenyl-2 + CO 1.0×10¹⁴ 0.0 50.7
8 eugenyl-2 cyclo-C5H5 + CH2O 1.0×10¹⁴ 0.0 50.7
9 eugenyl-2 cyclo-C5H4O + CH3 1.0×10¹⁴ 0.0 50.7
Where: furf: [C4H3O.CHO]; furyl-2: C4H3O; furyl-CO: [C4H3O]-CO; furyl-2: [C4H3O]