prompts reductions in alcohol consumption.
.
White Rose Research Online URL for this paper:
http://eprints.whiterose.ac.uk/131116/
Version: Published Version
Article:
Kersbergen, I. orcid.org/0000-0002-8799-8963, Oldham, M., Jones, A. et al. (3 more
authors) (2018) Reducing the standard serving size of alcoholic beverages prompts
reductions in alcohol consumption. Addiction. ISSN 0965-2140
https://doi.org/10.1111/add.14228
© 2018 The Authors. Addiction published by John Wiley & Sons Ltd on behalf of Society
for the Study of Addiction. This is an open access article under the terms of the Creative
Commons Attribution License, which permits use, distribution and reproduction in any
medium, provided the original work is properly cited.
(http://creativecommons.org/licenses/by/4.0/)
eprints@whiterose.ac.uk
https://eprints.whiterose.ac.uk/
Reuse
This article is distributed under the terms of the Creative Commons Attribution (CC BY) licence. This licence
allows you to distribute, remix, tweak, and build upon the work, even commercially, as long as you credit the
authors for the original work. More information and the full terms of the licence here:
https://creativecommons.org/licenses/
Takedown
If you consider content in White Rose Research Online to be in breach of UK law, please notify us by
Reducing the standard serving size of alcoholic beverages
prompts reductions in alcohol consumption
Inge Kersbergen
1,2, Melissa Oldham
3, Andrew Jones
1,2, Matt Field
1,2, Colin Angus
2,3&
Eric Robinson
1,2Department of Psychological Sciences, University of Liverpool, Liverpool, UK,1
UK Centre for Tobacco and Alcohol Studies, UK2
and School of Health and Related Research, The University of Sheffield, Sheffield, UK3
ABSTRACT
Aims To test whether reducing the standard serving size of alcoholic beverages would reduce voluntary alcohol con-sumption in a laboratory (study 1) and a real-world drinking environment (study 2). Additionally, we modelled the poten-tial public health benefit of reducing the standard serving size of on-trade alcoholic beverages in the United Kingdom.
Design Studies 1 and 2 were cluster-randomized experiments. In the additional study, we used the Sheffield Alcohol
Pol-icy Model to estimate the number of deaths and hospital admissions that would be averted per year in the United Kingdom if a policy that reduces alcohol serving sizes in the on-trade was introduced.Setting A semi-naturalistic laboratory (study 1), a bar in Liverpool, UK (study 2).Participants Students and university staff members (study 1:n= 114, mean age = 24.8 years, 74.6% female), residents from local community (study 2:n= 164, mean age = 34.9 years, 57.3% fe-male).Interventions and comparators In study 1, participants were assigned randomly to receive standard or reduced serving sizes (by 25%) of alcohol during a laboratory drinking session. In study 2, customers at a bar were served alcohol in either standard or reduced serving sizes (by 28.6–33.3%).Measurements Outcome measures were units of alcohol consumed within 1 hour (study 1) and up to 3 hours (study 2). Serving size condition was the primary predictor.
Findings In study 1, a 25% reduction in alcohol serving size led to a 20.7–22.3% reduction in alcohol consumption. In study 2, a 28.6–33.3% reduction in alcohol serving size led to a 32.4–39.6% reduction in alcohol consumption. Model-ling results indicated that decreasing the serving size of on-trade alcoholic beverages by 25% could reduce the number of alcohol-related hospital admissions and deaths per year in the United Kingdom by 4.4–10.5% and 5.6–13.2%, respec-tively.Conclusions Reducing the serving size of alcoholic beverages in the United Kingdom appears to lead to a reduction in alcohol consumption within a single drinking occasion.
Keywords Alcohol consumption, alcohol policy, drinking environment, nudge, portion size, serving size.
Correspondence to:Inge Kersbergen, Department of Psychological Sciences, University of Liverpool, Eleanor Rathbone Building, Bedford Street South, Liverpool L69 7ZA, UK. E-mail: iker@liv.ac.uk
Submitted 26 October 2017; initial review completed 13 December 2017;final version accepted 26 March 2018
INTRODUCTION
Alcohol consumption contributes to premature death and ill health [1], and alcohol-related harm places a substantial burden on society [2]. Approximately 25% of alcohol consumers in England drink at higher-risk levels, and 20% of high-risk drinkers attempt to reduce their alcohol consumption [3]. However, attempts to cut down do not lead often to actual reductions in alcohol consumption [4,5]. Therefore, changes to the environment that make it easier for people to drink less could have a substantial impact on public health [6,7].
One potential environmental influence on alcohol
consumption that is yet to be examined is serving size. Nu-trition research shows consistently that portion sizes affect how much a person eats [8,9]. People eat more if they are given a relatively large portion of food compared to smaller portions, but they do not fully compensate for this by eating less afterwards [10]. Similarly, people drink more if they are served a large non-alcoholic beverage with their meal compared to a smaller serving of that beverage [11,12].
There is a small amount of evidence indicating that the way that alcohol is served may affect drinking be-haviour. A field study showed that the size of glass that
people drink from may affect wine consumption [13],
although thisfinding was not replicated fully at another
venue [14]. However, the effect that alcoholic beverage serving size has on alcohol consumption has not been examined. Given that serving size has a robust effect on food intake, and consumers do not appear to compensate later for changes in food serving size, we hypothesized that the serving size of alcohol beverages may have a causal effect on voluntary alcohol consumption. If alcoholic beverage serving size does indeed have a causal influence
on alcohol consumption, then reductions to standard serving sizes could be an effective way of decreasing population-level alcohol consumption and harm.
We aimed to investigate if reducing the serving size of alcoholic beverages would reduce alcohol consumption. In study 1, participants consumed alcohol from standard versus reduced serving sizes in a laboratory setting. The aims were to (1) compare total alcohol consumption from reduced servings and standard servings and (2) test whether there were any differences in the perceived‘ nor-mality’of the provided serving size between conditions. In study 2, participants consumed alcohol from standard ver-sus reduced serving sizes in a local bar and subsequently reported any alcohol consumption that occurred after the studyfinished in order to examine whether participants
compensated for the reduced serving sizes at later drinking occasions. The aims were to (1) compare total alcohol con-sumption from reduced servings with standard servings and (2) test whether there were any group differences in self-reported alcohol consumption after the intervention period. We then used thefindings from studies 1 and 2 to
inform modelling of the effect of reductions in the serving size of on-trade alcoholic beverages on alcohol-related harm using the Sheffield Alcohol Policy Model (SAPM)
[15]. The aim was to estimate reductions in alcohol-attributable deaths and hospital admissions as a result of serving size reductions.
STUDY 1 METHODS
Design
Pairs of participants attended a laboratory session, and both members of the pairs were randomized to receive alcoholic beverages in standard versus reduced serving sizes.Ad libitumalcohol consumption was measured dur-ing the course of 1 hour. We used cluster-randomization to ensure that participants were blind to the experimental manipulation. We aimed to recruit a minimum of 50 par-ticipants per condition to have sufficient power to detect a
medium to large effect size (d= 0.57) in a two-tailedt-test (α = 0.05) at 80% power, based on the effect sizes
re-ported by Zlatevskaet al. [8]. We did not account formally
for potential clustering in our sample size calculation, but we recruited slightly over the required minimum to increase power.
Participants
One hundred and fourteen participants were recruited in pairs (57 pairs) from students and staff of the University of Liverpool. Participant pairs knew each other and were eligible if they were aged 18 years or older, consumed alco-hol regularly (at least 10 UK units per week; 1 UK unit = 8 g of ethanol) and had a breath alcohol content (BAC) of zero upon arrival in the laboratory. Pairs were not constrained with regard to their gender composition. However, after testing 102 participants, there appeared to be a gender imbalance throughout conditions. We then stratified
randomization by the pairs’gender composition for the re-maining participants to attenuate the gender imbalance. The study received ethical approval from the University of Liverpool ethics committee. Testing took place between July 2015 and March 2016.
Serving size
[image:3.594.311.524.601.734.2]Pairs of participants were assigned randomly to a stan-dard serving size condition or a reduced serving size condition (between-subjects). Participants had access to three types of alcoholic beverage: Magners cider [4.5% alcohol by volume (ABV)], Sol lager (4.5% ABV) and Isla Negra Sauvignon Blanc white wine (12.5% ABV). The beverages in the standard serving size condition contained 2.07 units per serving, which is equivalent to a typical UK serving of beer or wine. Beverages in the re-duced serving size condition contained 1.55 units (a 25% reduction). See Table 1 for volume served and glassware capacity for the different drink types. The glasses used in the two conditions were of the same shape and width (Fig. 1), which resulted in glasses looking comparably full in both conditions.
Table 1 Studies 1 and 2: volume served and glassware capacity in the standard and reduced serving size condition.
Study Drink type
Serving size condition
Volume served (ml)
Glass capacity (ml)
Procedure and measures
The experiment took place on weekdays between 12:00 and 17:30 hours in a semi-naturalistic laboratory de-signed to mimic a home environment that included a sofa, soft furnishings and a television. Participants were told that they were taking part in a study examining how social drinking affects opinions. After providing in-formed consent, participants’ blood alcohol content (BAC) and body weight were measured. Pairs of partic-ipants were allocated randomly to the serving size con-dition. The researcher was not blind to allocation. Participants were asked to order one alcoholic beverage at the start of the study and consume at least some of it. After this, they could order more beverages at any time during the study by pressing a serving button to notify the experimenter. To prevent adverse events, the experimenter monitored participants’ alcohol consump-tion via webcam to ensure that participants consumed no more than 0.8 g of alcohol per kg of body weight. After participants ordered their first beverage, to
corroborate the cover story they completed an attitudes questionnaire on religion and human rights. The experimenter then began showing a 1-hour TV pro-gramme on religion and human rights [16]. Thirty minutes into the programme, the experimenter returned with another attitudes questionnaire and asked whether participants would like another beverage. After 1 hour, the experimenter returned with a final
attitudes questionnaire. Participants then completed a questionnaire battery with (1) an open-ended question to assess what participants thought the aims of the study were; (2) two 5-point Likert items to investigate whether participants considered their own alcohol con-sumption during the study and the provided serving size to be ‘normal’ (anchors ‘strongly disagree’ and
‘strongly agree’); (3) the Restrict subscale of the Temp-tation and Restraint Inventory (TRI [17]) as a measure
of motivation to reduce drinking; (4) the Alcohol Use Disor-ders Identification Test (AUDIT [18]) as a measure of
hazardous drinking; and (5) a single item to assess weekly alcohol consumption in UK units. Finally, participants were thanked and debriefed. Each session lasted approximately 1.5 hours and participants received shopping vouchers for £10 or course credit as reimbursement for their time. All participants completed the study.
Data analysis
We calculated how much beer, cider and wine partici-pants consumed by subtracting the volume of any left-over beverage from the amount of beverages that were ordered. The total alcohol consumption in UK units was calculated by multiplying the volume consumed of each beverage type (in litres) with the beverages’ ABV. Alcohol consumption was distributed normally. We used multi-level regression modelling to evaluate the amount of alcohol consumed across conditions, while controlling for data clustering within participant pairs. To investi-gate whether the effect of serving size on alcohol consumption was robust, we also controlled for gender (between-subjects factor), AUDIT scores and TRI Restrict scores (covariates), because these covariates are likely to influence alcohol consumption. Finally, we used
multi-level regression modelling to evaluate perceived normal-ity of the serving size and the amount of alcohol that participants consumed across conditions. All analyses were conducted in SPSS version 24 [19]. Analyses not accounting for clustering are reported in the Supporting information, Tables S1 and S2.
RESULTS
Alcohol consumption
[image:4.594.92.490.59.223.2]Table 2 shows participant characteristics in both serv-ing size conditions. The results of the multi-level
modelling showed a non-significant reduction in
alco-hol consumption attributed to the reduced serving size condition [B = 0.80 ( 1.69, 0.09), standard error (SE) = 0.44, t(57) = 1.80, P = 0.08]. However, this reduction became significant when controlling for
gender, AUDIT scores and TRI Restrict scores [B = 1.33 ( 2.46, 0.20), SE = 0.57,
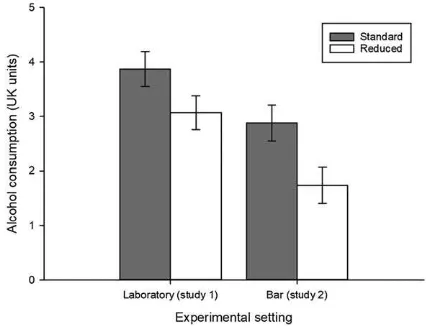
t(109.70) = 2.33, P = 0.02] (Table 3). Estimated means show that participants in the reduced serving size condition drank 20.7–22.3% less alcohol than participants in the standard serving size condition (Supporting informa-tion, Table S3, Fig. 2).
Perceived normality of serving size
On average, participants considered the provided serving sizes and the amount of alcohol that they consumed to be relatively‘normal’(average score greater than 3 out of 5). There was a trend for participants to perceive the smaller servings as less normal [B = 0.35 ( 0.77, 0.06), SE = 0.21,t(57)= 1.70,P= 0.10], but participants in both conditions perceived their own alcohol consumption
during the study as comparably normal [B = 0.11 ( 0.53, 0.30), SE = 0.21,t(57)= 0.54,P = 0.59]. See
[image:5.594.85.528.76.185.2]Table 4 for estimated means.
Table 2 Study 1: participant characteristics by serving size condition.
Serving size condition
Total (n = 114) Reduced (n = 60) Standard (n = 54)
Age; mean (SD) 24.82 (10.48) 23.28 (8.61) 26.52 (12.08)
Gender;nmale/female 29/85 11/49 18/36
AUDIT; mean (SD) 13.96 (6.06) 14.30 (6.52) 13.57 (5.54) TRI Restrict; mean (SD) 9.70 (5.40) 9.55 (5.26) 9.87 (5.58) UK units per week; mean (SD) 17.72 (12.27) 19.27 (12.99) 16.01 (11.29)
[image:5.594.310.523.233.398.2]AUDIT = Alcohol Use Disorders Identification Test. AUDIT scores range between 0 and 40. TRI = Temptation and Restraint Inventory. TRI Restrict scores range between 3 and 21. SD = standard deviation.
Table 3 Study 1: unadjusted and adjusted multi-level regression model with serving size predicting observed alcohol consumption (UK units); participants are clustered in pairs (level 2).
Unadjusted (n = 114) Adjusted (n = 114)
B (SE) (95% CI) P B (SE) (95% CI) P
Fixed components
Intercept 3.87 (0.32) (3.23, 4.52) <0.001 3.99 (0.48) (3.04, 4.95) <0.001 Serving size condition (reference: standard) 0.80 (0.44) ( 1.69, 0.09) 0.08 1.33 (0.57) ( 2.46, 0.20) 0.02 Gender (reference: sale) 1.31 (0.37) ( 2.04, 0.58) 0.001 Serving size × gender 0.82 (0.55) ( 0.28, 1.92) 0.14
AUDIT 0.07 (0.02) (0.02, 0.11) 0.003
TRI Restrict 0.02 (0.02) ( 0.06, 0.03) 0.47
Random components
Level 2 variance (pairs) 2.48 (0.53) 1.84 (0.41) Level 1 variance (participants) 0.63 (0.12) 0.57 (0.11)
AUDIT = Alcohol Use Disorders Identification Test. AUDIT scores range between 0 and 40. TRI = Temptation and Restraint Inventory. TRI Restrict scores range between 3 and 21. CI = confidence interval; SE = standard error.
[image:5.594.86.526.548.714.2]STUDY 2
We conducted study 2 to investigate the effect of serving size over a longer drinking period in a real-world drinking environment.
METHODS
Design
Participants attended one of four quiz nights in a bar in the centre of Liverpool. We allocated nights randomly so that standard-sized beverages would be served on 2 nights and reduced-sized beverages on 2 nights. The unadjusted analysis in study 1 showed a medium effect size (d= 0.45, Supporting information, TableS1). Based on this, we needed a sample size ofn= 128 to detect a medium effect (d = 0.50) in a two-tailed t-test (α = 0.05) with 80% power. To allow for dropouts
and no-shows, we recruited up to the bar’s capacity (n= 50 per night, total n = 200). We used a cluster-randomized design to ensure that participants were blind to the experimental manipulation. We measured how much alcohol participants consumed during the quiz (up to 3 hours) and participants later self-reported any further alcohol consumption during the same evening. This permitted us to examine whether any reduction in alcohol consumption was subsequently compensated for.
Participants
One hundred and sixty-six participants attended one of the quiz nights. Participants were recruited in teams of two to five participants from the Liverpool area (e.g. on
local social media pages, local radio, mailing lists from local organizations). Participants were eligible to take part if they were aged 18 years or older. The study received ethical approval from the University of Liverpool ethics committee. Testing took place in April and May 2017.
Serving size manipulation
Quiz nights were assigned to a standard serving size condition or a reduced serving size condition in a counterbalanced order. Four types of beer/cider (average 4.85% ABV) and three types of wine (average 12% ABV) were available to purchase each night. On nights allocated to the standard serving size condition, beer and cider were served in non-branded pint glasses (568 ml; 2.75 UK units/serving) and wine was served in 175-ml servings in medium wine glasses (2.19 UK units/serving). On nights allocated to the reduced serving size condition, beer and cider were served in non-branded ⅔ pint glasses
(379 ml; 1.84 UK units/serving) and wine in 125-ml servings in small wine glasses (1.50 UK units/serving). Participants could also order a variety of soft drinks, which were served in the same type of glass as beer and cider. The cost of each beverage was proportional to serving size and displayed near the bar.
Observing alcohol consumption
Researchers recorded individual participants’alcohol con-sumption covertly during the quiz. Additionally, one mem-ber of staff serving at the bar and one researcher recorded the total number of beverages that were sold on each night and the amount of wastage. All observers were aware of the study hypotheses. See Supporting information for a de-tailed description of observation methods.
Procedure
[image:6.594.71.511.98.197.2]The study and analysis protocol was registered at http:// osf.io/2tmu6 prior to data collection. Testing took place in the function room of a local bar on Tuesday and Wednesday evenings between 19:30 and 22:30 hours. To obscure the real aims of the study, participants were informed that they would be taking part in a study investigating how personality characteristics affected group performance in a quiz. Upon arrival, participants gave verbal consent, provided their age and gender and completed a short bogus personality questionnaire.
Table 4 Study 1: perceived normality of the amount of alcohol participants personally consumed during the study and the serving size provided in the standard and reduced serving size conditions; means are estimated from multi-level regression model accounting for data clustering within participant pairs.
Serving size condition
Reduced (n = 60) Standard (n = 54)
Mean (SE) (95% CI) Mean (SE) (95% CI) d
Normality of amount consumed during study 3.80 (0.15) (3.50, 4.10) 3.68 (0.14) (3.40, 3.97) 0.11 Normality of serving size 3.70 (0.15) (3.40, 4.01) 3.35 (0.14) (3.06, 3.64) 0.32
Participants were asked to purchase beverages only from the private bar in the function room and not from the bar’s main area.1The quiz lasted approximately 1 hour and 40 -minutes (see Supporting information). Participants could arrive up to 30 minutes prior to the quiz and were asked to leave 45 minutes after the quiz ended (a minimum of 1 hour and 40 minutes and a maximum of 3 hours to order and consume beverages).
The following day, participants completed an online questionnaire that included the AUDIT-C [20] as a mea-sure of typical alcohol consumption. Participants also re-ported the brand/type and serving size of any alcoholic beverages they consumed before, during and after the quiz. We used the brand and serving size information to calcu-late the number of UK units in each beverage. If partici-pants were not able to remember the exact brand they consumed, we calculated the number of UK units based on the average ABV for each beverage type [21]. To corrob-orate the cover story, these measures were embedded in questionnaires about participants’ contribution to their quiz team. Responses to the follow-up questionnaire that were submitted more than 7 days after the quiz were ex-cluded from analysis due to concerns about reduced recall accuracy [22]. All participants were debriefed and informed about the real aims of the study 7 days after the
final quiz night took place.
Data analysis
Observed alcohol consumption during the quiz
We used multi-level regression modelling to evaluate the amount of alcohol consumed across conditions, while controlling for data clustering within teams and quiz nights. In an adjusted analysis, we also controlled for gender (between-subjects factor), AUDIT-C scores and self-reported alcohol consumption prior to the quiz (covar-iates). Because observed alcohol consumption was not dis-tributed normally, we created 1000 bootstrap samples to estimate bias-corrected and accelerated 95% confidence
intervals (CIs) for the model parameters [bias-corrected and accelerated (BCa) 95% CIs]. Analyses not accounting for clustering are reported in the Supporting information, Table S5.
Self-reported alcohol consumption after the quiz
To examine whether participants would compensate for the reduced servings by consuming more alcohol after
the study, we analysed the effect of serving size condition on self-reported alcohol consumption after the quiz using a Bayesian t-test for independent samples. We also analysed the effect of serving size condition on self-reported alcohol consumption after the quiz, while controlling for gender, AUDIT-C scores and self-reported alcohol consumption prior to the quiz using a Bayesian analysis of covariance (ANCOVA). We used Bayesian analysis be-cause we hypothesized that the serving size manipulation would not affect consumption significantly after the study
[23]. Bayesian analyses were conducted in JASP version 0.8.1.1 [24]. All other analyses were conducted in SPSS version 24 [19].
RESULTS
Participant characteristics
As per study protocol, two participants were excluded from all analyses because they guessed that their alcohol con-sumption was being observed during the study. Thefinal
sample consisted of 164 participants (see Table 5). One par-ticipant did not complete the questionnaire during the study. Sixteen participants did not complete the follow-up questionnaire. These participants were excluded where applicable using listwise exclusion.
Observed alcohol sales
The bar sold on average 28.07% less alcohol on nights with reduced servings (mean = 77.9 UK units, SD = 14.3) than on nights with standard servings (mean = 108.3 UK units, SD = 6.1; means weighted for number of attendees).
Observed alcohol consumption
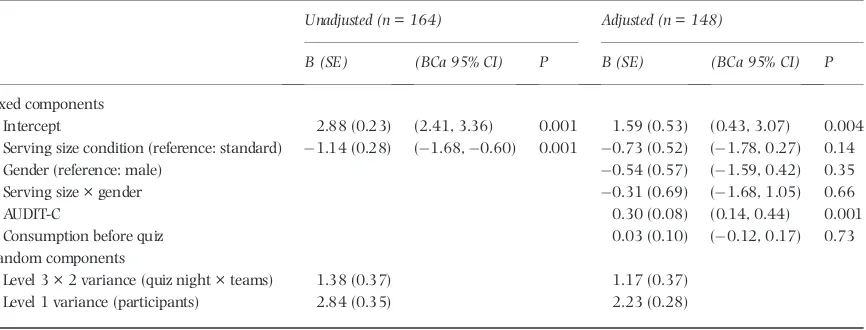
The results of the multi-level modelling showed a signifi
-cant reduction in alcohol consumption attributed to the re-duced serving size condition [B = 1.14 ( 1.68, 0.60), standard error (SE) = 0.28,P= 0.001]. However, this re-duction [B = 0.73 ( 1.78, 0.27), SE = 0.52,P= 0.14] became non-significant when controlling for gender,
AUDIT-C scores and self-reported alcohol consumption prior to the quiz (Table 6). Inspection of the estimated means shows that participants in the reduced serving size condition drank 32.4–39.6% less alcohol than participants in the standard serving size condition (Supporting informa-tion, Table S4, Fig. 2).
1The main bar served different beverage types than the private bar for the experiment, and beverages from the main bar were not included in the serving size
Self-reported alcohol consumption after the study
The Bayesian analysis was inconclusive in an unadjusted analysis [Bayes factor (BF)10= 0.36]. However, after
con-trolling for gender, AUDIT-C scores and self-reported consumption before the study, there was sufficient
evi-dence that serving size condition did not affect self-reported alcohol consumption after the study (BF10= 0.29). See
Table 7 for (un)adjusted means.
POLICY MODEL
[image:8.594.69.516.75.209.2]We used the SAPM version 3.1 [15] to estimate the potential effect of systematic reductions in the serving size of all beverages served in the on-trade on alcohol-related harm. As the effect size in study 2 was substan-tially larger than in study 1, we based the policy model on the more conservative effect size from study 1.
Table 6 Study 2: unadjusted and adjusted multi-level regression model with serving size predicting observed alcohol consumption (UK units); participants are clustered in teams (level 2) and quiz nights (level 3).
Unadjusted (n = 164) Adjusted (n = 148)
B (SE) (BCa 95% CI) P B (SE) (BCa 95% CI) P
Fixed components
Intercept 2.88 (0.23) (2.41, 3.36) 0.001 1.59 (0.53) (0.43, 3.07) 0.004 Serving size condition (reference: standard) 1.14 (0.28) ( 1.68, 0.60) 0.001 0.73 (0.52) ( 1.78, 0.27) 0.14 Gender (reference: male) 0.54 (0.57) ( 1.59, 0.42) 0.35 Serving size × gender 0.31 (0.69) ( 1.68, 1.05) 0.66
AUDIT-C 0.30 (0.08) (0.14, 0.44) 0.001
Consumption before quiz 0.03 (0.10) ( 0.12, 0.17) 0.73 Random components
Level 3 × 2 variance (quiz night × teams) 1.38 (0.37) 1.17 (0.37) Level 1 variance (participants) 2.84 (0.35) 2.23 (0.28)
[image:8.594.77.510.288.453.2]AUDIT = Alcohol Use Disorders Identification Test; AUDIT-C scores range between 0 and 12. CI = confidence interval; SE = standard error; BCa = bias-corrected and accelerated.
Table 7 Study 2: unadjusted and adjusted mean self-reported alcohol consumption (UK units) after the quiz in the standard and reduced serving size condition.
Unadjusted Adjusteda
Serving size condition Mean (SD) (95% CI) BF10 Mean (SE) (95% CI) BF10
Standard (n= 64) 1.36 (2.58) (0.71, 2.00) 0.36 1.36 (0.24) (0.88, 1.84) 0.29 Reduced (n= 84) 0.92 (1.74) (0.54, 1.30) 1.02 (0.21) (0.60, 1.44)
aMeans adjusted for gender, AUDIT-C scores and self-reported alcohol consumption before the quiz. CI = confidence interval; SD = standard deviation; BF = Bayes factor.
Table 5 Study 2: participant characteristics by serving size condition.
Serving size condition
Total (N = 164) Reduced (n = 87) Standard (n = 77)
Gendera;nmale/female 69/94 36/50 33/44
Number of individual teams 38 19 19
Team size; mean (SD) 4.37 (0.98) 4.63 (0.74) 4.11 (1.12) Agea; mean (SD) 34.89 (12.45) 34.57 (11.58) 35.25 (13.42) AUDIT-Cb; mean (SD) 4.43 (1.82) 4.26 (1.84) 4.64 (1.79) Self-reported consumption before study (UK units)b; Mean (SD) 1.75 (2.11) 2.04 (2.22) 1.36 (1.91) Attrition; % lost to follow-up 9.76% 3.45% 16.88%
AUDIT = Alcohol Use Disorders Identification Test; AUDIT-C scores range between 0 and 12.aOne participant did not complete the demographics question-naire. Statistics for these variables are based on totalN= 163 (reducedn= 86, standardn= 77).bAUDIT-C and self-reported consumption before the study
[image:8.594.69.510.637.713.2]SAPM is a deterministic mathematical simulation model that models how alcohol policies such as pricing and taxation changes [25] affect alcohol consumption and the resulting changes in alcohol-attributable mortality and morbidity. The model methodology is described exten-sively elsewhere [15,26]. SAPM uses alcohol consumption data from the 2014 Health Survey for England (HSE) to rep-resent baseline consumption in the model. These data are combined with alcohol purchasing data from the 2010–
14 Living Costs and Food Surveys to estimate the propor-tion of each HSE respondent’s consumption, which falls into 10 categories: on- and off-trade beer, cider, wine, spirits and Ready-to-Drinks (RTDs) (pmixed beverages often re-ferred to as‘alcopops’)—see Brennanet al. [27] for full de-tails of this apportionment process. Based on the results of study 1 we estimated that a 25% reduction in serving size could lead to an approximate reduction in alcohol con-sumption of 20.7%. We modelled the effect of this reduction in on-trade alcohol consumption, as well as a more conser-vative estimate (a 10.3% decrease—half the effect size in study 1), to account for the possibility that the population effect size is substantially smaller. See Supporting informa-tion for full details. For each scenario we modelled the long-term (20-year [27]) impact on alcohol-attributable deaths and hospital admissions from 43 different alcohol-related health conditions and compared these to a counter-factual scenario where alcohol consumption remained unchanged. The modelled scenarios resulted in an esti-mated 5.6–13.2% reduction in deaths per year and an esti-mated 4.4–10.5% reduction in hospital admissions per year compared to the baseline scenario (see Table 8).
DISCUSSION
We investigated the effect of alcoholic beverage serving size on alcohol consumption. In study 1, we demonstrated that reduced serving sizes led to a 20.7–22.3% decrease in alco-hol consumption in the laboratory during a 1-hour drink-ing period. In study 2, we showed that reduced servdrink-ing sizes led to a 32.4–39.6% decrease in alcohol consumption in a real-world drinking environment during a longer
drinking period (up to 3 hours). Additional sensitivity anal-yses indicated a reduction of 17.4–31.9% attributed to the reduced serving size. People did not compensate for the serving size reductions by consuming more alcohol after the study. Thesefindings support our hypothesis that
serv-ing size has a causal effect on alcohol consumption. The exact magnitude of the reduction in alcohol con-sumption was dependent upon the analysis used. The anal-ysis adjusting for clustering of alcohol consumption within participant pairs/teams showed a 20.7 and 39.6% reduc-tion in alcohol consumpreduc-tion in studies 1 and 2, respec-tively. Because clustering occurred in both studies, we believe this to be the best approximation of the effect of serving size on alcohol consumption in the present studies. While the reduction in serving size led to a reduction in alcohol consumption in both studies, the reduction in alco-hol consumption was somewhat larger in study 2 (where standard serving sizes of 2.8 units for beer/cider and 2.2 units for wine were reduced by 28.7–33.3%) than in study 1 (where standard serving sizes of 2.1 units were re-duced by 25%). One explanation is that greater serving size reductions will prompt greater reductions in alcohol con-sumption. However, given the differences between the two study designs, other factors may partially explain this differ-ence. A further difference between the two studies is that in study 1 participants were required to consume at least some alcohol and had access only to alcoholic beverages, whereas participants in study 2 were able to consume non-alcoholic beverages and were not required to drink any alcohol at all. These studies are thefirst, to our knowledge, to
[image:9.594.87.524.624.733.2]demon-strate that reducing the serving size of alcoholic beverages prompts reductions in alcohol consumption. This is consis-tent with research demonstrating that food portion size has a causal effect on energy intake [28] and consumers do not fully compensate for the effect that portion size has on total energy intake [10,29]. In the present studies we examined alcohol consumption during relatively short periods. However, in study 2 we found that reduced serving sizes led to decreased alcohol consumption during 3 hours; a length of time that is comparable to most drinking occa-sions in the UK population [30]. In study 2 we also found
Table 8 Policy model: annual effects of a 25% reduction in the serving size of alcohol sold in the on-trade on alcohol-related deaths and hospital admissions, compared to a‘no policy’baseline model, 20 years after policy implementation.
Policy scenario
Deaths per year Hospital admissions per year
Absolute Relative Absolute Relative
Baseline 12 284 833 722
no evidence that participants consumed more alcohol dur-ing the remainder of the night if they had been provided earlier with reduced serving size alcoholic beverages. It would now be informative for future research to investigate the long-term effect of reducing the standard serving sizes of alcoholic beverages on alcohol consumption.
As the aim of the present research was to examine the causal influence of serving size on alcohol consumption,
we did not make participants explicitly aware of the serving size reductions made. Instead, we used cover stories in both experiments, limiting the likelihood that ourfindings can
be explained by demand characteristics [31]. We cannot completely rule out demand characteristics in either study, because participants in the reduced serving size conditions may have been conscious of the fact that they were receiv-ing a smaller than usual servreceiv-ing of alcohol. If servreceiv-ing size reductions to on-trade alcoholic beverages were to be im-plemented as a policy, this would require transparency. It is possible that unfavourable opinions towards systematic alcohol serving size reductions would lead to psychological reactance to the policy [32], limiting its effectiveness. It would therefore be informative to examine public accept-ability of serving size reductions to alcoholic beverages and whether awareness of serving size reductions affects their influence on alcohol consumption.
Our methodology had some limitations. First, observers in study 2 were aware of the study aims. This could have influenced the way they coded alcohol consumption.
How-ever, in line with recommendations [33], the observers were well trained and each participant was observed by two independent observers. Secondly, glass size varied be-tween serving size conditions to ensure that glasses ap-peared similarly full. People may consume more alcohol from larger glasses [14,34]. Therefore, future work may benefit from controlling for glass size when examining
the effect of serving size. Thirdly, participants in study 1 were primarily university students and despite recruiting from the local community for study 2, the sample may not be representative of the UK population. Future re-search should investigate the effect of serving size reduc-tion in more diverse populareduc-tions and examine whether the effect is moderated by demographic characteristics.
The typical serving size of beer in the United Kingdom (568 ml) is larger than serving sizes used in many other countries [35], and the size of on-trade wine servings in the United Kingdom has increased during recent decades [36]. It is therefore feasible that existing serving size legisla-tion [37] could be adapted to introduce a cap on available serving sizes and accommodate the sales of smaller serv-ings. We used the SAPM to estimate the potential public health benefit of reducing the default serving sizes of
alco-holic beverages in the on-trade. Our most conservative es-timates suggest that serving size reductions might reduce alcohol-related deaths and hospital admissions to a similar
extent as a £0.50 minimum unit price [15]. However, it is important to acknowledge that these estimates are subject to limitations of our studies outlined above. Additionally, while the aggregate effects of serving size reductions and minimum unit pricing may be similar, the cheap alcohol that would be affected by minimum unit pricing is con-sumed by different demographics than the on-trade alcohol that would be affected by serving size reductions. There-fore, the distribution of effects would probably be very different for both policies. Nevertheless, ourfindings
high-light alcoholic beverage serving size as a potential target for public health interventions.
To conclude, this research is thefirst to demonstrate
that the serving size of alcoholic beverages affects alcohol consumption. Reducing the standard serving sizes of alco-holic beverages may be an effective way to reduce alcohol consumption at the population level.
Declaration of interests
None.
Acknowledgements
We thank Rachel Burgon, David Keeling and Jennifer Walker for their assistance with study 1, and Laura Baines, Rebecca Bianchi, Emily Crowne, Tom Gough, Katherine Haley, Ashleigh Haynes, Graeme Knibb, Jo-Anne Puddephatt, Rachel Quinn, Helen Ruddock, Florence Sheen, Isabel Smith, Eleanor Spooner, Jessica Waddingham and the staff from the Ship & Mitre for their assistance with study 2. We are grateful to Richard de Visser for his comments on an early draft of the manuscript. The current research and ER’s sal-ary were partially funded by the Medical Research Council (MR/N000218/1).
References
1. Rehm J., Mathers C., Popova S., Thavorncharoensap M., Teerawattananon Y., Patra J. Global burden of disease and in-jury and economic cost attributable to alcohol use and alcohol-use disorders.Lancet2009;373: 2223–33. 2. Public Health England. The Public Health Burden of Alcohol
and the Effectiveness and Cost-Effectiveness of Alcohol Control Policies: An evidence review. 2016. Available at: https:// www.gov.uk/government/publications/the-public-health-bur-den-of-alcohol-evidence-review (accessed 26 April 2017) (Archived at http://www.webcitation.org/6wPqODNiC on 12 January 2018).
3. Beard E., Brown J., Kaner E., West R., Michie S. Predictors of and reasons for attempts to reduce alcohol intake: a popula-tion survey of adults in England. PLOS ONE 2017; 12: e0173458.
5. Chiappetta V., García-Rodríguez O., Jin C. J., Secades-Villa R., Blanco C. Predictors of quit attempts and successful quit at-tempts among individuals with alcohol use disorders in a nationally representative sample.Drug Alcohol Depend2014;
141: 138–44.
6. Marteau T. M., Ogilvie D., Roland M., Suhrcke M., Kelly M. P. Judging nudging: can nudging improve population health?
BMJ2011;342: d228.
7. Hollands G. J., Bignardi G., Johnston M., Kelly M. P., Ogilvie D., Petticrew M.et al. The TIPPME intervention typology for changing environments to change behaviour.Nat Hum Behav
2017;1: 140.
8. Zlatevska N., Dubelaar C., Holden S. S. Sizing up the effect of portion size on consumption: a meta-analytic review.J Mark
2014;78: 140–54.
9. Hollands G. J., Shemilt I., Marteau T. M., Jebb S. A., Lewis H. B., Wei Y.et al. Portion, package or tableware size for changing selection and consumption of food, alcohol and tobacco.
Cochrane Database Syst Rev 2015; Issue 9. Art. No.: CD011045. https://doi.org/10.1002/14651858.CD011045. pub2.
10. Rolls B. J., Roe L. S., Meengs J. S. The effect of large portion sizes on energy intake is sustained for 11 days. Obesity
2007;15: 1535–43.
11. Norton E. M., Poole S. A., Raynor H. A. Impact of fruit juice and beverage portion size on snack intake in preschoolers.
Appetite2015;95: 334–40.
12. Flood J. E., Roe L. S., Rolls B. J. The effect of increased beverage portion size on energy intake at a meal.J Am Diet Assoc2006;
106: 1984–90.
13. Pechey R., Attwood A. S., Couturier D.-L. L., Munafò M. R., Scott-Samuel N. E., Woods A.et al. Does glass size and shape influence judgements of the volume of wine? PLOS ONE
2015;10: 1–11.
14. Pechey R., Couturier D.-L., Hollands G. J., Mantzari E., Zupan Z., Marteau T. M. Wine glass size and wine sales: a replication study in two bars. BMC Res Notes 2017;
10: 287.
15. Angus C., Holmes J., Pryce R., Meier P., Brennan A. Alcohol and cancer trends: Intervention Studies. University of
Shef-field and Cancer Research UK; 2016.
16. The Big Questions [episode in television series]. Episode 16. London: BBC2; 10 May 2015.
17. Collins R. L., Lapp W. M. The Temptation and Restraint Inven-tory for measuring drinking restraint.Br J Addict1992;87: 625–33.
18. Saunders J. B., Aasland O. G., Babor T. F., de la Fuente J. R., Grant M. Development of the Alcohol Use Disorders Identifi -cation Test (AUDIT): WHO collaborative project on early detection of persons with harmful alcohol consumption—II.
Addiction1993;88: 791–804.
19. IBM Corporation.SPSS Statistics for Windows, version 24.0. Armonk, NY: IBM Corp; 2016.
20. Bush K., Kivlahan D. R., McDonell M. B., Fihn S. D., Bradley K. A. The AUDIT alcohol consumption questions (AUDIT-C).
Arch Intern Med1998;158: 1789–95.
21. National Health Service (NHS). NHS choices. Alcohol units [internet]. Department of Health. Available at: http://www. nhs.uk/Livewell/alcohol/Pages/alcohol-units.aspx (accessed 25 April 2017) (Archived at http://www.webcitation.org/ 6wPqTQOy2 on 12 January 2018).
22. Ekholm O. Influence of the recall period on self-reported alco-hol intake.Eur J Clin Nutr2004;58: 60–3.
23. Rouder J. N., Speckman P. L., Sun D., Morey R. D., Iverson G. Bayesian t tests for accepting and rejecting the null hypothe-sis.Psychon Bull Rev2009;16: 225–37.
24. JASP Team. JASP (version 0.8.1.1). Amsterdam: JASP Team; 2017.
25. Holmes J., Meng Y., Meier P. S., Brennan A., Angus C., Camp-bell-Burton A. et al. Effects of minimum unit pricing for alcohol on different income and socioeconomic groups: a modelling study.Lancet2014;383: 1655–64.
26. Meier P. S., Holmes J., Angus C., Ally A. K., Meng Y., Brennan A. Estimated effects of different alcohol taxation and price pol-icies on health inequalities: a mathematical modelling study.
PLOS Med2016;13: 1–27.
27. Brennan A., Meier P., Purshouse R., Rafia R., Meng Y., Hill-MacManus D. et al. The Sheffield alcohol policy model—a mathematical description.Health Econ2015;24: 1368–88. 28. Rolls B. J., Roe L. S., Meengs J. S. Reductions in portion size and energy density of foods are additive and lead to sustained decreases in energy intake.Am J Clin Nutr2006;83: 11–7. 29. Rolls B. J., Roe L. S., Meengs J. S. Larger portion sizes lead to a
sustained increase in energy intake over 2 days.J Am Diet Assoc2006;106: 543–9.
30. Ally A. K., Lovatt M., Meier P. S., Brennan A., Holmes J. Devel-oping a social practice-based typology of British drinking culture in 2009–2011: implications for alcohol policy analy-sis.Addiction2016;111: 1568–79.
31. Nichols A. L., Maner J. O. N. K. The good-subject effect: inves-tigating participant demand characteristics. J Gen Psychol
2008;135: 151–65.
32. Petrescu D. C., Hollands G. J., Couturier D. L., Ng Y. L., Marteau T. M. Public acceptability in the UK and USA of nudging to reduce obesity: the example of reducing sugar-sweetened beverages consumption.PLOS ONE2016;11: 1–18. 33. Dawkins M. S. Three principles of observational design. In:
Dawkins M. S., editor. Observing Animal Behaviour: Design and Analysis of Quantitative Data. Oxford, UK: Oxford Univer-sity Press; 2007, pp. 52–71.
34. Pechey R., Couturier D.-L., Hollands G. J., Mantzari E., Munafò M. R., Marteau T. M. Does wine glass size influence sales for on-site consumption? A multiple treatment reversal design.
BMC Public Health2016;16: 390.
35. Bloomfield K., Stockwell T., Gmel G., Rehn N. International comparisons of alcohol consumption. Alcohol Res Health
2003;27: 95–109.
36. Goddard E.Estimating Alcohol Consumption From Survey Data: Updated Method of Converting Volumes to Units. London, UK: Office for National Statistics; 2007.
37. UK Government. Weights and measures: the law [internet]. Available at: https://www.gov.uk/weights-measures-and-packaging-the-law/specified-quantities (accessed 11 Septem-ber 2017) (Archived at http://www.webcitation.org/ 6wPqGF8Rh on 12 January 2018).
Supporting Information
Additional Supporting Information may be found online in the supporting information tab for this article.
Table S2Perceived normality of the amount of alcohol par-ticipants personally consumed during the study and the serving size provided in the standard and reduced serving size conditions. Analyses are not adjusted for clustering.
Table S3Unadjusted and adjusted mean observed alcohol consumption (UK units) in the standard and reduced serv-ing size condition. Means are estimated from multi-level re-gression model accounting for data clustering within participant pairs (Table 3).
Table S4Unadjusted and adjusted mean observed alcohol consumption (UK units) in the standard and reduced serv-ing size condition. Means are estimated from multi-level regression model accounting for data clustering within teams and quiz nights (Table 6).
Table S5Unadjusted and adjusted mean observed alcohol consumption (UK units) in the standard and reduced serv-ing size condition.
Table S6 Exploratory analysis. Unadjusted and adjusted multi-level regression model with serving size predicting observed alcohol consumption (UK units). Participants are clustered within teams (level 2) and quiz nights (level 3), excluding any participants who consumed drinks from the main bar.
Table S7 Exploratory analysis. Unadjusted and adjusted mean observed alcohol consumption (UK units) in the standard and reduced serving size condition, excluding any participants who consumed drinks from the main bar. Means are estimated from multi-level regression model accounting for data clustering within teams and quiz nights (Table S1).
Table S8 Exploratory analysis. Unadjusted and adjusted multi-level regression model with serving size predicting observed alcohol consumption (UK units). Participants are clustered in teams (level 2) and quiz nights (level 3). The content of drinks that were purchased downstairs was estimated from observer records and self-reported consumption.