Rochester Institute of Technology
RIT Scholar Works
Theses Thesis/Dissertation Collections
10-1-2012
Verifying the conformance of CMY offset inks to
ISO 2846 by means of a graduated gage
Enqi Zhang
Follow this and additional works at:http://scholarworks.rit.edu/theses
This Thesis is brought to you for free and open access by the Thesis/Dissertation Collections at RIT Scholar Works. It has been accepted for inclusion in Theses by an authorized administrator of RIT Scholar Works. For more information, please [email protected].
Recommended Citation
School of Media Sciences Rochester Institute of Technology
Rochester, New York
Certificate of Approval
Verifying the Conformance of CMY Offset Inks to ISO 2846 by Means of a Graduated Gage
Enqi Zhang
has been approved by the Thesis Committee as satisfactory for the thesis requirement for the Master of Science degree
at the convocation of
October 2012
Thesis Committee:
Primary Thesis Advisor
Secondary Thesis Advisor
Graduate Program Coordinator
Verifying the Conformance of CMY Offset Inks to ISO 2846 by Means of a Graduated Gage
by Enqi Zhang
A thesis submitted in partial fulfillment of the requirements for the degree of Master of Science
in the School of Media Sciences in the College of Imaging Arts and Sciences
of the Rochester Institute of Technology
October 2012
Acknowledgments
The author would like to specially thank his thesis advisor Professor Franz Sigg for
the technical support, preliminary editing, and creative contributions.
The author would also like to thank Professor Robert Chung for providing the topic as
well as the creative concept for the experimental design.
Thanks also to Mr. Daniel Clark from the Printing Applications Laboratory at Roch
-ester Institute of Technology for the use of all the devices for the research, the technical
support, and the necessary materials.
Thanks also to Ashley Walker and Professor Edline Chun for their excellent work in
editing this thesis.
This thesis could not have been done in appropriate timely manner without the help of
Table of Contents
Acknowledgments iii
Abstract x
Chapter 1 1
Introduction 1.1 Topic Statement . . . .1
1.2 Significance of Topic . . . .2
1.3 Reason for Interest in this Topic . . . .3
1.4 Definitions of Terminology . . . .3
Chapter 2 5
Theoretical Basis 2.1 Calculation of IFT . . . .5
2.2 Relationship between IFT and Density . . . .6
2.3 A Graduated Gage . . . .7
2.3.1 Little Joe Proofer . . . .8
2.4 Assumptions of Calibration Curve Uncertainty . . . .10
2.5 Estimation of the Calibration Curve Uncertainty . . . . 11
Chapter 3 13
A Review of the Literature in the Field 3.1 A Brief Introduction to ISO 2846. . . . 13
3.2 ISO 2834 / IGT Method . . . .16
Chapter 4 19
Research Questions 4.1 Preliminary Research Question . . . . 19
4.2 Secondary Research Questions . . . . 19
Chapter 5 21
Methodology 5.1 Instrumentation and Equipment . . . .21
5.2 Standard Laboratory Conditions and Preparation for the Experiment . . . . 21
5.3 Production of IGT/ISO 2834 Samples . . . . 22
5.4 IFT Calculation . . . . 26
5.4.1 Ink Mass Density Calculation . . . . 26
5.4.2 Ink Film Thickness Calculation . . . . 27
5.5 Density and CIELAB Measurements of IGT Samples . . . . 27
5.6 Uniformity of IGT Samples . . . .27
5.6.1 Uniformity in Color . . . . 27
5.6.2 Uniformity in Density . . . . 28
5.7 Generation of CMY Calibration Curves with Uncertainties . . . . 28
5.8 Verifying Inks with the ISO 2834 Method . . . . 29
5.9 Procedure for Little Joe Sample Production . . . . 30
5.10 Color Repeatability of the Little Joe Samples . . . . 31
5.11 Ink Verification by Use of the Calibration Curve and Little Joe Samples . . . . 32
5.12 Color Differences between IGT Color and Little Joe Color . . . . 33
Chapter 6 34
Results 6.1 Uncertainty of the IGT System . . . . 34
6.1.1 Uniformity in Color . . . . 34
6.1.2 Uniformity in Density . . . . 35
6.2 CMY Calibration Curves . . . . 36
6.3 Ink Verification by the ISO 2834 Method . . . . 38
6.4 Color Repeatability of Little Joe Multi-IFT Samples . . . . 39
6.5 Ink Verification by Use of the Calibration Curve and Little Joe Samples . . . . . 41
6.6 Differences Between IGT and Little Joe Multi-IFT Samples . . . . 42
6.7 Summary of the Results . . . . 45
6.7.1 Color Uncertainty of IGT Samples . . . . 45
6.7.2 Density Uncertainty of IGT Samples . . . . 46
6.7.3 Uncertainties of CMY Calibration Curves . . . . 46
6.7.4 Repeatability of CIELAB Values on Little Joe Samples . . . . 46
6.7.5 Comparison of Ink Verification Methods . . . . 47
Chapter 7 48
Conclusions 7.1 Conclusions from the Results . . . . 48
7.1.1 Color and Density Uniformities (Repeatability) of IGT samples . . . . 48
7.1.2 Uncertainty of Calibration Curves . . . . 49
7.1.3 Repeatability of CIELAB Values on Little Joe Samples . . . . 49
7.1.4 Comparison of Ink Verification Methods . . . .50
Chapter 8 52
Modified ISO 2834 Method 8.1 Introduction . . . . 52
8.2 Methodology . . . . 54
8.2.1 Production of IGT Samples . . . . 54
8.2.2 Conformance of the Inks to ISO 2846 . . . .55
8.2.3 Modified ISO 2834 vs. Original ISO 2834 . . . .56
8.3 Results for the Modified ISO 2834 Method vs. Orignal ISO 2834 Method . . . . 57
8.3.1 Cyan . . . . 57
8.3.2 Magenta . . . .58
8.3.3 Yellow . . . . 59
8.4 Discussion and Conclusion . . . . 60
8.4.1 Modified ISO 2834 vs. Original ISO 2834 . . . .60
8.4.2 February ISO 2834 Experiment vs. June ISO 2834 Experiment . . . . 60
8.4.3 Comparison Across Three Methods of Ink Verification . . . . 61
8.5 Future Studies . . . . 64
Appendix 65
List of Equations and Tables
Equation 1. IFT calculation formula, where W is the weight of the ink layer on an ink sample, ρ is the mass density of the ink, l and w are length and width
of the printed area, and IFT is the ink film thickness of the ink layer. . . .6
Equation 2. Formulas to calculate density from IFT . . . . 65
Table 1. Colorimetric values for 0˚:45˚ a geometry, illuminant D50, 2˚ observer for CMY offset inks . . . . 14
Table 2. Range of ink film thickness in micrometers . . . . 14
Table 3. Uncertainty of density at each input level for CMY offset inks . . . . 38
Table 4. CMY converted IFT and ∆E from the standard . . . . 41
Table 5. Comparison of IGT and Little Joe multi-IFT samples in ∆L*, ∆a*, and ∆b* . . 43 Table 6. Cyan coordinates of (IFT, ∆E) needed to verify conformance . . . .57
Table 7. Magenta coordinates of (IFT, ∆E) needed to verify conformance . . . . 58
Table 8. Yellow coordinates of (IFT, ∆E) needed to verify conformance . . . . 59
List of Figures
Figure 1. The graduated gage used in the experiment . . . .7
Figure 2. Application of the ink . . . .8
Figure 3. Drawing the ink down with a scraper . . . .8
Figure 4. Little Joe Proofer with graduated gage . . . .9
Figure 5. Little Joe sample . . . .9
Figure 6. Ink qualification diagram for ink verification . . . . 15
Figure 7. IGT High Speed Inking Unit (left) and IGT printability tester (right) . . . . . 17
Figure 8. The sector (larger cylinder on the right) and printing discs (on the left) . . . . 22
Figure 9. Black rubber distribution roller with the metered-out ink . . . . 23
Figure 10. The ink is distributed evenly between the rubber and steel distribution rollers. . . . . 23
Figure 11. The ink is uniformly transferred to the printing disc . . . . 24
Figure 12. The weight of the disc with the ink before printing . . . . 24
Figure 13. The disc is on the shaft without touching the paper. . . . .25
Figure 14. Cyan, Magenta, and Yellow CRF Curves of Variation (∆E) within four Readings . . . . 35
Figure 16. Cyan Calibration Curve . . . . 37
Figure 17. Magenta Calibration Curve . . . . 37
Figure 18. Yellow Calibration Curve . . . . 37
Figure 19. CMY U-Shaped Ink Qualification (UIQ) Curves . . . . 39
Figure 20. CMY CRF curve of ∆E between averaged CIELAB and each of six CIELAB values at the same density of the Little Joe Multi-IFT samples . . 40 Figure 21. UIQ Curves of CMY Little Joe multi-IFT samples . . . . 42
Figure 22. Spectral curves of CMY IGT (in black) and Little Joe multi-IFT (in cyan) samples . . . . 44
Figure 23. Micro snap shots of C, M, and Y IGT samples (left) and Little Joe multi-IFT samples (right) at the same Status T density . . . . 45
Figure 24. Cyan UIQ Curves . . . . 57
Figure 25. Magenta UIQ Curves . . . .58
Figure 26. Yellow UIQ Curves . . . . 59
Figure 27. Family of UIQ curves for cyan, generated by the original ISO 2834 method in February . . . .62
Figure 28. Family of UIQ curves for magenta, generated by the original ISO 2834 method in February . . . . 63
Abstract
The original intent of this research was to verify that a new method - called the Little
Joe method in this report - could be used to verify that CMY offset inks conform to ISO
2846. This method would use less time to generate multiple ink film thicknesses (IFTs)
than the traditionally used ISO 2834 method. With a graduated gage, a Little Joe proofer
can be used to produce multiple IFTs on a single sample. However, the absolute thickness
values for those IFTs are unknown. Therefore, to calibrate these unknown IFTs, a calibra
-tion curve that relates IFT and optical density should be used. Such a curve would have to
be built based on samples produced by the method described in ISO 2834 using an IGT
printability tester. The question is: will both methods (the traditional ISO 2834 method
and the Little Joe method), either accept or reject a given sample?
This research found that the same IFTs on both samples do not have the same col
-orimetric values. The inkfilm was not as smooth on the Little Joe prints as it was on the
IGT prints. The presence of tiny white spots throughout the Little Joe sample add a gray
component to the color. The difference in smoothness of the ink layer on the Little Joe
proofer comes from the ink not being “worked” as much as it is on the distribution rollers
of the IGT printer. Therefore, the ink is less liquid and not able to completely spread out
and cover the paper. The answer to the research question is that the two methods do not
Towards the conclusion of this research, Professor Franz Sigg and the researcher
made some improvement to the traditional ISO 2834 method and eventually invented
a more efficient method: the modified ISO 2834 method. A high input volume of ink
(0.1 cc) was applied to the IGT inking unit. Then, while the inking unit was kept run
-ning without adding new ink, the disc was weighed before and after each print and was
then re-inked to made another print. As samples were printed, the ink on the inking unit
was reduced, producing prints with progressively thinner ink film thicknesses in rapid
progression since no cleaning was needed between prints. This allowed the prints to be
produced in a much shorter time than with the original ISO 2834 method.
The result of the modified ISO 2834 method agreed with that of the original method
within a tolerance of 1∆E. Therefore, both methods can accept or reject a given sample at
Chapter 1
Introduction
1 1 Topic Statement
ISO 2846 defines colorimetric specifications of standardized offset process inks.
When printed on a piece of standard paper, a standardized ink should have less than 4
∆E color deviation from the colorimetric specifications within the ink film thickness
(IFT) range of 0.7 µ to 1.1 µ. Therefore, to test the conformance of an ink to the ISO
2846 standard, two parameters must be known: the IFT and the color difference from the
colorimetric values specified by the standard. When an ink sample is produced, its devia
-tion from the specifica-tions can be calculated by measuring its color. With regard to IFT
calculation, ISO 2834 defines a laboratory method of producing samples with a “homoge
-neous distribution of ink on a specified substrate” (ISO 2834). IFT can be calculated from
those samples. In this report, this method of sample production, IFT calculation, and ink
verification is called ISO 2834 method.
In this research, a different ink verification method was tested. Since optical density
can be measured and ink film thickness can be calculated by the ISO 2834 method, a
curve of the relationship between them can be plotted. This curve is called a calibration
device that can print multiple ink film thicknesses on a single print in a much shorter time
than when using the normal ISO 2834 method. Each density on this sample could be con
-verted to a corresponding IFT using the calibration curve.
1.2 Significance of Topic
The ISO 2834 method mainly describes how to produce uniform samples so that the
IFT can be calculated in a volumetric way. However, the ISO 2834 method is time con
-suming, because several ink samples must be produced in order to cover the IFT range of
interest. A possible alternative method could be used by assuming that for the same ink
on the same paper, the same IFT will yield the same density and color. Once the relation
-ship between IFT and density is determined for a certain ink, then - next time rather than
measuring ink film thickness volumetrically - this relationship can be used to convert
density to IFT for the same batch of the ink. There is a way to produce multiple IFTs
on a single sample. However the absolute value of IFT in these samples is unknown. All
that is known about these samples is that they encompass the IFT range that is specified
in ISO 2846 in a single sample that can be produced within 5 minutes. This is a much
shorter time than what is needed for the ISO 2834 method. If this proves to be a useful
method, it would result in a significant time reduction for practitioner. For example, an
ink company would only need to add a calibration curve to its certificate document to
unknown IFTs, convert the density to IFT using the curve, measure the color, and make
the conformance decision.
1 3 Reason for Interest in this Topic
Time is money. This new method would tremendously reduce the time needed for
offset inks verification for ink companies and printers. It also would reduce the amount
of materials used in the verification process, which is good for the environment. If this
alternative method proves to be a success, it will enable more efficient offset ink verifica
-tion with less time and materials.
1.4 Definitions of Terminology
• IFT: Ink film thickness
• Printability tester: A device capable of uniformly inking a printing form and trans
-ferring a known weight of ink onto a substrate.
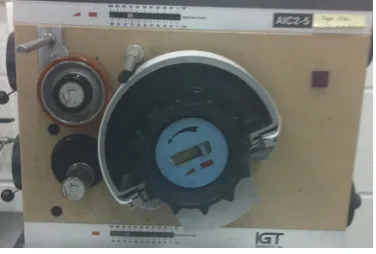
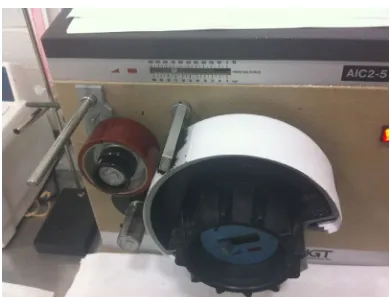
• IGT system: A system consisting of an IGT High Speed Inking Unit, an IGT
AIC2-5T2000 printability tester, an accurate scale, and a spectrophotometer.
• Graduated gage: A solid steel printing plate, the surface of which has a shallow,
wedge shaped indentation on the top surface that uniformly varies in depth from
one end to the other. Scales can be engraved along both sides of this indentation.
The indentation can be filled with ink and the excess can be scraped off with a
• Little Joe Proofer: A motorized, flat-bed printing device with a blanket cylinder
that transfers the ink from the plate to the paper manufactured by Little Joe Indus
-tries. The graduated gage can be used as a printing plate with this device.
• Calibration curve: A curve showing the relationship between absolute IFT and
optical density.
• U-shaped ink qualification (UIQ) curve or U-shaped curve: A curve of the rela
-tionship between absolute IFT and color difference between the color measure
-ment and the aim point specified by ISO 2846.
• Tolerance window/box: A tolerance defined in ISO 2846, consisting of a range of
0 to 4 ∆E color difference and 0.7 to 1.1 µ IFT. An ink will conform to the ISO
2846 specification if its U-shaped curve goes through this box.
• IGT sample: A sample that is produced by the IGT system. Its absolute IFT can be
calculated.
• Little Joe sample: A sample that is produced by the Little Joe Proofer. It incorpo
-rates multiple IFTs, but none of them have a known absolute value.
• ISO 2834 method: A method of sample production by use of the IGT system.
• Little Joe method or alternative method: A method of sample production by use of
the Little Joe Proofer with a graduated gage.
• Ink transfer mechanism: This refers to either the IGT printability tester or the Lit
Chapter 2
Theoretical Basis
To test ink conformance to the ISO 2846 standard, two parameters must be known:
IFT and color difference (∆E). The color of a dry IGT sample is easy to measure, and
color deviation from the standard specifications can be easily calculated as well. How
-ever, to know the IFT of an ink sample, an experiment must be carefully performed so
that IFT can be correctly calculated. The following is the theoretical basis by which one
can obtain the IFT of an ink sample. The assumptions of this method are provided and the
estimation of the calibration curve uncertainty is discussed.
2 1 Calculation of IFT
Conceptually, the direct way to measure IFT is to measure the thickness of a blank
sheet of paper using a caliper, and then measure the combination of the paper and the ink
after printing. The difference between the two readings is theoretically IFT. However,
this method of measuring does not work because the average thickness of an APCO II/
II standard paper is about 100 microns with a certain variance, while the specified maxi
-mum IFT of a standardized ink is 1.1 microns. Even a variance of only 1% in the paper
ISO 2834 defines a laboratory method of producing IGT samples with a “homogene
-ous distribution of ink on a specified substrate” (ISO 2834). The ink layer can be consid
-ered as a cuboid consisting of length, width, and height. The length and width form the
printing area, while the height equals ink film thickness. If the mass density of an ink and
the weight of the ink layer are known, then the volume of the ink layer will be known,
providing the IFT. The following formulas demonstrate how IFT is calculated based on
an IGT print sample.
Equation 1. IFT calculation formula, where W is the weight of the ink layer on an ink sample, ρ is the mass density of the ink, l and w are length and width of the printed area, and IFT is the ink film thickness of
the ink layer.
Equation 1 is the theoretical basis on which the IFT of an ink layer is calculated in
this research.
2 2 Relationship between IFT and Density
As ink film thickness increases, its color will darken proportionally. In other words,
the density of an ink will become greater if its IFT becomes thicker. A calibration curve
of density and IFT can be created from the measurement of the IGT samples. For the
same ink, IFT can be obtained by converting the density using the calibration curve. This
calibration curve method is the second theoretical basis for obtaining IFT. W = ρ•V = ρ•(l•w•IFT)
2 3 A Graduated Gage
A graduated gage is the key for the second method (Little Joe method). A calibration
curve is needed, along with a print sample with multiple known densities, so that all of
the densities can be converted to IFTs by the calibration curve. A graduated gage must be
involved to produce such samples.
As shown in Figure 1, a graduated gage is a thick, solid printing plate. The top sur
-face of the gage was originally ground to be very flat. Then, an indented sur-face was
ground in the centre area of the gage. The width of the indentation is narrower than that
of the block so that there are two bearing surfaces on both sides of the indentation. These
serve as support surfaces for a scraper to draw down the ink so that the ink will only fill
the indentation. The depth of the indentation is 10 microns at the left side, which gradu
-ally decreases to zero at the right end. A scale marks the different depths on each bearing
surface along the gage.
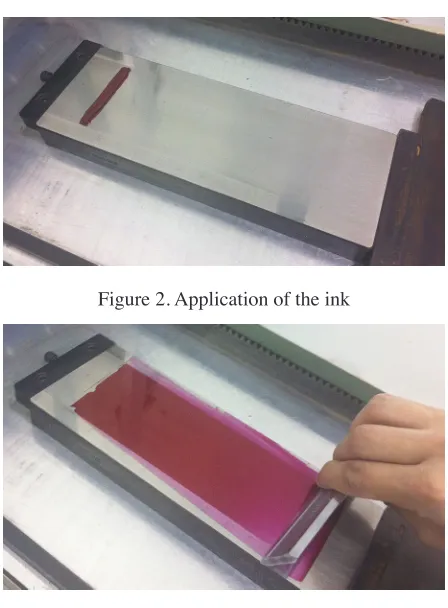
A bead of ink is first applied across the gage as shown in Figure 2. Then, a scraper is
employed to draw the ink from the left end to the right so that the ink is only fed inside
the indentation as shown in Figure 3. Therefore the ink film thickness at left end is 10 mi
-crons and gradually decreases to zero at the other end. When the ink is transferred from
[image:20.612.212.436.219.523.2]the gage to paper, there are multiple ink film thicknesses in a single sample.
Figure 2. Application of the ink
Figure 3. Drawing the ink down with a scraper
2.3.1 Little Joe Proofer
A Little Joe Proofer is on ink transfer device that uses a graduated gage as a plate to
produce a single sample with multiple IFTs. In this report, such a sample is called a Little
Figure 4. Little Joe Proofer with graduated gage
Figure 4 shows a Little Joe Proofer with a graduated gage mounted on it. The ink is
already applied to the indented surface of the gage. There is a piece of standard APCO II/
II paper clipped on the impression plate. When printing is started, the proofer will drive
the rubber blanket cylinder over the gage three times back and forth before it rolls over
[image:21.612.198.450.429.545.2]the paper. This helps to ensure good transfer of the ink.
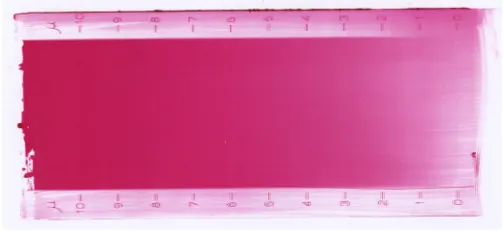
Figure 5. Little Joe sample
Figure 5 shows a magenta Little Joe sample with IFT or density gradually decreasing
from the left end to the right. The scales on the bearing surfaces are printed along with
the ink layer. The numbers in the scale indicate the depth of the indentation of the gage.
IFT printed on the paper. Because all the ink in the indentation cannot be totally trans
-ferred to the paper, the numbers in the scale do not indicate the ink film thickness of the
Little Joe sample. However, a calibration curve can convert any density on this sample
to the corresponding IFT. Therefore, the third theoretical basis for this method is that a
graduated gage can be used with a Little Joe Proofer to produce a Little Joe sample with
multiple unknown IFTs.
2 4 Assumptions of Calibration Curve Uncertainty
When doing an experiment, the repeatability of the system is an important aspect.
Many factors in an experiment can cause errors in the result. For example, when apply
-ing a known ink volume to the distribution roller at the beginn-ing of the experiment, the
actual input may vary from time to time. What’s more, cleaning the rollers may also add
variability. Therefore, it is worthwhile to know the uncertainty or repeatability of the IGT
system, which the directly influences the precision of the calibration curve.
As specified in ISO 2834, a balance with 0.1 mg resolution was used. However, for
objects that weigh more than 99 grams, it measures only to 1 milligram (mg) resolution.
Since the IGT printing disk weighs about 143 grams, it is too heavy to measure to 0.1
mg. However, the fourth digit is significant, because the difference of 1 mg in transferred
weight would cause about 0.15 µ difference in calculated IFT, which is about 38% of the
each input volume was produced in the experiment. Then the transferred weights on each
of the samples at the same input volume were averaged to the fourth digit, and this aver
-aged weight was used to calculate IFT. This calculated IFT represents ink film thickness
at that ink input level.
The density on each sample produced by the same ink input might vary due to experi
-mental error, but the averaged density among these samples can be used with the aver
-aged IFT to build a calibration curve. We assume that IFT is always the same if the same
ink input is applied, while the uncertainty of a calibration curve is dependent on how
density varies at each IFT. Because four digits are needed, IFT can only be calculated
based on the averaged 4-digit transferred weight, not on the 3-digit individual weights.
Therefore, we have to assume that the calculated IFT based on the averaged transferred
weight is the expected IFT at that input volume, and that the variance of the actual input
and mechanism variation cause the density variation from sample to sample. This is the
fourth theoretical basis for this research.
2 5 Estimation of the Calibration Curve Uncertainty
A certain amount of ink input goes through an IGT system and is transformed to a
uniform ink layer on a substrate with a certain IFT and density. However, when multiple
runs of the same production are executed, will the same density and IFT be repeatable. In
each input level conforms to a normal statistical distribution. Therefore, there must be a
large amount of IGT samples produced at each input level for the three colors.
This research found that it takes about 6 minutes to produce one IGT sample. Due to
the scope of this research, it was impractical to produce enough samples (>30) to obtain
a statistical sample with a normal distribution at each input level. Therefore, only 5 to 10
samples at each input level will be produced, and 4 density readings will be taken from
each sample in order to enlarge the sample size at each input level. However, this still
cannot create a large enough sample size to assure a normal data distribution. Therefore,
descriptive statistics will be employed to describe the variation range based on the limited
data available from the experiment. For example, at the input level of 0.05 cc ranging
to 0.09 cc with a 0.01 cc increment, five to ten IGT samples will be produced; densities
can be measured at 4 different spots on each sample, so there will be 20 to 40 densities
at each input level. The averaged IFT will be calculated at each input level, then plotted
against the density in a diagram. A trendline will then be drawn through all the coordi
-nates. The range of the density at each IFT represents the variation range based on the
experimental data, while the trendline represents the average performance. The average
of the five ranges at 5 input levels represents the variation extent for the calibration curve,
Chapter 3
A Review of the Literature in the Field
3 1 A Brief Introduction to ISO 2846
ISO 2846-1 defines the characteristics for standard offset lithographic process inks.
However, this standard is applicable only for sheet-fed, heat-set web, and radiation-curing
process inks. ISO 2846-1 does “not apply to fluorescent inks” (Section 1). Additionally,
this part of ISO 2846 “specifies the colour and transparency characteristics that have to
be met by each ink in a process colour ink set intended for proof and production printing
using offset lithography” (Section 1). However, in this research transparency was not in
discussion. The scope was limited to the color side of the process inks, and the inks used
were CMY sheet-fed process inks.
Inks cannot be tested and defined until they are printed on a reference substrate.
Before it gives the specifications for color, ISO 2846-1 defines various properties of the
reference substrate, with a list of specifications for each parameter in Annex A (norma
-tive), Reference substrate:
This material is the gloss-coated, woodfree paper Phoenix Imperial
When an ink is printed on a piece of APCO II/II paper, then, ideally, the color of the
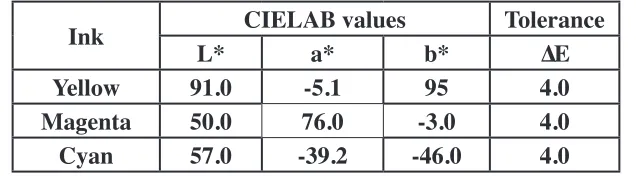
ink film should have exactly the same CIELAB values as specified in ISO 2846-1. These
[image:26.612.166.484.204.294.2]values are listed in Table 1 below.
Table 1. Colorimetric values for 0˚:45˚ a geometry, illuminant D50, 2˚ observer for CMY offset inks
Ink L* CIELAB valuesa* b* Tolerance ∆E
Yellow 91 0 -5 1 95 4 0
Magenta 50 0 76 0 -3 0 4 0
Cyan 57 0 -39 2 -46 0 4 0
In reality, even the best ink cannot match the exact numbers in Table 1. Therefore,
ISO 2846-1 specifies an acceptable color difference tolerance (∆E) based on the L*, a*,
b* values in the table. In other words, when an ink is printed on a piece of APCO II/II
paper, if the color of the ink film has less than 4∆E color difference from the aim points,
then this ink passes ISO 2846-1 colorimetric specification. However, this statement is
only valid if the ink was printed within an ink film thickness range as specified in Table 2.
Table 2. Range of ink film thickness in micrometers
Drying Mechanism Cyan MagentaInk Yellow
Oxidation setting 0 7 to 1 1 0 7 to 1 1 0 7 to 1 1 Radiation curing 0 7 to 1 3 0 7 to 1 3 0 7 to 1 3 Heat-set web 0 7 to 1 3 0 7 to 1 3 0 7 to 1 3
The ink film not only has to have less than a 4∆E color difference from the aim
[image:26.612.147.499.510.600.2]a number of samples, each of known ink film thickness, which adequately represent the
range of ink film thicknesses specified for that ink” (ISO 2846-1, Annex D), The method
of IFT calculation is detailed in Equation 1 of Chapter 2.
After the samples are dry, the color of each sample can be measured colorimetrically.
According to ISO 2846:
This is undertaken with the sample lying on a white backing and measured
using the 2˚ observer and illuminant D50 (ISO 2846-1, Annex D).
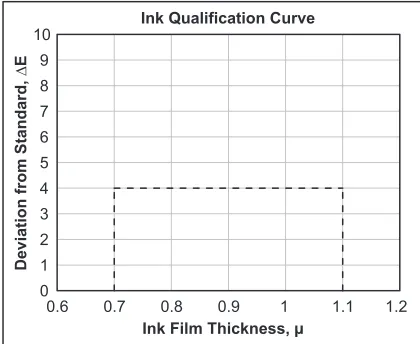
After measuring, the color difference between each sample and the standard aim
points in Table 1 can be calculated and plotted as a function of IFT in the Ink Qualifica
-tion Diagram as shown in Figure 6 below. The x-axis is calculated IFT of each sample
and the y-axis is the color difference between each CIELAB measurement and aim points
in Table 1.
Therefore, the curve must pass through the tolerance window - which is composed of
less than 4∆E color difference and an ink film thickness range of 0.7 to 1.1 µ - to pass the
ISO 2846-1 standard.
0 1 2 3 4 5 6 7 8 9 10
0.6 0.7 0.8 0.9 1 1.1 1.2
Deviation from Standard, ∆E
[image:27.612.218.428.420.592.2]Ink Film Thickness, μ Ink Qualification Curve
Table 2 lists three kinds of offset inks with different specifications of ranges of IFT. In
this paper, CMY sheet-fed inks are used, which belong to the Oxidation setting category.
Therefore, the IFT range specification is 0.7 to 1.1 µ.
3 2 ISO 2834 / IGT Method
ISO 2846 introduces the specifications to define a standard offset ink. ISO 2834
specifies a laboratory method to produce ink samples based on which the ink film thick
-ness of each can be calculated. It recommends three types of printability testers: “round
to flat printing principle (Pruefbau type), round to flat printing principle (IGT) and round
to round printing principle (IGT type)”(ISO 2834-1: 2006).
IGT testers produce test strips for offset, flexo and rotogravure, suitable
for: measuring color, testing the quality of inks, paper, plastic and many
other substrates (Ink World, 2010).
An IGT round to round type printability tester is available in the Printing Applications
Laboratory (PAL) at RIT, and was used in this research. This printability tester (named
AIC2-5T2000) and a High Speed Inking Unit 4 were employed to produce samples (see
Figure 7). The samples produced by this IGT system are called IGT samples, and this
Figure 7. IGT High Speed Inking Unit (left) and IGT printability tester (right)
The way that the IGT system produces samples is as follows:
• First, to apply a known volume of ink to the black rubber distribution roller of the
IGT High Speed Inking Unit, as is shown in Figure 7 (right).
• Next, start the Inking Unit to distribute the ink between the black rubber distribu
-tion roller and the two steel distribu-tion rollers.
• After the ink is uniformly distributed on the rollers, place a printing forme (for
IGT the term is a disc.) in the holder, and make it contact with the black rubber
distribution roller on the top so that the ink can be transferred to the forme.
These samples are then measured as follows:
• After the ink is uniformly transferred to the printing forme, weigh the forme with
the ink using a balance with an accuracy of at least 0.1 mg.
• Write down the weight reading and then print the ink onto a strip of APCO II/II
• Then, weigh the printing forme with the residual ink on the same balance, and
record the reading.
The difference between the two readings is the weight of the ink that is transferred
to the paper. Mass density can be determined by weighing a known volume of ink and
then dividing the weight by the volume. Therefore, ink film thickness can be calculated
according to Equation 1. In order to cover the IFT range from 0.7 to 1.1 µ, the ink input
volume that is applied on the black rubber distribution roller should change to produce
multiple IFTs.
After all the IGT samples are produced, two graphs can be drawn for each sample.
The first graph is the ink qualification diagram. The axes are IFT and color difference
(IFT, ∆E). The compliance decision will be made based on the curve. This is called ISO
2834 method. The axes of the second graph are IFT and optical density (IFT, Density).
A trendline through these datapoints represents what is called the calibration curve. This
curve is used for the Little Joe method, which also uses a Little Joe Proofer sample to
Chapter 4
Research Questions
4 1 Preliminary Research Question
IGT samples have a very uniform ink layer. Density is a function of IFT. A certain
IFT will yield a certain density and a certain set of colorimetric values. For example, an
IGT sample with an IFT of 0.7 µ might have a density of 1.3 and a certain color noted as
CIELAB 1. When the same ink is printed on the same reference substrate by a Little Joe
Proofer, then it is assumed that a density of 1.3 at a certain location on a Little Joe sample
will also have an IFT of 0.7 µ.
Therefore, the question is: will this 1.3 density on a Little Joe sample yield the same
color of CIELAB 1? In other words, the same density on both IGT and Little Joe samples
will yield the same IFT, but will they also yield the same color on both samples? Before
answering this question, the following research questions must be answered.
4 2 Secondary Research Questions
4.2.1 Are the density and color of the IGT samples at the same ink input volume
4.2.2 What is the uncertainty of density at the same IFT? (Or, what is the uncertainty
of the calibration curve for each color?)
4.2.3 Is the color repeatable at the same density on the Little Joe samples?
4.2.4 Does every tested ink pass the ISO 2846-1 specification?
4 3 Primary Research Question
If density values and IFT correlate well between the IGT and Little Joe methods, will
both either reject or accept a given ink sample? In other words, do both result in the same
Chapter 5
Methodology
5 1 Instrumentation and Equipment
a. IGT system:
• An IGT High Speed Inking Unit
• An IGT AIC2-5T2000 printability tester
• A pipette
• A printing forme
• An Mettler AG204 DeltaRange balance)
b. A Little Joe Proofer (H model), a graduated grind gage, and a steel scraper.
c. An X-Rite 938 spectrodensitometer and an X-Rite ilPro spectrophotometer.
5 2 Standard Laboratory Conditions and Preparation for the Experiment
The experiment for this research was conducted in the Printing Applications Labora
-tory (PAL) at Rochester Institute of Technology (RIT). The environmental temperature
of the experiment was 24˚C ±1˚C at a relative humidity of 50% ±5%. ISO 2834 does not
specify the humidity of the experimental environment, but humidity control is recom
The steps to prepare the experiment were as follows: Condition the papers, inks and
equipment in this standard atmosphere for at least 6 hours. Cut the APCO II/II paper into
55x340 mm strips. Set IGT printing force at 625 N and speed at 0.2 m/s.
5 3 Production of IGT/ISO 2834 Samples
Cleaning needs to be performed before each print, including the first print. This is to
ascertain that the same amount of residual cleaning fluid is present on the working sur
-face for all samples. Once this is complete, all the sample production should be executed
by following these steps:
a. Mount a test strip of APCO II/II Paper on the sector of the IGT AIC2-5T2000 print
[image:34.612.231.419.462.589.2]-ability tester (shown in Figure 8). Turn the sector to the print position.
Figure 8. The sector (larger cylinder on the right) and printing discs (on the left)
b. Meter out 0.05 cc ink with a pipette onto the black rubber distribution roller of IGT
Figure 9. Black rubber distribution roller with the metered-out ink
c. Start the inking unit to distribute the ink for 10 seconds (see Figure 10).
Figure 10. The ink is distributed evenly between the rubber and steel distribution rollers.
d. During the 10-second distribution time, place the clean printing disc on a shaft of
the inking unit.
e. After 10 seconds (when the ink unit beeps), lower down the shaft with the disc to
cause the printing disc to touch the black rubber roller so that the uniformly distributed
ink on the distribution roller can be transferred to the printing disc (see Figure 11). This
[image:35.612.223.419.284.430.2]Figure 11. The ink is uniformly transferred to the printing disc
f. After the ink is transferred to the printing disc, remove the disc from the shaft, and
put the disc into the AG204 DeltaRange balance. When the reading is stable, record the
weight of the disc with the ink, denoted as W1 (see Figure 12).
Figure 12. The weight of the disc with the ink before printing
g. Remove the disc from the balance and place it on the top shaft of the printability
[image:36.612.233.415.354.491.2]Figure 13. The disc is on the shaft without touching the paper.
h. Turn the left-hand-side rocker to move the printing disc to the printing position
(against the strip on the sector). Press and hold one of the side buttons to start the motor.
i. Press the other side button to print. Release both buttons after the sector stops.
j. Turn the side rocker back to separate the printing disc from the strip, and remove
the disc.
k. Place the disc with the residual ink on the balance and record the weight, denoted
as W2. The difference between W1 and W2 is the weight of the ink that was transferred
to the paper.
l. Clean the disc by use of a solvent-wetted rag and then clean any residuals with a
dry rag. Next, clean the black rubber roller and the two distribution rollers in the same
manner.
m. Wait three and a half minutes before the next run. During the break, mount a new
strip on the sector of the IGT printability tester and turn the sector to the print position.
n. Repeat the steps from (b) through to (m) to produce four replicates with the same
o. Change the ink volume at step (b) to 0.06 cc, and repeat steps (c) through (n).
p. Change the ink volume at step (b) to 0.07 cc, and repeat steps (c) through (n).
q. Change the ink volume at step (b) to 0.08 cc, and repeat steps (c) through (n).
r. Change the ink volume at step (b) to 0.09 cc, and repeat steps (c) through (n).
5 4 IFT Calculation
As the IGT system is designed to produce homogeneous ink distribution on APCO II/
II paper, the shape of ink that is laid down on the paper can be treated as a cuboid. It is
composed of the length, which is print length; the width, which is the width of the print
disc; and the height, which is ink film thickness. The product of the three parameters is
the volume of the ink that is transferred onto the paper. We know the weight of the ink
that is transferred to the paper, which is W1-W2. The transferred volume can be worked
out as long as the mass density of the testing ink is available. When the volume is given,
then the ink film thickness will be able to be calculated according to Equation 1.
5.4.1 Ink Mass Density Calculation
a. Feed the pipette compactly with the testing ink.
b. Place a 3x3 glass plate on the AG204 DeltaRange balance and zero the balance.
c. Meter out 2 cc volume of the ink with a pipette to the glass board. After the balance
is stable, record the weight of the 2 cc ink, denoted as W.
5.4.2 Ink Film Thickness Calculation
a. Calculate the weight of the ink transferred: ∆W= (W1-W2).
b. Ink volume transferred to the strip is calculated as: ∆W/ρ
c. Measure the length and width of each ink sample. The printing area A is equal to
L*l. In the experiment, the print area is 66.
d. Calculate IFT using Equation 1.
5 5 Density and CIELAB Measurements of IGT Samples
After at least 24 hours drying time, various optical measurements can be taken as fol
-lows:
• Measure CIELAB and densities at 4 different spots from top to bottom per sample
with an X-Rite 938 spectrodensitometer.
• Apply the same measurement procedure to each IGT sample.
5 6 Uniformity of IGT Samples
Cyan will be used as an example. The other two colors will adopt the same procedure.
Uniformity or uncertainty in color and in density will be stated separately.
5.6.1 Uniformity in Color
a. For all cyan samples with an input-IFT level of 0.05cc, average all L*, a* and b*
b. Calculate color difference (∆E) between the averaged CIELAB values and each
CIELAB reading of each sample at this input level.
c. Repeat (a) and (b) for the rest of the levels.
d. Generate a Cumulative Relative Frequency (CRF) curve of ∆E.
5.6.2 Uniformity in Density
a. At each input/IFT level of 0.05cc for cyan ink IGT samples, average all densities to
form an averaged density.
b. Subtract averaged density of each sample from each density reading of this input
or IFT level. Take the absolute value of the density difference, ∆D, to avoid negative
values.
c. Repeat (a) and (b) for the rest of the levels.
d. Generate a Cumulative Relative Frequency (CRF) curve of ∆D.
5 7 Generation of CMY Calibration Curves with Uncertainties
a. Average all the transferred ink weight at an input level of 0.05 cc for cyan.
b. Use Equation 1 to calculate IFT using this averaged weight. This calculated IFT
represents the ink film thickness that is yielded by 0.05 cc input of ink, so it is called
level IFT.
c. Create coordinates with each individual density and the level IFT at 0.05 cc input
e. Plot all coordinates in a quadrant diagram for cyan.
f. Draw a trendline through all the plots, which is the cyan calibration curve.
g. Generate magenta and yellow calibration curves by repeating steps (a) to (f).
h. The difference between the maximum and minimum densities at a certain input
level indicates the density variation range at that input level. Average this difference
at each input level to understand the variation range of the calibration curve for each
color based on the limited number of data in this research.
5 8 Verifying Inks with the ISO 2834 Method
Each sample has four readings of CIELAB and densities, or, in other words, four co
-ordinates of (CIELAB, Density). Color differences between each CIELAB and standard
aim specification can be calculated, and each corresponding density can be converted to
IFT by the calibration curve. Therefore each sample has four ∆E and four IFTs. In other
words, each individual sample can provide four coordinates of (IFT, ∆E), and a U-shaped
Ink Qualification Curve (UIQ) can be drawn with coordinates from all of the samples.
The steps are as follows for cyan:
a. Calculate the color difference between each CIELAB and standard specification for
cyan.
b. Convert the density to IFT using the cyan calibration curve.
c. Create coordinates of (IFT, ∆E).
e. Repeat steps (a) to (d) for magenta and yellow.
5 9 Procedure for Little Joe Sample Production
A Little Joe Proofer was set up in the same lab environment as the IGT system.
Cleaning was also performed before each print, including the first print. This is to ascer
-tain that the same amount of residual cleaning fluid is present on the working surface for
all samples. Once this is complete, all the sample production should be executed by fol
-lowing these steps:
a. Clean the gage first with a solvent-wetted rag and then with a dry rag.
b. Clean the blanket cylinder with a solvent-wetted rag and then with a dry rag.
c. Clean the scraper with a solvent-wetted rag and then with a dry rag.
d. Take a three-minute break to let the system dry completely.
e. During the break, clip a 3x12 inch ACPO II paper with the spring clamp on the
impression plate (see Figure 4).
f. Meter out 2 cc ink by a pipette and apply the cyan ink along the left end of the gage
(see Figure 2).
g. Use a scraper to squeeze off the ink along the surface of the printing plate from left
to right. The ink might not be completely uniformly distributed along the gage due to
some blanket scratches within the ink film. Therefore, to fully cover the indented area,
use the scraper to draw down for more times until the ink film is uniformly distributed
h. Wipe off the redundant ink at the right end of the printing plate. (The scraper will
draw this redundant ink to the right end of the plate, and it takes a long time to dry.)
i. Press both green buttons on the operation station simultaneously to drive the blan
-ket cylinder to start printing.
j. Remove the sample the impression plate, and press both green buttons again to
drive the blanket cylinder back to the home position.
k. Clean the gage, blanket cylinder, and scraper by repeating steps (a) through (c).
l. Repeat another two more multi-IFT samples by repeating steps (d) through (k).
m. Repeat steps (a) to (l) for the magenta and yellow inks.
5 10 Color Repeatability of the Little Joe Samples
A CMY calibration curve can convert a density from a Little Joe sample to an IFT.
However, before doing this, it is very important to determine whether the same density
will yield the same color among Little Joe samples. In other words, will the color will
be the same at the same converted IFT? To answer this question, the colors on five dif
-ferent density spots on each Little Joe sample will be studied. As stated in Section 5.11,
calibration curves will be used to convert density to IFT. In order to avoid any inherent
calculation error that might happen during the conversion, five IGT level densities will be
chosen so that the converted IFT is exactly equal to what was calculated in Section 5.4.
As in previous sections, cyan will be used as an example in the following steps:
b. Measure a cyan Little Joe sample and locate the density that is equal to the first
level density of the cyan IGT samples (the density at the first input level, which was 0.05
cc).
c. Record the CIELAB values at this density.
d. Find a second spot on the same Little Joe sample where the density is equal to the
first level density of the cyan IGT samples.
e. Repeat steps (a) to (d) on another two more cyan Little Joe samples. This will result
in six CIELAB values that come from three different cyan Little Joe samples at the first
density level, and the IFT at these spots are all equal to the first calculated IFT of the cyan
IGT samples at 0.05 cc input.
f. Repeat steps (a) to (e) for the rest of the four density levels.
g. Average the CIELAB values at each density level.
h. Calculate color difference—∆E—between the averaged CIELAB and each one of
the six readings at each density level.
i. Generate a Cumulative Relative Frequency (CRF) curve of ∆E.
5.11 Ink Verification by Use of the Calibration Curve and Little Joe Samples
In Section 5.10, all of the densities on the Little Joe samples are equal to the level
densities of each color. Therefore, the IFTs are equal to those of the IGT samples. To
verify the inks, follow these steps:
b. Calculate color difference - ∆E - between the ISO 2846 specified cyan aim point
and this averaged CIELAB.
c. Build coordinates of (IFT, ∆E).
d. Repeat step (a) to (c) for the rest of the four IFTs.
e. Now, we have 5 coordinates of (IFT, ∆E), plot the five coordinates of (IFT, ∆E) in
the ink qualification diagram.
f. Connect the plots to form a smooth Cyan Ink Qualification Curve.
g. Repeat steps (a) to (f) to form Ink Qualification Curves for magenta and yellow.
5 12 Color Differences between IGT Color and Little Joe Color
a. At the first IFT level, calculate the color difference between the IGT averaged
CIELAB and the Little Joe averaged CIELAB for cyan.
b. Repeat for the remaining IFT levels.
c. Repeat steps (a) to (b) for magenta and yellow.
At this point, the preliminary research questions can be answered. Depending on the
Chapter 6
Results
6 1 Uncertainty of the IGT System
Due to the methodology used with the IGT system, CIELAB and density may vary at
the nominally same ink input volume. It is very important to determine the repeatability
of the IGT system or, what its uncertainty is.
6.1.1 Uniformity in Color
The three curves in Figure 14 show how uniform the IGT samples are in terms of
colorimetric data. Ideally, every spot on any IGT sample at the same input level should
have a identical CIELAB value. In reality, each reading will deviate from the averaged
CIELAB. For cyan IGT samples, 90% of the readings had less than 0.3 ∆E deviation
from the averaged CIELAB across the five input levels. For magenta and yellow, the
deviations were 0.25 ∆E and 0.38 ∆E, respectively. Therefore, the IGT system is capable
of producing a strip of uniform color.
Figure 14. Cyan, Magenta, and Yellow CRF Curves of Variation (∆E) within four Readings
6.1.2 Uniformity in Density
The three curves in Figure 15 show how uniform each IGT sample is in terms of
density. Ideally, every spot on IGT samples of the same input level should have identical
density. In practice, each reading will deviate more or less from the averaged density. For
cyan calibrated samples, 90%of the readings had a deviation of less than 0.007 ∆D from
0.3 0.0 0.1 0.2 0.3 0.4 0.5 0.6 0.7 0.8 0.9 1.0
0.0 0.1 0.2 0.3 0.4 0.5 0.6 0.7 0.8 0.9 1.0
Cumulative Relative Frequency (CRF)
∆E
Cyan CRF Curve of Variation (∆E) within 4 Readings
0.25 0.0 0.1 0.2 0.3 0.4 0.5 0.6 0.7 0.8 0.9 1.0
0.0 0.1 0.2 0.3 0.4 0.5 0.6 0.7 0.8 0.9 1.0
Cumulative Relative Frequency (CRF)
∆E
Magenta CRF Curve of Variation (∆E) within 4 Readings
0.38 0.0 0.1 0.2 0.3 0.4 0.5 0.6 0.7 0.8 0.9 1.0
0.0 0.1 0.2 0.3 0.4 0.5 0.6 0.7 0.8 0.9 1.0
Cumulative Relative Frequency (CRF)
∆E
the averaged density across five input levels. For magenta and yellow, the deviations from
the averaged density were 0.011 ∆D and 0.005 ∆D, respectively.
[image:48.612.112.540.146.518.2]
Figure 15. Cyan, Magenta and Yellow CRF Curves of Variation (∆D) within four Readings
6 2 CMY Calibration Curves
The resulting CMY Calibration Curves are shown in Figure 16 (Cyan), Figure 17
(Magenta), and Figure 18 (Yellow).
0.011 0.0 0.1 0.2 0.3 0.4 0.5 0.6 0.7 0.8 0.9 1.0
0.00 0.01 0.02 0.03
Cumulative Relative Frequence (CRF)
∆D
Cyan CRF Curve of Variation (∆D) within 4 Readings
0.007 0.0 0.1 0.2 0.3 0.4 0.5 0.6 0.7 0.8 0.9 1.0
0.00 0.01 0.02 0.03
Cumulative Relative Frequence (CRF)
∆D
Magenta CRF Curve of Variation (∆D) within 4 Readings
0.005 0.0 0.1 0.2 0.3 0.4 0.5 0.6 0.7 0.8 0.9 1.0
0 0.01 0.02 0.03
Cumulative Relative Frequence (CRF)
∆D
Figure 16. Cyan Calibration Curve
IFT was chosen to be the dependent variable so that calculating IFT with Density will
be easier. As stated previously, the density uncertainty at each IFT level cannot be calcu
-lated based on the standard deviation of the density because there are only five to twelve
samples produced at each IFT level. Threfore, the sample size was too small to represent
a normal distribution. For the purpose of this thesis, producing hundreds of IGT sample at
every input level was not feasible. Therefore, inferential statistics cannot be employed to
y = 0.778x2 - 1.467x + 1.217 R2 = 0.978
0.0 0.2 0.4 0.6 0.8 1.0 1.2
1.0 1.1 1.2 1.3 1.4 1.5 1.6 1.7 1.8
Density
Cyan Calibration Curve
Ink Film Thickness (µ)
y = 0.583x2 - 0.746x + 0.660 R2 = 0.984
0.0 0.2 0.4 0.6 0.8 1.0 1.2
1.0 1.1 1.2 1.3 1.4 1.5 1.6 1.7 1.8
Ink Film Thickness (µ)
Density
Magenta Calibration Curve
Figure 18. Yellow Calibration Curve
y = 0.021x2 + 1.740x - 1.106 R2 = 0.991
0 0.2 0.4 0.6 0.8 1 1.2
0.8 0.9 1 1.1 1.2 1.3
Density
Yellow Calibration Curve
Ink Film Thickness (µ)
quantify the density uncertainty at each level. Instead, descriptive statistics can generally
demonstrate how densities are varied at each IFT level. As shown in Table 3, there were
six Cyan IGT samples at 0.05 cc input (or at the level of 0.558 μ), and there were 24 den
-sities (four readings per each sample). The difference between maximum and minimum
densities at this level is 0.09. The average density range where the calibration curve var
-ies is 0.078. The values for magenta and yellow are 0.048 and 0.030, respectively. These
density variation ranges will cause IFT variation ranges of 0.056 μ, 0.043 μ, and 0.054 μ
for each color (see the Appendix). Therefore, each final UIQ curve will shift to the right
or to the left by the amount of ±0.028 μ, ±0.022 μ, and ±0.027 μ from its average perfor
-mance.
Table 3. Uncertainty of density at each input level for CMY offset inks
6.3 Ink Verification by the ISO 2834 Method
Figure 19 shows the result of offset ink verification by employing the ISO 2834
method in terms of U-Shaped Ink Qualification (UIQ) Curves. All the curves are colored
IFT(µ) 0.558 0.647 0.726 0.814 0.921 Averaged Density 1.168 1.324 1.454 1.554 1.645
Number of Readings 24 44 40 24 20
Std of Density 0.028 0.028 0.019 0.015 0.020 Range 0.090 0.100 0.090 0.049 0.068 IFT(µ) 0.607 0.708 0.819 0.888 1.031 Averaged Density 1.259 1.354 1.505 1.589 1.688
Number of Readings 44 36 20 28 20
Std of Density 0.016 0.018 0.008 0.009 0.006 Range 0.071 0.066 0.028 0.045 0.028
IFT(µ) 0.466 0.582 0.727 0.849 0.914 1.018 Averaged Density 0.894 0.962 1.035 1.107 1.149 1.198
Number of Readings 20 24 20 24 28 20
Std of Density 0.011 0.006 0.011 0.008 0.009 0.008 Range 0.037 0.024 0.035 0.026 0.032 0.028 Yellow
Cyan
Magenta
in cyan, magenta and yellow to respectively represent cyan, magenta and yellow UIQ
Curves.
[image:51.612.108.543.145.424.2]
Figure 19. CMY U-Shaped Ink Qualification (UIQ) Curves
According to the curves in Figure 19, all the cyan, magenta and yellow offset inks
used in this research passed the ISO 2846 standard. The amount of the IFT shift calcu
-lated in Section 6.2 will not move the curves out of the tolerance window.
6 4 Color Repeatability of Little Joe Multi-IFT Samples
This section is to answer the following research question: Does the same density of
CMY offset inks printed by Little Joe repeatedly yield the same CIELAB values? There
are two readings of CIELAB on each of the three Little Joe Multi-IFT samples. The cor
-responding densities of the CIELAB values should be exactly the same to the third deci
-0 2 4 6 8 10 12 14
0.4 0.5 0.6 0.7 0.8 0.9 1 1.1 1.2
Deviation from Standard, ∆E
Ink FIlm Thickness (μ)
Cyan U-Shape Ink Qualification Curve
0 2 4 6 8 10 12 14
0.4 0.6 0.8 1 1.2
Deviation from Standard, ∆E
Magenta U-Shape Ink Qualification Curve
Ink FIlm Thickness (μ)
0 2 4 6 8 10 12 14
0.4 0.5 0.6 0.7 0.8 0.9 1 1.1 1.2
Deviation from Standard, ∆E
Yellow U-Shape Ink Qualification Curve
mal. To determine this, the average of the six CIELAB readings was calculated, along
with the ∆E between the average and each of the six readings at each density level. The
curves in Figure 20 show the results of the repeatability of CIELAB at the same density
on the Little Joe Multi-IFT samples.
[image:52.612.114.541.205.576.2]
Figure 20. CMY CRF curve of ∆E between averaged CIELAB and each of six CIELAB values at the same density of the Little Joe Multi-IFT samples
When a Little Joe Proofer produces CMY offset inks used in this research, 90% of
the measurements will have less than 0.36∆E deviation from the averaged CIELAB at the
0.0 0.1 0.2 0.3 0.4 0.5 0.6 0.7 0.8 0.9 1.0
Cumulative Relative Frequence (CRF)
∆E
Cyan CRF Curve of ∆E from average 0.36
0.0 0.1 0.2 0.3 0.4 0.5 0.6 0.7 0.8 0.9 1.0
0.29 0.0 0.1 0.2 0.3 0.4 0.5 0.6 0.7 0.8 0.9 1.0
Cumulative Relative Frequence (CRF)
∆E
Magenta CRF Curve of ∆E from average
0.0 0.1 0.2 0.3 0.4 0.5 0.6 0.7 0.8 0.9 1.0
0.0 0.1 0.2 0.3 0.4 0.5 0.6 0.7 0.8 0.9 1.0
Cumulative Relative Frequence (CRF)
∆E
Yellow CRF Curve of ∆E from average
0.21
yellow. The CIELAB values are highly repeatable at the same density. Therefore, either
the averaged CIELAB or individual CIELAB at each density level can represent the value
that the corresponding density should have.
6.5 Ink Verification by Use of the Calibration Curve and Little Joe Samples
To verify the offset ink, all densities should be converted to IFT through the CMY
calibration curves, and the ∆E should be calculated between the corresponding CIELAB
values and standard. Table 4 shows the results of the converted IFT and corresponding
[image:53.612.108.540.352.569.2]∆E for each color.
Table 4. CMY converted IFT and ∆E from the standard
Based on the data in Table 4, the UIQ Curves of the CMY multi-IFT samples are
shown in Figure 21. The yellow UIQ curve is almost the same as that in Figure 19, but
both the cyan and magenta UIQ curves shifted upwards by a miniscule amount.
L* a* b* Density Converted IFT ∆E from standard
59.73 -35.88 -44.75 1.168 0.542 4.5
56.85 -36.39 -47.81 1.324 0.651 3.7
54.75 -36.47 -49.95 1.454 0.748 5.6
53.33 -36.37 -51.35 1.554 0.826 7.0
51.93 -35.73 -52.69 1.645 0.901 9.1
51.25 72.70 -3.20 1.259 0.611 3.5
49.90 74.50 -1.31 1.354 0.691 2.3
48.09 76.62 2.67 1.505 0.830 6.0
47.17 77.40 4.77 1.589 0.912 8.4
46.25 78.13 7.29 1.688 1.014 11.2
91.43 -6.19 87.66 0.893 0.462 7.4
91.21 -5.95 92.41 0.962 0.587 2.7
90.96 -5.52 97.22 1.036 0.720 2.3
90.78 -5.08 101.5 1.107 0.848 6.5
90.65 -4.84 104.0 1.149 0.923 9.0
90.48 -4.43 106.3 1.198 1.012 11.4
Cyan
Magenta
Figure 21. UIQ Curves of CMY Little Joe multi-IFT samples
6 6 Differences Between IGT and Little Joe Multi-IFT Samples
Table 5 shows the difference between IGT and Little Joe multi-IFT samples in ∆L*,
∆a* and ∆b* at the same density of the different levels. IGT values are used as a refer
-ence for subtraction from the Little Joe values.
Ink Film Thickness (μ) 0 2 4 6 8 10
0.5 0.6 0.7 0.8 0.9 1 1.1 1.2
Deviation from Standard, ∆E
Cyan U Shape Curve (Little Joe)
Ink Film Thickness (μ) 0 2 4 6 8 10 12
0.4 0.5 0.6 0.7 0.8 0.9 1 1.1 1.2
Deviation from Standard, ∆E
Magenta U shape Cuve(Little Joe)
Ink Film Thickness (μ) 0 2 4 6 8 10 12
0.4 0.5 0.6 0.7 0.8 0.9 1 1.1 1.2
Deviation from Standard, ∆E
Table 5. Comparison of IGT and Little Joe multi-IFT samples in ∆L*, ∆a*, and ∆b*
Table 5 shows that at the same density, color produced by the IGT method can differ
from that produced by the Little Joe method by about 3∆E for cyan, 4∆E for magenta,
and 1∆E for yellow. Yellow has the least color shift compared to the other two colors.
Figure 22 shows the spectral curves for the CMY IGT and Little Joe samples. The
two curves in each graph have exactly the same density. In Figure 22, the Status T curves,
(colored as red, green and blue) are used to integrate the spectral reflectances to corre
-sponding densities. In the region within the Status T spectral curve, the IGT and Little
Joe curves cross. This is necessary so that the integral densities of IGT and Little Joe
are identical. Within other regions, the IGT curves for CMY are always a little higher
than the Little Joe curves. Therefore, the IGT samples are more saturated than the Little
Joe multi-IFT samples at the same density. This agrees with all the positive ∆C* values
shown in Table 5. This also agrees with visual perception results as shown in the sample
pairs of Figure 23. Both samples have the same density, but not the same saturation.
∆L ∆a* ∆b* ∆C* ∆E Density Level
1.4 -2.1 0.8 0.750 2.700 1.2
1.9 -2.7 1 0.900 3.400 1.3
1.9 -2.6 1 0.830 3.400 1.5
1.9 -2.6 0.9 0.830 3.300 1.6
1.9 -2.8 1 0.780 3.500 1.6
0.8 1.4 -3.5 1.620 3.800 1.3
0.7 1.2 -3.7 1.320 3.900 1.4
0.8 1.1 -4.1 1.040 4.300 1.5
0.8 1.1 -3.6 1.000 3.900 1.6
0.8 1.2 -3.4 0.940 3.700 1.7
0.2 -0.6 0.9 0.980 1.200 0.9
0.1 -0.4 0.7 0.750 0.800 1.0
0.2 -0.7 0.7 0.720 1.000 1.0
0.1 -0.7 0.8 0.820 1.100 1.1
0.2 -0.5 0.7 0.690 0.900 1.1
0.2 -0.5 0.9 0.920 1.100 1.2
Cyan
Yellow Color
Figure 22. Spectral curves of CMY IGT (in black) and Little Joe multi-IFT (in cyan) samples 0.001 0.01 0.1 1
380 430 480 530 580 630 680 730
Reflectance
Wavelength (µ)
Yellow Spectral Reflectance (IGT vs. Little Joe)
IGT Ljoe Status T BLUE 0.001
0.01 0.1 1
380 430 480 530 580 630 680 730
Reflectance
Wavelength (µ)
Cyan Spectral Reflectance (IGT vs. Little Joe)
IGT2 Ljoe2 Status T RED 0.001 0.01 0.1 1
380 430 480 530 580 630 680 730
Reflectance
Wavelength (µ)
Magenta Spectral Reflectance (IGT vs. Little Joe)
IGT2 Ljoe2 Status T
[image:57.612.208.441.99.451.2]
Figure 23. Micro snap shots of C, M, and Y IGT samples (left) and Little Joe multi-IFT samples (right) at the same Status T density
6 7 Summary of the Results
6.7.1 Color Uncertainty of IGT Samples
The ∆E color difference between averaged CIELAB values and each of the four in
-dividual readings on an IGT sample is calculated. The same calculation was repeated for
difference of less than 0.3∆E from the corresponding averaged CIELAB values for cyan,
with difference of 0.25∆E for magenta and 0.38∆E for yellow (see Figure 14).
6.7.2 Density Uncertainty of IGT Samples
The density difference ∆D between averaged density and each of the four individual
readings on an IGT sample was calculated. The same calculation was repeated for all of
the IGT samples. Figure 15 shows that 90% of all individual densities having less than
0.011∆D from the corresponding averaged densities for cyan, with difference of less than
0.007∆D for magenta and 0.005∆D for yellow.
6.7.3 Uncertainties of CMY Calibration Curves
The averaged density range in which each color’s calibration curve varies for C, M,
and Y, is 0.078. 0.048, and 0.030, respectively. These density variation ranges will cause
IFT variation ranges of 0.056 μ, 0.043 μ and 0.054 μ for each color (see the Appendix).
Therefore, each final U-Shaped Ink Qualification Curve will shift to the right or the left
by ±0.028 μ, ±0.022 μ, and ±0.027 μ from its average performance (see Section 2, Chap
-ter 7).
6.7.4 Repeatability of CIELAB Values on Little Joe Samples
At a given density, 90% of CIELAB measurements had a color difference of less than
0.36∆E from the averaged CIELAB values for cyan, with difference of less than 0.29∆E
6.7.5 Comparison of Ink Verification Methods
Using the ISO 2834 method, all of the CMY offset inks in this research passed the
ISO 2846 standard. When calibration curves and the Little Joe samples were used to
verify the CMY inks, cyan did not pass the ISO 2846 standard. Although magenta and
yellow pass the standard, their U-Shaped Ink Qualification Curves are different from the
positions that result from the ISO 2834 method (see Figures 19 and 21).
6.7.6 Color Comparison Between IGT and Little Joe Samples
At the same density, an IGT patch and a Little Joe printed patch can still have differ
-ent colorimetric values, with differences of up to 3.5∆E for cyan, 4.3∆E for mag-enta, and
1.2∆E for yellow. (see Table 5).
In terms of visual perception between the samples produced by both methods, the
color IGT samples were always more saturated than the Little Joe sample. The IGT sam
-ples were also glossier than the Little Joe sam-ples. Additionally, the Little Joe sam-ples