RIT Scholar Works
Theses
Thesis/Dissertation Collections
5-18-1990
Improving quality consistency and productivity of
color separators utilizing the Dupont image
manager
Enrique A. Arce B.
Follow this and additional works at:
http://scholarworks.rit.edu/theses
This Thesis is brought to you for free and open access by the Thesis/Dissertation Collections at RIT Scholar Works. It has been accepted for inclusion
in Theses by an authorized administrator of RIT Scholar Works. For more information, please contact
ritscholarworks@rit.edu.
Recommended Citation
OF
COLOR SEPARATIONS
UTILIZING THE
DUPONT
IMAGE
MANAGER
by
Enrique
A. Arce
B.
A
thesis
submittedin
partialfulfillment
ofthe
requirementsfor
the
degree
ofMaster
ofScience in
theSchool
ofPrinting
Management
andScience in
the
College
ofGraphic
Arts
andPhotography
at theRochester Institute
ofTechnology.
School of printing Management and Sciences
Rochester Institute of Technology
Rochester, New York
U.S.A.
CERTIFICATE OF APPROVAL
MASTER'S THESIS
This is to certify that the Master's Thesis of
Enrique A. Arce B.
With major in Printing Technology
has
been approved
by the Thesis Committee as satisfactory for the thesis requirement for
the Master of Science degree at the convocation of
May 18, 1990.
Thesis Committee:
Miles
SOllthworth
Thesis Advisor
Joseph L Noga
Graduate Program Coordinator
Utilizing
theDu Pont Image Manager
I,
Enrique A. Arce
B,
prefertobe
contacted eachtimea requestfor
reproductionis
made.I
canbe
reached atthefollowing
address:Edison 4125
Santiago
Chile
A
Cecilia
y
Natalia.
.....mi
hermana
ehija.
(To Cecilia
andNatalia...
I
wouldlike
toexpressmy
thankfulnessto
allthose
whoin
oneway
oranotherhelped
meto get
through
ofRIT
andthis
research.To
theinstructors,
my classmates,
scanneroperators,
judges,
andthoseI
am notmentioning, thank
you.I
would alsolike
to
thankMiles
Southworth
for his
help,
notonly
in
this thesis wherehe
was
the
majoradvisor,
but
alsoin
thelessons
he
gavetomein
theGraphic
Arts field.
A
special mention alsofor
Charles Layne for
giving
invaluable
help
notonly in
theresearchand
statistics,
but
alsoediting this
thesis tomakemy English
a readable matter.I
also wantto thankvery
muchtomy
family,
my
wifeLizabeth,
my
daughter
Natalia,
my
parents
Enrique
andOrlanda,
andmy
sisterCecilia,
for
theirlove
and encouragementto continuewhenbeing
far from
home
was almostimpossible
togetthrough,
andfor
helping
metofinish
thisdegree.
Finally
I
wantto
expressmy
gratitudeto thepeoplethatconformCOCHRANE
S.A.,
thePage
ABSTRACT
1
CHAPTER I
-INTRODUCTION
3
Endnotes
for
chapter one6
CHAPTER II
-THEORETICAL
BASIS
FOR
THE STUDY
7
Tone
reproduction7
Gray
balance
9
Color
correction9
Unsharp
masking
9
Endnotes for
chaptertwo
11
CHAPTER
III
-LITERATURE
REVIEW
12
Presenters
13
Presetter/previewers
14
The Du Pont
Image Manager
16
Endnotes
for
chapterthree18
CHAPTER
IV
-STATEMENT OF
THE PROBLEM
19
Hypotheses
20
CHAPTER V
-METHODOLOGY
21
Experimental
design
21
Subjective
evaluation23
Equipment
or resources24
Limitations
ofthestudy
25
Endnotes
for
chapterfive
26
CHAPTER VI
-THE
RESULTS
27
Hypothesis
1
27
Hypothesis
2
28
Judges
preferencefor
quality
29
Summary
32
Hypothesis 1
33
Hypothesis 2
33
Separation
preference33
Implications
34
Recommendations
for further
investigation
34
BIBLIOGRAPHY
35
APPENDIX
A
39
APPENDIX
B
43
APPENDIX C
48
APPENDIX D
50
APPENDIX E
57
APPENDIX
F
63
Page
Table
1
:Density
for
the
processinks
9
Table
2:
Productivity
improvement
causedby
theuse oftheDu Pont
Image
Manager
asthemethodfor
thescannerset-up,
comparedto theoperator's
judgment
method29
Table 3: Judges
preferredtheuse oftheDu Pont Image Manager
asthemethod of scanner
set-up
comparedto theoperator's
judgment
30
Table
C-1
:Calibration
valuesfor
theCromalin
systemused49
Table
D-1
:Gradation
curves usedin
theImage Manager for
the thesis51
Table
F-1
:Rejection
ratebased
onthe tonereproduction criteriafor
the1 2 judges
64
Table
F-1
:Rejection
ratebased
onthe tonereproduction criteriafor
the12 judges
(cont.)
65
Table F-2: Color
separationpreferencebased
ontonereproductioncriteriafor
the12 judges
66
Table F-3:
Time
requiredto
performthe
color separationby
thesix scanneroperators
67
Table F-4: An
example oftheScott's
coefficientevaluation68
Table F-5: Inter-judge
agreement resultsfor
the12 judges
68
Table F-6: Rejection
ratebased
onthe
tonereproduction criteriafor
the
six
final
judges
69
Table
F-7: Color
separationpreferencebased
ontonereproductioncriteriafor
the
sixfinal
judges
70
Table
F-8: Comparison
timefor
the
scannersettingsusing
eithertheoperator's
judgment
orthe
instructions
from
the
Du Pont
[image:9.543.66.478.148.662.2]operators
73
Table G-2: Results
ofthechi-square analysisfor
theinexperienced
scanneroperators
74
Table G-3: Results
ofthechi-square analysisfor
thedifferent
originals(regardless
thescanneroperators'
skill
level)
74
Table G-4: Results
oftheANOVA
analysisfor
thescannerset-up
timefor
the
experienced scanner operators75
Table G-5: Results
oftheANOVA
analysisfor
the
scannerset-up
timefor
the
inexperienced
scanner operators75
Table G-6: Results
ofthe
ANOVA
analysisfor
therejection ratefor
theexperienced scanner operators
75
Table
G-7: Results
ofthe
ANOVA
analysisfor
therejection ratefor
the [image:10.543.68.477.68.340.2]Page
Figure
1
:Jones Diagram
8
Figure
D-1:
Image Manager
instructions
for
thescannerset-up
for
thehigh
key
original52
Figure
D-2:
Image Manager
instructions
for
thescannerset-up for
thelow
key
original53
Figure D-3: Image
Manager
instructions
for
thescannerset-up
for
thenormal
key
original54
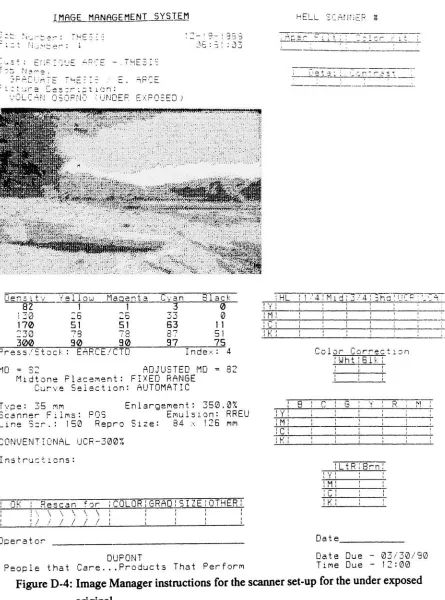
Figure D-4: Image Manager instructions for
thescannerset-up
for
theunderexposed original
55
Figure D-5: Image Manager instructions
for
thescannerset-up
for
theoverexposed original
56
Figure E-l:
ASPIRIN (HIGH
KEY)
58
Figure
E-2: SUNSET
(LOW KEY)
59
Figure E-3: VOLCAN OSORNO
(NORMAL
KEY)
60
Figure
E-4: VOLCAN OSORNO
(UNDER
EXPOSED)
61
[image:11.543.62.477.150.454.2]The
magickey
in any
commercialtransaction
is
to
satisfy
thecustomer's requirements.In
the
color separation marketthecustomer's expectationsareconsistency
in
theproduct,
andfilms
thatwhen printed will reproduce a clean visual matchto theoriginalcopy.The
variablesthataffectthequality, consistency,
andproductivity
for
thecolor separationprocess,
werereviewed.The
resultofthisreviewwasthat theoperator's scannerset-up
for
tonereproductionis
themost critical variablein
theprocess.An
estimateofthetotalcostin
theUnited
States
causedby
rescansdue
toinconsistency
ofthe scannerset-up
gave theresult of
$462,852,000
peryear.One
solutionto theproblem ofinconsistency
ofthe scannerset-up
seemstobe
theuse ofpre-scan systems.
The
pre-scan systemhelps
thescanneroperatordeterminate
theoptimumtone
reproductionfor
eachcolorseparation.A
reviewoftherelatedliterature described
seven presetterand sevenpresetter/previewersystems.
To
testpre-scaneffectiveness theDuPont
Image Manager
was used toproduce the suggested scannerset-up using
a computerized methodfor
the tone reproductiondetermination
withvery
little
operator assistance.This study
answeredthe
researchquestion,
does
theDuPont Image Manager improve
thequality, consistency,
andproductivity
of color separations made on aHell DC 399
Scanner?
The
Hell DC
399
scanner was used.Two
hypotheses,
and the experimentaldesign
arepresented.The
experiment produced color separationsusing
thejudgment
ofthreeexperienced andthree
inexperienced
scanneroperators,
andby
using
thepre-scansystem.With
thefilms
obtained,
Cromalin
color proofs were made.Judges
evaluated the proofsusing
pair comparisonto
study
thequality consistency
improvement.
To
study
theproductivity,
theaveragetimerequired
for
thescannerset-up using
both
methods wasmeasured,
using
thescanner operator's
judgment
andthe
DuPont Image Manager.
The
resultsofthestudy
yieldedthefollowing
conclusions:- the
scanner operators.
- the
Du Pont Image Manager
produces an
improvement in
theproductivity
ofsetting
up
ascanner
in
aratio of45%
for
theinexperienced
scanneroperators.
-the
use oftheDu Pont
Image Manager
did
notsignificantly increase
the color separationacceptance either
for
experienced orinexperienced
scanneroperators,
orfor different kind
of originals.
-
for
low
key
originals,
the operator'sjudgment
produced abetter
overall visual colorseparation,
comparedto
whentheImage
Manager
was used.-
for high
key
originals thereis
nodifference
in
the visual preferencefor
the color separations madeusing
either oneofthe twomethods analyzed.-
for
normal
key,
overexposed,
and under exposed originals thevisual preference washigher
for
those
color separationsthatwere madefollowing
theDu Pont Image Manager
instructions
for
thescanner set-up.The
recommendationfor further
study
is
that thesameresearchcanbe
performedin
arealworking
situation,
atfive
or sixshops,
using
theirnormaljobs in
thetest,
andasking
theirINTRODUCTION
In any
commercialtransaction
customers wantto receivethebest
quality
productfor
theprice
they
are askedtopay.The
sameis
truein
thecolorseparation andprinting
market.But
thenpeoplefind
themselveswiththeproblemofhow
todefine:
whatis
goodquality
in
thegraphic arts?.
Before going further it is better
topoint outthat theonly
stagein
thecolorreproduction process where
it is
possibleto controlthe
nature oftheimage
that willbe
producedin
theprinting
stageis
the color separation processQ).Now,
going back
to theoriginal question
it
canbe
saidthatquality
is
tofulfill
thecustomerrequirements.But
onewill
find
the
scanneroperators'
complainthat the customers
do
notknow
whatthey
want,
or thatone customer wants
something
different
thananother customer(2).One
willfind
some peoplethatwillsay
"Clean
andBright is
alwaysright"(3),
and others willsay
thatit is
relative to the subject and to the observer.But
the onetruequality
attributeeverybody
agreeswithis
thatcustomers wantconsistency
from
scantoscan,
scannertoscanner,
andfrom
operatortooperator(4).How
can consistent colorseparationsbe
produced?.The
answerto
thisquestionseems tobe
with aconsistentinput,
separationprocess,
and output.The
analysisoftheanswergivenleads
oneto thequality
oftheinput
ororiginal.Here
allpeople
know
thatalarge
originalwill give moredetail
andless
graininess.However
most photographersprefertouse35
mmfilm. If
theoriginalis
seenby
itself,
one cansay
ideally
it
should posses correctexposure,
evenlight,
colorbalance,
goodcontrast,
sharp
focus,
and
fine
grain(5).If it is
asked,
how
many
transparencies that are usedfor
the colorseparation
satisfy
all thoserequirements,
themostprobable answer willbe
very
few.
So
the
scanner operatorhas
to
deal
withthesevariationsin
theoriginal.The
separation process and output canbe
considered as an uniquepoint,
where theequipment and materials should
be
standardized.The
materials usedin making
a colorseparation are
the
result ofanindustrial
process,
thatincludes very
well controlled rawvariation.
When
theequipmentis
considered one sees some variationfrom
scannertoscanner,
but it
can
be
takeninto
consideration when each scanneris
initially
calibrated.The
scanner,
because
ofits
solid stateelectronics,
can perform thefunctions
ofanalyzing
thepicture,
processing
the
job,
andexposing
the
film
in
avery
precise way(6).Scanners
contain computers madefrom
physical components which are more repeatable than chemicalcomponents,
which are affectedby
temperature
andhumidity(6).
In
ordertocontrol therelationship
between
thescanner'sexposing light
intensity
andtheresults obtained onthefilm,
it is
suggestedtocheckthescannerlinearization
atleast
once aday(7).
By
periodically
doing
alinearization
test thisguarantees consistent and predictable output(8).This
meansthatwhen
the
scanner operator regulates the scannerto produce a50%
dot,
he
will get a50% dot
onthe
film.
So if everything
seemstobe
consistent or nottoofar away
from
whatis
expected,
why is
there
so muchdifference from
scan to scan?.The
answeris
that thereis
someinconsistency
in
the scanner set-up.Now,
taking
alook
at thedecisions
the scanneroperator
has
tomakein setting
up
thescannermany
tasksarefound. For
every
singlejob
the scanner operator mustknow
theprinting
characteristics such as thedot
gain, gray
balance,
trapping,
printing sequence,
ink
hue,
ink
strength,
and papertype.And for
the originalhe
willhave
toknow
the emulsiontype,
originalsize, exposure,
development,
density
distribution,
highlight
and shadowdensities,
colorbalance,
graininess,
and reproduction size.These
arejust
some ofthevariablesthe
scanner operator musthandle.
The
scannerset-up is
avery
complex matrix ofdecisions
based
onmany
variables.Thus
one can
easily
understandhow
a scanneroperatorcan makethewrong set-up
decisions(9).
By
taking
alook
at the color separation market one can get a goodidea
ofthe realdimension
ofthis
problem.Usually
when a customeris
unsatisfied withacolorseparation,
it is necessary
to
rescan the original.This
notonly
willbe
an extracost,
but usually
the scanneroperatorhas
no record of whathe
has done
before,
sohe has
to restartthewholeprocess of
making
the
decisions
for
thenewscanner set-up.Looking
atthe
extra cost causedby
awrong
colorseparation,
it
canbe
assumedthat
a good color separation can cost$59,
anda not so good one can cost$149(3).
It has been
reportedthat the
averagerescan rateis
aslarge
as30%(10).
One
can estimatethe
financial loss due
to poor scans.In
1987
therewere1 1,000
scanners worldwideand3,000
ofthose
werein
theassume the average production
for
a scanneris 100
color separations per scanner perweek(ll),
with a rate of2
operators perscanner* 12).In
theUnited States
thereis
atotal estimated6,900
scanner operators.This
meansthere
are6,900 different
criteriafor
setting
up
a scannerthat
can alsovary
from
day
today.
Then
it is
logical
thatonecouldfind
someinconsistency
in
the
color separation process.Now,
evaluating
the totalcost causedin
theUnited States
by
rescansdue
to the
inconsistency
in
the scannerset-up
one gets$462,852,000
per year.Even
withthese
variationsthe
color separation marketis
stillprofitable.But
one can seethat
it
couldbe
alot better.
Looking
atthe
scannerefficiency,
measured as the numberofgood scans made
during
eachshift,
one willfind
that
scanners spinonly
for
15
to20
minutes perhour
(13).
So
ascannerworking
rate of25
to33%;
and whatdoes
thescanner operatordo
the rest ofthetime?.
He has
tomount,
dismount,
develop
thefilm,
and analyzethetransparency,
whichis
themosttimeconsuming
operation,
plusset-up
the100
or more controlsonthecolor scanner.One
could assumethatby having
an automaticset-up
onthescannerthe rescan rate couldbe
reduced.This
is
the
trackthe
scanner manufacturers aretrying
tofollow
nowadays(4).But
there
is
stillthe
problem ofhaving
over10,000
scannersworldwidewithoutautomaticset-up.
It is necessary
tofind
a practical solutionfor
thosescanners.A
pre-scandevice
canhelp
thescanner operatortoevaluate theoriginal,
and givehim
thedirections for
setting
thescanner's controls(14).
Some
authors report a rescan rate of2.6% only
by
using
thepre-scansystem(15).
Bruno is
moreconservative.He
reports a rescan rate reductionfrom
30%
to20% using
a presetterdevice,
andfrom
30%
to10%
for
a presetter/previewerdevice(10).
In
this thesis one ofthese pre-scansystems,
theDuPont Image Manager
wasused.The
final
results obtainedusing
thissystemfor
colorseparationswere compared withthe resultof color separations made
by
experienced andinexperienced
scanner operators withoutany
assistance.
The
system performsan automatic analysisofthetransparency
andsuggeststheoptimum scanner
set-up
for
thecustomer's requirements.This
researchhas
answeredthequestion,
does
theDuPont Image Manager
help
toimprove
theproductivity
andquality
1.-
Field
Gary,
Color
andits
Reproduction. Graphic Arts
Technical
Foundation,
Pittsburgh,
1988.
2.-
Southworth
Miles,
Quality
Control
Scanner,
Prepress
canbe
a controlled process,Volume
9,
Number
10.
3.-
Southworth
Miles,
Quality
Control
Scanner,
Scanner
quality takes team work.Volume
2,
Number
1 1.
4.-
Southworth
Miles,
Quality
Control
Scanner,
Color
reproduction past, present, andfuture.
Volume
7,
Number
7.
5.-Southworth
Miles,
Quality
Control
Scanner,
Original
transparencies:what'sbest
for
reproduction?.
Volume
7,
Number 3.
6
.-
KODAK
publication
No
Q
-7 8
,
The Color Separation Scanner.
7.-
Color
Separation Class
Notes.
Summer
1988,
Prof. Joseph Noga.
8.-
Molla
Rafiqul,
Electronic Color
Separation,
R. K.
Printing
&
Publishing Co.,
West
Virginia,
1988.
9.-
Southworth
Miles,
Quality
Control
Scanner,
Color
scanner set-up:kev
to controlquality .
Volume
9,
Number 6.
10.-
Bruno
Mike.
Status
ofPrinting
in
theU.S.A..
1987.
11.-
Bruno
Mike,
Status
ofPrinting
in
theU.S.A..
up-dated1988.
12.-
Southworth
Miles, Quality
Control
Scanner,
Color
controlfor
cost and quality.Volume
4,
Number 3.
13.-
Southworth
Miles,
Color Separation
Techniques,
Third
edition,
Graphic Arts
Publishing
Co., Livonia,
New
York,
1988.
14.-
Graphic Arts
Monthly,
October
1983,
From Camera
toScanner
andBeyond,
p.45-52,
Peter Johnston.
THEORETICAL
BASIS FOR THE STUDY
Good
color separationsarethosethat
containdot
values on thefilm
which whenprinted,
will yield
the
desired
colored).
To
produce thisresultthe
scanner operatormust understandthe
basics
of color reproduction: tonereproduction, gray
balance,
colorcorrection,
andunsharp
masking.Tone
Reproduction
is
therelationship
ofthedensity
in
theoriginal to thedensity
ofthereproduction and
the
percentdot
printedonthefinal
product.For
abetter
understanding
ofthisone
first has
to realizethat thephotographic originalhas
agreatercapacity
oftones thanthe
printing
process.So
for
thereproduction one needs tocompressthe tonal rangeoftheoriginal(2).
The
mostimportant
pointhere is
toreproducethe
range withtonaldetail in
theimportant
areas,
sacrificing
the tonaldetail in
areasless important
to thepicture.To
control thechangesin
thedensity
levels
ofanoriginalimage
whenit is
convertedto thehalftone film
andthenprinted onehas
toknow
certaincharacteristics.These
characteristicsarethe original
image
andtheprinting conditions,
suchaskind
ofink,
solidink
density,
screen
ruling,
dot
shape,
papercharacteristics,
dot
gain,
ink
trapping,
press,
andso on(l).Therefore,
onemay
conclude that the tone reproductionis
specificto
each press undergiven
printing
conditions.The
optimumtone
reproductioncanbe
determined
by
constructing
a graphthatrelatesthedensities
of anaverageoriginalto thoseone canprint.Then,
todetermine how
toproduceit
one relates thesize of
the
dots
onatestfilm
to
theirrespective printeddensities using
aplate/press graph.
Finally,
tofind
the required color separation curves the two graphsmentioned above are puttogetheranda45straight
line
(transfer
curve).Following
thesesteps one can
build
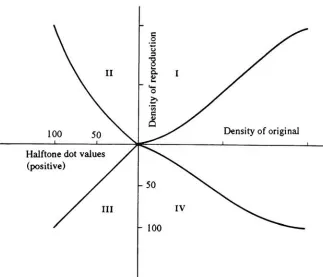
the
Jones Diagram
(shown
in
figure
1),
and sodetermine
the requiredquadrant
I: desired
density
relationship
between
the
original andits
reproductionquadrant
II:
desired relationship
between
thedot
size onthefilm
andthedensity
printedby
those
dots,
plate/press graphquadrant
TQ:
transfer
line
(45)
quadrant
IV: determine
the
dot
sizerequiredfor
thedifferent
originaldensities
toreachthe
[image:19.543.104.427.159.436.2]measuredwiththevisual
filter
ofadensitometer.
This gray
has
noapparentcolorcast, eventhough
it is
produced withcyan,
magenta,
and yellowdots
ofdifferent
sizes(3).The
gray
balance
correctionis necessary
because
ofthe
hue
error the processinks have. The
densities for
aset oftypicalprocessinks
are:filter
B
G
R
yellow
1.00
0.05
0.02
magenta
0.65
1.30
0.10
cyan
0.12
0.34
1.20
total
1.77
1.69
1.32
Table
1.-Densities for
processinks
(source
Field, G.,1988,
p229)
Here
oneseesthereis
moreredlight
reflected(i.e.
lower
density)
thanblue
and greenlight,
so
it
will produce abrownish
cast(l).It
is
necessary
toadjustthedifferent dot
sizesin
thegray
areasto reproducethe samedensity
for
the threefilters
for
givenink
densities. Once
the correct
dot
sizestoproduce a neutralgray
aredetermined,
they
should notvary
unlessthe
printing
conditions change<2).Color Correction is
neededbecause
withtheavailable pigmentsit is impossible
tomakea
perfectly
pureink.
As
it
canbe
seenin
table1
, eachink
absorbs some ofthelight it
should transmit.
Color
correctionis
the compensationfor
unwanted absorptionof colorscaused
by
ink deficiencies(2).
It
is important
topoint outthat
color correctiondoes
not affectthegray
areas(3).Color
correctionhelps in
reproducing
thememory colors,
like
greengrass,
blue
sky,
and redapples.Scanners
have
twovariationsof colorcorrectionthatcanbe
accomplished atthe controlpanel.
There
are adjustmentsfor
overallcolorcorrection usedtocompensatefor
any
overallcolor change.
These
adjustments affectevery
colorin
whichthechanged color appears(i.e.
a magenta adjustment will affect
every
pink,
red,
orange and purple).There
are alsoselective color controls thatpermit changes
in
a smallerband
ofthecolorspectrum,
andmake a change
in just
onehue
similartothe
colordesired
to
correct(4).Unsharp Masking
accentuates thecontrastbetween
adjacenttones,
andincreases
the edge effects where tones change.This
accentuation gives the appearance ofa sharperpicture with more
detail(4).
It increases
thesharpnessofthereproduction relative to the [image:20.543.175.368.162.260.2]cylinderrotation.
Unsharp
masking is
possiblein
both directions
whentheUnsharp
Mask
is
adigital
function like
ontheCEPS(6).
Proper
adjustment ofthesefour
characteristicsis
the tool scanner operatorshave
attheirdisposal
toproduce agood color separation.It is
necessary
thatoptimumtonereproductionand
gray balance be
achievedbefore
the
color correction canbe
evaluated(5).The
unsharp
masking is independent
ofthe otherthree
characteristics.Finally,
one cansay
that tone reproduction andgray
balance
are relatedbut
different, being
thatcorrecttonereproductionis
themostimportant
ofallthese
four(3).
Therefore,
since all color attributes areaffectedby
thetone reproduction,
over90%
of good separations canbe
achievedby
making
correcttone reproduction
adjustments,
taking
into
account the original attributes,printing
conditionsand customer's
desires(6).
When
onetries toproduce a color reproduction withsomany
restrictionssuch asdifferent
tonal
ranges, only
threeinks,
dots
torepresent continuoustones,
impure
inks,
and soon,
onehas
tokeep
in
mindthat thecolor reproductionprocessis
a compromise.While
oneENDNOTES FOR CHAPTER II
1.-
Field
Gary,
Color
andits
Reproduction.
Graphic Arts
Technical
Foundation,
Pittsburgh,
1988.
2.-
KODAK
publicationNo
0-78.
The Color Separation Scanner.
3.-
Southworth
Miles,
Southworth
Donna,
Quality
andProductivity in
theGraphic
Arts,
Graphic
Arts
Publishing
Co., Livonia,
New
York,
1989.
4.-
Color Separation Class
Notes,
Summer
1988,
Prof. Joseph Noga.
5.-
Southworth
Miles,
Color Separation
Techniques,
Third
edition,Graphic
Arts
Publishing Co., Livonia,
New
York,
1988.
6.-
Miles Southworth
andEnrique
Arce
meeting
at theSchool
ofPrinting
atRIT,
CHAPTER
III
LITERATURE
REVIEW
In
the
introduction it
was seenthatgetting
consistent color reproductionis
highly
dependent
on thescanner set-up.
Southworth
said that one can expect asmany
opinions about thescanner
set-up
asthereare scanner operators(l).Probably
themostcriticalstep in
thesetting
up
of a scanneris
toevaluatetheoriginalfor
optimum resultsin
theseparationfor
a givenprinting
condition.Even
an experienced operatormay
makewrong
decisions,
and the adjustmentsin
a scannermay
notalwaysproducetheexpected results(2).It is
obvious thatsome
device
is
needed to assist the scanner operator to make thesedecisions
more scientifically.A
pre-scan analysis system seemstobe just
such adevice.
But,
whatis
a pre-scan analysis system?.A
pre-scan analysis systemis
a generic termbeing
usedtodescribe
any
systemthathas been introduced
tohelp
scanner operators makequicker and more accurate scanner set-ups(3).
The
pre-scan systembasically
helps
theoperatortoevaluatetheoriginal
copy in
termsofemulsion,
detail,
under or overexposure,
tonal
range,
andotherfactors.
Once
thecharacteristics oftheoriginalareentered,
thedevice
will selectanoptimaltone reproductioncurvefor
thatoriginal,
and agiven setofprinting
conditions.Then
thesystemprintsoutthedirections
for
setting
the
scanner'scontrols,
orin
some casesit
programs the scanneritself(4).
The
system generatesthe
optimum tonereproduction
data
afterconsidering
the characteristics oftheoriginal,
the paper tobe
printed
on,
andthepress variables.From
the optimumtone reproductiondata
a computercangenerate
density
ordot
percentvaluesfor
each oftheprocess colors.Then
thedesired
scannercontrol settings
for
thegradationcanbe
set(2).Basically
therearetwo types of pre-scan systems: off-line scannerpresetters,
and on-lineThe
presetter/previewerasits
nameimplys is
apresetting device
with a videodisplay
toshowthe effects of
the
settings and correctionsbefore
producing
thefilm
and thehard
proof,
alldone
using
a quicklow
resolution scan.Even
in
thiscase one needs tomake a trial scannerset-up,
andaccording
to the
results shown on a videodisplay,
the scanneroperator
decides
the nextstep in
the color separation process.Most
ofthese systems arededicated
to
proprietary
scanners,
andthey
reduce makeovers and proofsby
abouttwo-
thirds.
Scans
made with presetter/previewer averageabout
10%
makeovers andbetween
1.25
to1.5
proofs per scan(5).There is
also athirdtype
whichis
avideodisplay
usedon thescannerafter apreliminary
scan
is
madetodetermine
the
accuracy
oftheset-up before
producing
thefilm
and proof(3).In
thiscase one uses anormalscanning
speed.One only
savesthefilm
andproofmaterial,
because
thescanner operatorhas
todecide based
onhis
own experiencethe changesin
thescanner
set-up
if
needed,
if
nothe
goesto thefilm
andthehard
proofwith thefirst
scanmade.
Presetters
are the systems used off-line thathelp
todetermine
a scannerset-up
by
analyzing
the original characteristics.Following
are abrief description
ofthe mostimportant
features for
seven ofthesesystems:-Carlson
ScanCal
Prescan System:
the operator makes ascanofthe originalcopy
with ablack
and white video camera(6).With
the
density
values obtained the system makes adensity frequency
histogram. It
calculatesthetonal
contentofthe original,
thendetermines
thescannergradationcurveaccording
to the tonereproduction andkind
oforiginal copy(7).This
manufacturer guaranteeshis
system willincrease productivity
by
atleast
20%(8).
-Chemco/CAPS
(Computer
Aided Prescan System):
theoperator uses a visual comparisonofthe original
transparency
with aset ofreferencetransparencies
toclassify it first into
high,
normal,
orlow
key,
then
into
over, under,
or normalexposed,
andthen
into
high,
normal,
orlow
contrast.This information is
thenkeyed into
theCAPS
subprogram^).Afterwards
thecomputer convertsthisinformation
to tonereproductioncurves andscannersettings(5).
-Colortune
Viewer: is
a small portable computer controlled viewer.The
scannerset-up is
colorcorrected
for
thetransparency
colorimbalance
by
adding CC
filters
whileit is
being
viewed(6).
After
reaching the
pointthatproduces a good visualappearance, those
values are translatedinto
thecorresponding
changesin
dot
sizesin
the
final
color separations(2).readings(6).
The
system analyzesthe
resultby
comparing it
with adatabase
ofover20,000
color reproductions analyzed
in
theBrunner
andDuPont
color reproduction studies(5).According
to thecustomer preferences(clean
andbright,
facsimile,
lighter,
ordarker),
andthe
characteristics ofthe
customer's press and stocktheaimpointfor
thescannerset-up
is
produced(2).
-Colorcomp:
This
system uses a spectrophotometer to measure the color of thetransparency
ratherthan adensitometer.
This
data
is
thenfed into
the computer whichautomatically
generates thedata
for
setting
up
the scannerfor
the optimum colorseparations(2).
-Spectronics
Scantronics: The densitometer
or the scannerdensity
readingsfrom
atransparency
areinput into
a computer.Then it
calculatesthe tonereproductioncurves andtheproper settings
for
thescanner set-up.(5).-Numakura
G.I.S. Equations:
this system allows the scanner operator todetermine
theideal
tonereproduction curvesneeded,
using
thedensity
readingstakenfrom
the originalcopy,
and the relationbetween
thedensity
rangesfor
the original andthereproduction,
without operator
judgment
1,11).Presetter/Previewers
areon-linesystemsthatallowthescanner operatortouseatrialscanner
set-up,
then theresult ofthecolor separationis
viewed on a videodisplay. The
scanner operator
decides
thenif it is
necessary
tochangethescannerset-up
or accepttheresult obtained.
Following
areabrief description
ofthemostimportant
features for
sevenofthesesystems.
-Crosfield
Scan View: is
asystem thatuses ahigh
resolutionCRT
(1024x1024)
toviewtheexpected
reproduction,
after the originalcopy is
scanned at twice the normalscanning
speed withsettings estimatedto
be
correctby
thescanner operator.When
theresults areviewed onthescreen
the
settings areleft
aloneor changedbefore
the
final
high
resolutionscan
is
made(2,5).-Scanalizer
200
1:
from
Royal Zenith
also uses alow
resolutionfast
scantoproduce avideodisplay
using
the trialsetting
onthescanner.Then
theresults arevisually
analyzed.If it is
necessary
the scannersettings arechanged,
and a normal speed scanis
madeto
film
andproof.
The
systemhas
amemory
tokeep
thedifferent
settings andhelps
the
operator makevisualcomparisons and critical evaluations(2,5).
-Scan
Proof: is
madeby
aJapanese
company
(Toppan).
It
uses a20
secondfast
scan.The
reproduced.
Necessary
set-up
changes canbe
displayed
immediately.
It
can also storeimages
from
previous settingsfor
visual comparisons(2,5).-Scanvision:
is
aSwiss company
(Gramag
Ag)
product andit
worksusing
the sameprinciplesas the
Scan
Proof
system(2).-Skanskop:
is
part of theHell
Chromacom
prepress system.It
canonly
makehigh
resolution scans.
The
scannedimage is
shown on a color monitordisplay(2,5).
-Royal
Zenit 210-CM:
is
aninteractive
system thatcan produce afast
low
resolution scan(in
40
seconds).The
image is
viewed onamonitor.The desired
changes are made andthenthescan
is
produced at normal speed(2,5).-Scitex
Pre-sponse Console:
a standard scannerset-up
canbe
used to make ahigh
resolution scan.
The
resultis
thenviewed on a color video monitoreither as afull
colororas
individual
separationfor
each color.If
the
scan requires morethanslight changes thetransparency
canbe
rescanedwhileit is
still on thedrum,
and theevaluation processis
repeated.
It
can alsobe
correcteddigitally(2,3,5).
One has
tokeep
in
mind that althoughthe presetter/previewer seems tobe
moreuseful,
viewing
a soft proof requires a skilled operatorbecause
the
viewedimage
has
tobe
transformed
in
one's mindfrom
whatis
seentowhat willprint.The
reasonfor
thisvisualdiscrepancy
is
thedifferences in
hue, luminance,
andresolutionfrom
thevideoscreen tothe
printedimaged
0).Also
all video systems requireanestimatedtrial tone reproductionsetting
toproducethefirst
scan.There
are some otherdevices like
the
Scanner Data
Terminal,
Data
setterDS-700,
and soon.thatcan
improve
scannerset-up,
and scannerproductivity,
but
they
arenota pre-scandevice
asit
wasdefined before(2).
All
thesesystems and others not mentionedallowpeopleto
improve
thescannerset-up
by
either
producing
a print-out with the tone reproductionsetting
specifications that thescanner operatorcan
use,
orby directly
programming
theminto
thescanner.Some
ofthesesystems are able
to
workwithany
scanner andothers are name scannerdependent.
Another
characteristicofthepre-scan systemsis
thatthey
canbe
usedasateaching
tool.The
systemtells theoperatorhow
tosetthescannerfor
a particularoriginal,
theoperatordoes
so,
looks
attheoriginal,
looks
atthe separation,
andlearns
alittle bit
more about thescanner controls(8).
Using
the pre-scan analysis system one would expectless
experienced operators couldproducemore
high
quality
scansthanwouldnormally
be
expectedfor
their
skilllevel(9).
critical
decisions
abouttonereproduction, allowing
theoperator moretimefor
specializedcorrectionsofspecificcolorsand
final film
evaluation,
thescanneroperator acceptance ofthe
pre-scansystemsis
still a problem(9).This may be
because
thescanner operators see thepre-scan equipmentas a replacement
for
their
skill andathreat to theirjob.
This
authorbelieves
the pre-scan systemis
ahelp
to the scanner operator toimprove
quality
consistency
andproductivity
ofthecolor separation process.For
themanagerswhohave
tomake
the
decision
to
buy
this
equipmentthere
is
alack
of validinformation
proving
theadvantages and
disadvantages
ofusing
these
systems.The
color scanner used with a pre-scan analyzer can work almostcontinuously.The drums
can
be
preloaded so thescanner stopsspinning only
for
reloading
thedrum
andfilm. The
final
cost per scanis
less
because
theremakes arefewer,
less film is
used,
and morehigh
quality
color separationscanbe
madein
ashorter amountoftime(10).The Du Pont Image Manager:
although the objective of pre-scan systemsis
toimprove quality
andconsistency,
thefact
they
have been
availablein
themarketfor
along
time,
andhave
notbeen widely
accepted couldlead
one to the question of theireffectiveness.
There
are estimated tobe
200
worldwide,
including
all thebrands
thatexist(12).
This
thesis work wasdone
on theDu Pont Image Manager
system.The Du Pont Image
Manager
systemis
a presetterdevice
thatanalyzestheoriginaltransparency
withvery
little
or no operator assistance.
This
researcherdecided
to use theDu Pont Image Manager
system
because
as90%
ofthe efforttoproduce good color separationsis
achievedby
thecorrect tone
reproduction,
and this system appearedto
the author ashaving
the
morereliable method
for
determining
the tone reproduction adjustment.This
systemis
abletodetermine automatically
the optimum tone reproductionfor
each originalcopy using
acomputerized,
and objectiveevaluation.The
systemis
programedfor
aspecificclientandpress/ stock combination
by
entering
thegradationcurvesthatproducethebest
resultsfor
thecolor separation
in
that case.Then,
thesystem generates10
more variationsfrom
thegradations
already
entered,
four
for lighter
original and sixfor
darker
originals.In
theanalysis
the
systemdetermines
thehighlight
density
andits
location,
andthetonal
rangefor
the
transparency.With
this
information
andthe
data base for
the20,000
samples analyzedin
the
Brunner
andDu Pont
colorreproductionstudies,
thesystem generatesthecurve thatpredicts
the
best
relationship
between
theoriginal andits
reproduction.Finally,
depending
generatesthe
halftone
gradationcurvestoproducethedesired
reproduction.This data
areprinted out on a scanner
set-up instruction
sheet.The
system can also printablack
andwhite,
low
resolution reproduction ofthetransparency
pointing
outthelocation
for
thehighlight
and shadow.This is
usefulinformation
if it is
wantedtoeliminate thecolorcastofthe
transparency
andtocheckthedata
givenby
thesystem.The Image Manager
analyzes atransparency
in
thefollowing
manner(5,13):-
The
transparency
is
mountedin
aholder
andthenintroduced into
the system.There
thesystem
is
adjustedautomatically
for
the size of thetransparency
and afast
scanis
performedto
find
theminimumdensity
orhighlight.
-When
thehighlight is found
the
image is
displayed
on a monochrome monitor with aflashing
pixelshowing
thehighlight location.
Then,
theoperatorcan adjust thehighlight
level
whilehe is viewing
theresults onthemonitor.-
A
second scan with
the
highlight
zeroed-outis
performed,
andthesystemdetermines
the tonalrangefor
the transparency.This data is
sentto thecomputer.-
The
computer analyzes thedata,
andaccording
to the customer's preferences such asClean
andBright, Facsimile, Lighter,
orDarker,
and thedata base it has
available thecomputer
determines
the optimum scannersettingsusing
thebasic
gradationpreviously
enteredto thesystem whenthecustomer,
press/stockcombination wasdetermined.
-
The
resultsfor
the scannersettings areprinted asfive
pointgradationsalong
with other relevantinformation
for
thejob.
ENDNOTES
FOR CHAPTER
HI
1
.-Southworth
Miles,
Southworth
Donna,
Quality
andProductivity in
theGraphic
Arts,
Graphic
Arts
Publishing Co., Livonia,
New
York,
1989.
2.-
Molla
Rafiqul,
Electronic Color
Separation.
R. K.
Printing
&
Publishing Co.,
West
Virginia,
1988.
3.-
Southworth
Miles, Quality
Control
Scanner,
Aids
toscannerefficiency, qualityandprofit.
Volume
4,
Number 1.
4.-
Graphic Arts
Monthly,
October
1983,
From Camera
toScanner
andBeyond,
p.45-52,
Peter Johnston.
5.-
Bruno
Mike,
Status
ofPrinting in theU.S.A..
1987.
6.-
Southworth
Miles, Quality
Control
Scanner,
85,
Volume
5,
Number
5.
7.-
Laser in
Graphics,
Vol
1,
1984,
p.612-617,
The Application
ofDigital Picture
Processing
toPrescan
Evaluation.
Archer Brent.
8.-
Editor &
Publisher,
July
13, 1985,
Prescan Equipment Growing in Popularity,
Fitzgerald
Mark.
9.-
Graphic Arts
Monthly,
October
1984,
Prescan Evaluation Systems Increase Scanner
Productivity,
p.47-52.
10.-
Southworth
Miles,
Color Separation
Techniques,
Third
edition,
Graphic Arts
Publishing Co., Livonia,
New
York,
1988.
11.-
Takashi Numakura
andEnrique Arce
meeting
at theSchool
ofPrinting
atRIT,
October
26,
1989.
12.-
Miles Southworth
andEnrique
Arce
meeting
atthe
School
ofPrinting
atRIT,
December
12,
1989.
CHAPTER
IV
STATEMENT
OF THE
PROBLEM
From
the evidence presentedin
theprevious chaptersone cansay
thatone ofthemost,
if
not the
most,
serious problemsin
the color separation processis
the scannerset-up
inconsistency. This
problem causesmany
other problems such asrescans,
film
waste,
delays
in
thedelivery,
proofing
materialwaste,
and so on.As it
was seenin
the
literature
reviewthere
aremany
pre-scandevices
that canhelp
thescanner operator with the
set-up
task.
Some
systems arepresetters;
same arepresetter/previewers;
while others serveonly
as a previewer.But
all ofthemhave
onefinal
purpose,
whichis
to reduce rescansby
producing
a goodquality
colorseparation at thefirst
scan.If
onelooks
atthe
color separation market requirementsit
canbe found
that the moreimportant
pointsfor
thepeoplethatare aware ofthesuccess oftheirbusiness
are:The
overall visual acceptanceby
theircustomertothe
proofs produced with thefilms
obtainedastheresultof aconsistentcolor separation process.
To
get ahigh
productionlevel,
whichis
directly
relatedto the
ability
to
produce morecolor separations
in
the same period oftime at alow
rescan rate.It
means toreduce notonly
thelabor
costsbut
alsothefilm
andproofing
material costs.These
pointsmentionedabove showthat the
Du Pont
Image
Manager
canbe
avery
goodalternative to
fulfill
the color separation requirements.Thinking
in
thisway
the
authordeveloped
the
following
research questionfor
this thesis:
Does
the use of theDu Pont Image Manager improve
thequality
consistency,
andIn
ordertoanswerthisquestionthefollowing
hypotheses
weretested:HYPOTHESIS 1
"Color
separations produced ontheHell DC 399 Scanner
using input set-up
from
theDu Pont Image
Manager
willbe
morevisually
acceptedthanwhenthecolor separations areproduced
using
scanneroperators'judgment
for
thescanner set-up. "HYPOTHESIS
2
"The
color separation process onthe
Hell DC 399 Scanner
willbe
more productive(considered
asthenumber of color separationsproducedin
a periodoftime)
when thescanner
set-up input is
determined
using
theDu Pont Image Manager
than whenit
is
determined
using
scanneroperators'
CHAPTER
V
METHODOLOGY
1.-
Experimental
Design
In
orderto testthe
hypotheses
formulated,
it
wasnecessary
tocomparethe overall visualacceptance of color proofs made withthe
films from
thecolor separationsproducedusing
input
from
theDu Pont Image Manager
againsttheunassistedtraditionalmethod of scannerset-up.
To
produce thescanning
operation,
three experienced andthreeinexperienced
scanneroperators were askedto
help
in
thedevelopment
ofthisproject.For
defining
these twocategories an experienced scanneroperator was considered as one who
has
produced atleast 1
,000color separations.Five
transparencieswere used as representative ofthekind
of originals a color separationshop
couldreceive.They
werehigh, low,
andmediumkey,
andfor
thesame subjectas themedium
key
anover,
and anunder exposedtransparencies
were produced.This
researcherdecided
tousetheHell DC 399 ER
scannerbecause
it
wasthoughtit
wasgoing
tobe
connecteddirectly by
aninterface
withtheDu Pont Image Manager.
Finally
theinterface
was notavailable,
but
as the gradations and all the previous process weredeveloped
for
thatscannerit
wasdecided
to
continuethis researchthere,
but any
scannercould
be
used.As
theobjectivefor
thisthesiswasto comparetheresultsfrom
theImage Manager
to thetraditional method of scanner
set-up,
only
changesin
tone reproduction were produced.The
scanner operatorswere alsoinstructed
tonot removethecolorcast,
tokeep
the colorcorrection settings at
the
normal conditionsfor
thescanner,
and toproduce aclean andbright
colorseparation.A
copy
ofthe
instructions
for
the
scanner operatorsis
presentedin
Appendix
A.
The
tonereproduction characteristicsfor
theprocess weredefined
by
theuseof
the
Cromalin
colorproofing system,
which waspreviously
calibrated tothe
SWOP
standards.
The
proofing
calibrationdata
arepresentedin
theAppendix C. The
Cromalin
methods used
for
thescannerset-up.The five
originals were analyzedfirst
on theDu Pont Image Manager
todetermine
thesystem's recommended scanner set-up.
The
gradation curves enteredto the system weredetermined
by
trial and errorfor different
gradations.Finally,
the set of gradationsrecommended
in
theImage
Manager Owner's Manual
for Cromalin
proofing
on coatedstock were used.
The
gradation curves andtheprint outfrom
theDu Pont Image Manager
for
eachtransparency
are presentedin
theappendixD.
Each
original was analyzedthrough this
system sixtimes.
An
average valuefor
the timerequired
for
each analysis wasthen
evaluated.The
system was operatedin
theautomaticmode,
so no operatorjudgment
was required.In
the color separation process each scanner operator was asked to produce a clean andbright
reproductionfor
each original.After
the scanner operatorfinished
with theseparation made
based
onhis judgment he
was askedtoproduce anewcolorseparationfor
the same original
but
nowfollowing
the
Du Pont Image Manager instructions. All
thescanner operator's settings were
recorded,
thenif it
were required to repeat a colorseparation,
only
theoriginal settings shouldbe
used.This
wasdone because only
thefirst
scans were considered
in
thisstudy.No
rescans wereallowed.The
time requiredfor
all operationsusing
both
methods was recorded.This
time periodincluded
from
when the transparencieswerehanded
to the operatorstowhenthescannerwas
ready
to start scanning.For
the analysisusing
theDu Pont Image Manager
thecomplete process was timed.
When
theabove procedures were completed60
sets offour
color separation
films
were available.The
color separations were then color proofed.To
minimizethe
variability in
the colorproofing
system(although
it
wascalibrated)
each pairof color separationsthatweregoing
to
be
compared were proofed simultaneously.Thus if
for
any
reason a minorvariationhappen in
one color proofit
alsohappened
to the another.All
the color proofs werenumbered
in
a randomway
to
eliminate names andany bias in
the
distribution for
theevaluationthatcould
influence
the
results.The
60
color proofs werethen
evaluatedby
12
judges.
In
orderto
analyzethe two
hypotheses
statedit
wasnecessary
to perform a subjectiveevaluation ofthe
different
colorseparations producedtodetermine
which method producedthe
highest
number of accepted scans.To determine
which methodhad
thehighest
productivity, the
timeit
took theoperatorsto
set-up
the
scannerusing
both
set-up
methods2.-
Subjective Evaluation
A
colorproofusing
theCromalin
system was madefor
all the scanneroperators' color
separations,
which was proofed side-by-side withthe respectiveImage Manager's
colorseparation produced
by
thesame scanner operatorfor
thesame originaltransparency.So
30
pairs of color proofs were obtained.They
werejudged
by
a panel of1
2
judges
selectedfrom
thestudentstaking
the
Electronic
Color Image
andControl
courseofferedtheSpring
quarter,
1990 in
theSchool
ofPrinting
atRIT. This
class was selectedbecause it
involves
students
interested in
the
color pre-pressarea,
andbecause
they
have
asolidbackground in
the
area oftone
and color reproduction.All
the
color proofs were numberedfrom
oneto
60,
andtherewasnoidentification
ofwhomade which color separation.
The
orderfor
thepresentation ofthecolorproofs was chosenrandomly.
All
thenon-image areas were cuttoavoidany
visualinterference,
andtheproofsweremounted on a neutral
gray
cardboard.Before
theevaluation,
detailed
instructions
werehanded
to thejudges
along
with theanswer sheetsand a
copy
ofthe scanneroperators'
instructions.
The
judges
were asked toperform an evaluation ofthe colorproofsin
twodifferent
ways.First,
showing
the
judges
one color proof atthetime,
they
wereasked:Based only
ontonereproduction
criteria,
is
thecolor separation acceptable?Second,
showing
thejudges
eachpair of color
proofs,
they
were asked:Based
only
ontonereproductioncriteria,
whichoneof
the
twocolorseparationsdo
youprefer?Once
the paired comparison was performedby
all the12
judges,
an assessment ofinter-judge
agreement was madeusing
the
resultsobtainedfrom
thesubjective evaluation.The
Scott's
coefficient was evaluatedfor
eachjudged).
To have
ajudge
consideredconsistentwiththeothers a
Scott's
coefficientof76%
was required.With
the resultsfor
the evaluationsthe
12 judges
wereranked,
andsix out ofthe12
were chosen.Those
sixjudges
had
aScott's
coefficient of atleast
67%,
which wasless
than preferredbut
stillconsidered acceptable
for
thepurposesofthestudy.The
resultsoftheScotf
s coefficient3.
-EquipmentorResources
The
list
ofmaterials, equipment,
and resources usedin
this
study is
asfollows:
-
Hell Chromagraph
399 ER
electronic color scanner-
Dupont
Image
Manager
prescan system with software version4.0
-
Kodalith film
processor
-GTI,
Graphic
Technology
Inc.,
Viewing
Booth
withilluminant
at5000 K
-3M,
Electronic
Dot
Generated Scanner
Film,
52.5
x64.6
cm,
or20.6
x25.4 in.
-
Du
Pont Cromalin Laminator
(positive)
-
Du Pont Cromalin
processor unit
ATM II
(positive)
-
Frame U.V.
light
Teaneck Graphic
Corp.,
L 1250
lamp,
Kokomo
Filter,
light integrator
Expo
19,
GTI Graphic
Technology
Inc.
-
Cromalin Commercial Receptor CR/1
-
Du Pont
toner
powderyellowSOP/Y
pos-6,
magentaSOP/M
pos-4,
cyanSOP/C
pos-4,
and
black
SOP/K
pos-4.-
Positive
working proofing
film
C4/CP,
25 in
x300
ft,
batch
roll1630-0010.
-Transparency
2
1/4
x2
1/4in,
named:ASPIRIN
(HIGH
KEY).
-Transparency
35
mm,
named:SUNSET
(LOW
KEY).
-Transparency
35
mm,
named:VOLCAN OSORNO
(NORMAL
KEY).
-Transparency
35
mm,
named:VOLCAN OSORNO
(UNDER
EXPOSED).
LIMITATIONS
OF
THE
STUDY
Although
the experiment performed answered the research question, there are somelimitations
thatrestrictedtheresults obtained.These
arethenaturallimitations in
any study,
such as
limitations
in
time,
resources,
andmoney
available.Even
though thestudy
answeredthe
hypotheses
withthe
restrictionsthereare,
it is
stillinteresting
toknow
whatlimitations
thisauthor saw.The
experiment was performedby
only
sixscanneroperators,
threeexperienced andthreeinexperienced.
It
wouldbe
better
to
have
alarger
number ofscanner operators tobetter
account
for
theoperators'variability.
Also
allthe scanner operatorshad
thesamebasis in
their
education,
it is
because
all ofthem
arefrom
theSchool
ofPrinting
attheRIT.
Five
different
originals were usedassuming
that thosearerepresentative ofthemarket.It
might
be
better
to
analyzerealjobs
and compare the results ofusing
or notusing
theDu Pont
Image
Manager.
The
scanner chosen wasthe
Hell DC
399,
so the results aredirectly
applicablefor
thatscanner,
andthereis
notany
evidence about what shouldhappen in
adifferent
scanner.The
pre-scan system studiedonly
involved
tone reproduction.The
color correction andunsharp masking
functions
werekept
constant.But it is known
thata changein
the tonereproductionaffectsthecolorcorrection,so
it
couldbe
interesting
tocheckif it is
easierfor
the
scanneroperatortoproducethecolor correction oncehe is
surethe
tonereproductionis
correct.
The
comparisonwasdone
by
judges
thatwereonly
analyzedfor
inter-judge
agreement,
and not
for
visualcolordeficiency
orcolor preferences.The
number ofjudges
usedwaslimited
due
to theavailability
ofqualifiedjudges.
The judges
were studentsthathad
asolidtheoretical
background but may
nothave had
the practical experienced that customersENDNOTES FOR THE CHAPTER V
1.-
Public Opinion
Quarterly, Vol.19,
1955.
p.321-325. Reliability
ofcontent analysis:CHAPTER
VI
THE RESULTS
The
subjective evaluationby
the12 judges
was performed under standardviewing
conditions.
The data
collectedfor
the rejectionrate,
whichis
ameasurement ofthecolorseparation
acceptance,
and the color separation preferencebased
on tone reproductioncriteria are presented
in
appendixF,
tablesF-l
and tableF-2
respectively.The
timerecorded
for
all the operations performedby
the sixscanner operators are presentedin
appendix
F,
table
F-3.
With
the
data from
the tableF-2
the inter-judge
agreementstudy
was performed asit is
shown
in
tableF-4. To
compare allthejudges
toeachother,
66
evaluationsfor
theScott's
coefficient were