CAPITAL STRUCTURE INFLUENCE ON
CONSTRUCTION FIRM PERFORMANCE
Nur Faezah Jayiddin*, Anita Jamil**, Saiyidi Mat Roni***
Center for Diploma Programme, Multimedia University*, Malaysia, Faculty of Accountancy, Universiti Teknologi MARA, Melaka**, Accounting Research Institute, Universiti Teknologi MARA,
Malaysia. ***
ABSTRACT
The interconnectedness between capital structure and firm performance is a topic of high interest among scholars and management alike. The scholars tend to unveil the why segment of the relationship, while the management looks into the how side to promote capital structure policy which can optimise the firm performance. While many studies have looked into this relationship across multiple industries and spanning across decades of data, the current study trains its lens on Malaysian public listed company companies which operate in the construction sector, and with data window between 2010 to 2014. This specific sector was chosen for their high gearing which renders firms to relatively high insolvency exposure emanating from interest rate fluctuations. The five-year timeframe was selected to isolate potential data contaminations streaming from global financial crisis which winds down in 2009. Financial data of the company were extracted from Bloomberg Terminal based on a pre-prepared list of Bloomberg tickers. A total of 225 observations were recorded in this study. Using Tobin’s Q as a proxy for firm performance, this study finds a mixed result where short term debts ratio indicates a significant negative effect, while long term debt ratio presents a non-significant influence. Explanations on this output are therefore discussed in this paper.
Keywords:Capital structure, firm performance, panel data, debt ratio.
INTRODUCTION
Capital structure has been a popular research topic among the financial scholars. As such various studies were conducted to examine the effect of capital structure decision and firm performance (Adami, Gough, Muradoğlu, & Sivaprasad, 2013; Collins, Filibus, & Clement, 2012; David & Olorunfemi, 2010; Dawar, 2014; Hasan, Ahsan, Rahaman, & Alam, 2014; John, 2013; Khan, 2012). There are numerous research conducted to examine the relationship between capital structure and firm performance in developing countries such as Nigeria (Akeem, K, Kiyanjui, & Kayode, 2014; Collins et al., 2012; David & Olorunfemi, 2010), India (Chisti, Ali, & Sangmi, 2013; Dawar, 2014), Bangladesh (Hasan et al., 2014) and Jordan (Zeitun & Tian, 2007). As for example research conducted by Zeitun and Tian (2007) in Jordan which aim to investigate and examine the effect of capital structure on corporate performance using a panel data sample representing of 167 Jordanian companies during 1989-2003. Based on the finding, they found that firm’s capital structure had a significantly negative impact on the firm’s performance measurement for both accounting and market’s measures in Jordan which is one of developing country.
from year 1995 to 2011. The researchers measured capital structure based on short-term debt ratio (STDR), long-term debt ratio (LTDR), total debt ratio (TDR) and growth (% of total asset). While the firm performance are proxy by both accounting measure and market measure which is ROA, ROE, Tobin’s Q and earning per share (EPS). One control variable is use in the research study which is the firm size. The researcher focused on six industries in Malaysia namely construction industry, consumer industry, industrial product industry, plantation industry, property industry and trading and services industry. The researcher found that there is negative relationship between short-term debt (STD), long-term debts (LTD) and total debts (TD) with return on asset (ROA), return on equity (ROE) and earnings per share (EPS). Other than that, the study also found that there is significant positive relationship between short-term debts (STD) and long-term debts (LTD) to Tobin’s Q.
There are two main issue to be highlighted in research done by Salim and Yadav (2012). The first issue is related to the findings which cover a long economic period from 1995 to 2011 and the second issue is related to the various industries covered in the study. Research conducted by Salim and Yadav (2012) shows various results regarding the relationship between capital structure and firm performance since they utilize various independent variable and dependent variable and tested on six industries in Malaysia. While the results provide meaningful insights, it also leads to a question whether the trends pointed in their study (and others) still relevant within a smaller context – industry specific. Therefore, this study attempts to uncover if the contentions are still consistent in post-Asian financial crisis for construction industry. The construction industry is chosen because the industry is capital intensive leading to relatively more susceptible to economic shocks.
LITERATURE REVIEW
There are differences between financial structure and capital structure as financial structure is related to the various ways a firm can use to raise its funds while capital structure represents the proportionate relationship between the long-term debt and equity capital (Pandey, 1999). Capital structure plays an important role in a firm especially when the firm wants to fulfil the need of their stakeholders through payment of dividend, payment of debt, payment of salaries on time and other financial obligation (Opoku & Adu, 2012). Capital structure is normally made of equity capital, preference capital and long-term loan (debt) capital. Debt capital such as long-term bonds is used by the firm to finance its investment decision by paying back the principal and interest in return. The combinations of different capital types will have differing impacts on firm performance. This is because each capital type has its own cost and incentives for the firms, thus defining or influencing the way the firms operate.
The result of a firm performance is the output where the stakeholders hope for a positive outcome. One of the debatable issues in finance is regarding the idea or concept of performance due to its multi-dimensional meanings (Zeitun & Tian, 2007). Study related to firms performance originates from organization theory and strategic management (Murphy, Trailer, & Hill, 1996). Performance measure can be divided into two categories which are financial performance or organizational performance. Profit maximization, maximizing profit on assets and maximizing shareholders’ value are examples of measurement for financial performance. On the other hand, operational performance such as growth in sales and growth in market share referring to a wide definition of performance since they focus on determinants that contribute to financial performance (Hofer & Sandberg, 1987).
In this study, the firm’s performance was measured using Return on Asset (ROA). ROA is widely known as the most useful measure to determine the firms’ performance (Long & Ravenscraft, 1984; Reece & Cool, 1978). ROA is viewed as a proxy to measure the ability of management to employ the asset within their control efficiently regardless of the source of financing (Ebrati, Emadi, Balasang, & Safari, 2013). Among the financial ratio, ROA is found to be the most popular and useful financial ratio. ROA can be derived by dividing net income plus interest expenses with total assets (Ebrati et al., 2013; Khan, 2012). The ratio was introduced by DuPont company back in 1919 where they used it as the top of their ratio triangle system (Jewell & Mankin, 2011). Since then, ROA has been used in the industry until now. Gibson (1987) conducted a survey toward Chartered Financial Analyst to investigate the importance of financial ratio. Based on the finding by Gibson (1987), all four different version of ROA was selected by at least 90% of the respondent as the main measure of profitability.
METHODOLOGY
This study aims to examine the relationship between the capital structure and firm performance in Malaysian construction public listed company (PLC) during the stable economic growth from 2010 to 2014. This study focus construction industry only as compared to study done by Salim and Yadav (2012) which include various industry in the research study. The range of year from 2010 to 2014 were selected because the Malaysia’s quarterly Real Gross Domestic Product (RGDP) rate from 2010 to 2014 showed a positive economic growth (Bank Negara
Malaysia’s Quarterly Bulletin, n.d.).
A series of financial data were collected from a total of 45 construction companies listed in Bursa Malaysia as at August 2015. All companies listed in Bursa Malaysia under construction industry were selected. This means the entire population of construction companies are included in the study. Financial data of the company were extracted from Bloomberg Terminal. Prior of extracting data from the Bloomberg Terminal, a list of Bloomberg ticker were prepared to identify the company uniquely in Bloomberg to avoid any error in data extraction. A total of 225 observations were recorded in this study.
R-Statistic with an interface of R Studio version 0.99.486 were used to analyse the date. The primary package for this panel data analysis was PLM version 1.5-12. PLM package are useful to make an estimation of linear panel models straightforward and it provides allows to estimate various models and to make a robust inferences (Croissant & Millo, 2008). In order to capture the relationship between the capital structure and firm performance, this study formulates the following panel regression model:
it i it it
it it
it
it X X X X X u
y
01 1 2 2 3 3 4 4 5 5Where yitis alternately Return on Assets (ROA) for firm, as a measure of performance
of i in yeart.
1
X = Short-term debt (STDR)
2
X = Long-term debt (LTDR)
3
X = Total debt (TDR)
4
5
X = Firm’s Size (SIZE)
i
= Unobserved or heterogeneity effect; andit
u = residual error of firm iin year t
RESULTS AND DISCUSSIONS
Descriptive Statistic
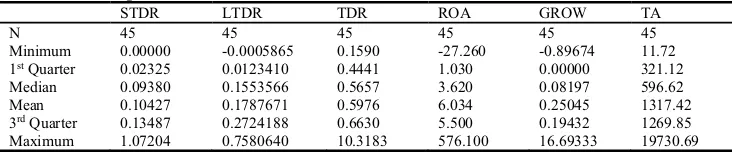
[image:4.482.45.411.237.313.2]In this study, descriptive analysis that covered minimum amount, 1st quarter amount, median amount, mean amount, 3rd quarter amount and maximum amount of the data set were presented. Error! Reference source not found.below shows the descriptive statistic for independent variable, dependent variable and control variable used in the study.
Table 1. Descriptive statistics
STDR LTDR TDR ROA GROW TA
N 45 45 45 45 45 45
Minimum 0.00000 -0.0005865 0.1590 -27.260 -0.89674 11.72 1stQuarter 0.02325 0.0123410 0.4441 1.030 0.00000 321.12 Median 0.09380 0.1553566 0.5657 3.620 0.08197 596.62 Mean 0.10427 0.1787671 0.5976 6.034 0.25045 1317.42 3rdQuarter 0.13487 0.2724188 0.6630 5.500 0.19432 1269.85 Maximum 1.07204 0.7580640 10.3183 576.100 16.69333 19730.69
Based on the descriptive statistic, the mean (ܺ) or average for return on asset (ROA) for construction industry from 2010 to 2014 is 6.0%. The mean for both ROA shows that the performance of construction firms in Malaysia from 2010 to 2014 is positive. Other than that, from the mean of ROA, it is obvious that construction firms in Malaysia have a slightly higher accounting performance compared to the overall market.
The minimum amount of ROA is -27.26% and the maximum amount for ROA is 576.10%. The interquartile range which is the difference between the 1st quartile and the 3rd quartile for ROA is 4.47%. This indicates that some of the construction firms are highly profitable as the maximum ratio stands at 576%.
As for short-term debt ratio (STDR), the minimum amount starts at 0% and maximum amount is 1.07% with a mean scored of 0.10%. The interquartile range for STDR is 0.11%. On the other hand, the long-term debt ratio (LTDR) recorded a minimum of -0.00% and a maximum amount of 0.76% with a mean of 0.17%. The interquartile range for LTDR is 0.26%. The mean score for LTDR is slightly higher compared to STDR by 0.07%. This shows that constructions firms in Malaysia utilized more long-term debt compared to short-term debt in the positive economic growth. It is interesting to note that construction companies started to increase their long-term debt to finance its business during positive economic growth in this study which cover from 2010 to 2014.
[image:4.482.45.441.614.666.2]Capital structure and return on asset
Table 2. Capital structure effects on ROA
Coefficients: Estimate Std. Error t-value Pr(>|t|)
STDR -19.278 32.755 -0.5886 0.556907
LTDR -1.6402 25.339 -0.0647 0.948461
TDR -13.6891 4.2432 -3.2267 0.001495**
GROW 1.8707 2.3763 0.7873 0.432197
SIZE -0.00084895 0.00497902 -0.1708 0.864573
R-Squared 0.069105
F- Statistic 2.59821
p-value 0.027019
Note: ***, **, * Coefficients are significant at the 1%, 10% and 5% levels
The results are based on fixed effect modelafter considering outputs from Haussman Test.
ROA = net profit divided by total assets; STDR = short-term debt to total assets; LTDR = long term debt divided by long term debt plus equity; TDR = total asset minus total equity divided by total asset; GROW= annual growth rate of total asset; SIZE= total asset
Table 2 presented the relationship between capital structure and construction firms’ performance in Malaysia based on ROA. F-test is used in this study to test whether the variation in the independent variable explained a significant portion of the variation in the dependent variable in the overall model. The F-statistic value of 2.59821 (p < 0.05), show that the independent variables are jointly statistically significant in the fixed estimates in explaining the dependent variables which is ROA. R2 statistics value of 0.069 implies that the independent
variables jointly account for about 6.9% variation on firm performance in the fixed effect model for ROA.
Further, only TDR has a significant negative relationship with ROA (TDR: β = -13.6891, p < 0.01) which means that one unit change in total debt will reduce ROA by -13.6891 unit. Other independent variables such as STDR, LTDR, GROW and SIZE show a negative relationship. However, the relationships are not statistically significant.
The result shows that STDR has no significant relationship to the ROA in construction firms in Malaysia (STDR: β = -19.278, p>0.05). The insignificant relationship between the STDR and accounting based measure which is ROA indicates that STDR has no significant impact on returns of construction firms in Malaysia. This result is consistent with the study by Ebrati, Emadi, Balasang, and Safari (2013), Hamid, Abdullah, and, Kamaruzzaman (2015), Hasan, Ahsan, Rahaman, and Alam (2014), Khan (2012), Olokoyo (2013), and Taani (2013). Table 2 also shows that the relationship between LTDR and ROA in construction firms in Malaysia is not statistically significant (LTDR: β= -1.6402, p > 0.05).
This result is align with the findings by previous researcher such as (Akeem et al., 2014; Ebaid, 2009; Ebrati et al., 2013; Gill, Biger & Mathur, 2011; and John, 2013). In United States, Gill et al. (2011) analyse the relationship between the capital structure and firm performance among the American service and manufacturing firms from 2005-2007 and they also found the insignificant relationship between long-term debt to accounting performance in service industry. They claim that American firms that operated in service industry recorded a higher gearing ratio. When firms utilize a higher gearing ratio, the profitability for the firms will reduce subsequently and the tax benefit also will start to disappear. Firms that operated in construction industry also may have a higher gearing ratio.
Table 2 also shows that there is significant negative relationship between TDR and ROA in construction firms in Malaysia (TDR: β= -13.6891, p < 0.01). A similar result were found by previous researcher in capital structure study such as Akeem et al. (2014), Azhagaiah (2007), Ebaid (2009), and Wahba (2013). Based on previous study in Malaysia, Hamid et al. (2015) found significant negative relationship between total debt and profitability for both family firms and non-family firms within firms listed in Bursa Malaysia for the year 2009-2011. This means firms will endure lower profitability as the amount of debt they employed increase. The researcher posit that profitable firms are depending on equity as their main financing choice (Shubita & Alswalhah, 2012).
Hamid et al. (2015) agree that the negative correlation between the total debts and the accounting performance support the pecking order theory introduce by (Myers, 1984). The concept of pecking order theory is related to the method firms choose their finance resources to support their operation which is firms prefer to utilize their internal funds obtained from retained earnings as first option for financing sources.
CONCLUSION
The contradiction between the general findings by Salim and Yadav (2012) and the findings by this study might happen due to several reasons. First is because the study done by Salim and Yadav (2012) ignored the macroeconomic indicator such as Gross Domestic Product (GDP) growth as the study selected a large data span which covers 17 years starting from 1995 to 2011. Along the duration of 1995 to 2011, there are two financial crises that happen in the global setting which affected Malaysia economy which is Asian Financial Crisis (AFC) 1997-1998 and Global Financial Crisis (GFC) that happen in 2007. This is important as Jong, Kabir, and, Nguyen (2008) found that the macroeconomic indicator such as real GDP growth give a significant impact towards capital structure.
Due to that, it can be note that study by Salim and Yadav (2012) has ignored the economic growth which might lead to contamination of data. The exclusion of the impact of the financial crisis in the study done by Salim and Yadav (2012) can cause bias toward their result findings. While as for this current study, the data chosen in this study were collected during the positive economic growth in Malaysia which is from 2010 to 2014 which covers 5 years span and are free from any financial crisis.
Secondly, the general findings by Salim and Yadav (2012) were obtained based on the different regression result of six different industry including construction industry. This may affect the validity of the findings as different industries sector have different capital structure and have different impact toward the firm performance (Bradley, Jarrell, & Kim, 1984; and Degryse, de Goeij, & Kappert, 2012). Thus, the general findings by Salim and Yadav (2012) cannot be used to reflect the impact of short-term debt to ROA for construction industry alone. While as for this study, it focuses specifically for construction industry.
the individual-specific effects that usually unobservable which may be correlated with other explanatory variables included in the regression model (Hausman & Taylor, 1981).
The extent to which the POLS bias the result lies beyond the scope of the current study. However, as the result shows, the contradicting results between the current study and study done by Salim and Yadav (2012) provide a strong indication that heterogeneity in sample affects the generalizability of the results of the latter. While Salim and Yadav (2012) provides the general idea of the effect of capital structure on firm’s performance, the current study look deeper into industry specific relationships of the variables. Given this contradictions and similarities, future policies on capital structure compositions should be made with precaution. We believe industry-specific and economic growth should be accounted for.
REFERENCES:
Abubakar, S. Y. (2002). Migrant Labour in Malaysia : Impact and Implications of the Asian Financial Crisis. Crisis, (January), 1–44.
Akeem, L. B., K, E. T., Kiyanjui, M. W., & Kayode, M. (2014). Effects of Capital Structure on Firm ’ s Performance : Empirical Study of Manufacturing Companies in Nigeria,
3(4), 39–57.
Azhagaiah, R. (2007). The Impact of Capital Structure on Profitability, 9, 371–392.
Baharuddin, N. S., Khamis, Z., Mahmood, W. M. W., & Dollah, H. (2011). Determinants of capital structure for listed construction companies in Malaysia. Journal of Applied …, 1(2), 115–132. Retrieved from http://scienpress.com/upload/JAFB/Vol 1_2_6.pdf
Bradley, M., Jarrell, G. a, & Kim, E. H. (1984). On the Existence of an Optimal Capital Structure: Theory and Evidence. Journal of Finance,39(3), 857.
http://doi.org/10.2307/2327950
Chisti, K. A., Ali, K., & Sangmi, M. (2013). Impact of Capital Structure on Profitability of Listed Companies ( Evidence From India ). The USV Annals of Economics and Public Administration,13(1), 183–191.
Collins, O. S., Filibus, I. E., & Clement, A. A. (2012). Corporate Capital Structure and Corporate Market Value: Empirical Evidence from Nigeria. International Journal of Economics and Finance,4(12), 193–202. http://doi.org/10.5539/ijef.v4n12p193 David, D. F., & Olorunfemi, S. (2010). Capital Structure and Corporate Performance in
Nigeria Petroleum Industry : Panel Data Analysis. Journal of Mathematics and Statistics 6,6(2), 168–173.
Dawar, V. (2014). Agency theory, capital structure and firm performance: some Indian evidence. Managerial Finance,40(12), 1190–1206. http://doi.org/10.1108/MF-10-2013-0275
Degryse, H., de Goeij, P., & Kappert, P. (2012). The impact of firm and industry
characteristics on small firms’ capital structure. Small Business Economics,38(4), 431– 447.http://doi.org/10.1007/s11187-010-9281-8
evidence from Egypt. The Journal of Risk Finance,10(5), 477–487.
http://doi.org/10.1108/15265940911001385
Ebrati, M. R., Emadi, F., Balasang, R. S., & Safari, G. (2013). The Impact of Capital Structure on Firm Performance : Evidence from Tehran Stock Exchange. Australian Journal of Basic and Applied Scienc,7(4), 1–8.
Gibson, C. (1987). How Chartered Financial Analysts View Financial Ratios. Financial Analysts Journal,43(3), 74–76.
Gill, A., Biger, N., & Mathur, N. (2011). The Effect of Capital Structure on Profitability: Evidence from the United States. International Journal of Management,28(4), 3–15.
Hamid, M. A., Abdullah, A., & Kamaruzzaman, N. A. (2015). Capital Structure and Profitability in Family and Non-Family Firms : Malaysian evidence. Procedia
Economics and Finance,31(15), 44–55.http://doi.org/10.1016/S2212-5671(15)01130-2
Hasan, M. B., Ahsan, a. F. M. M., Rahaman, M. A., & Alam, M. N. (2014). Influence of Capital Structure on Firm Performance: Evidence from Bangladesh. International Journal of Business and Management,9(5), 184–194.
http://doi.org/10.5539/ijbm.v9n5p184
Hausman, J., & Taylor, W. (1981). Panel data and unobservable individual effects. Econometrica: Journal of the Econometric Society,49(6), 1377–1398.
http://doi.org/10.2307/1911406
Hofer, C. W., & Sandberg, W. R. (1987). Improving New Venture Performance: Some Guidelines for Success. American Journal of Small Business,12(1983), 11.
Hung, C. Y., Albert, C. P. C., & Eddie, H. C. M. (2002). Capital structure and profitability of the property and construction sectors in Hong Kong. Journal of Property Investment & Finance,20(6), 434–453. http://doi.org/10.1108/14635780210446469
Jewell, J. J., & Mankin, J. a. (2011). What Is Your Roa ? an Investigation of the Many Formulas for Calculating Return on Assets. Academy of Educational Leadership Journal,15(1980), 79–91.
John, A. O. (2013). Effect Of Capital Structure On Firm Performance : Evidence From Nigerian Manufacturing Industry. International Journal of Innovative Research and Studies,2(9), 469–480. Retrieved from http://www.ijirs.com/vol2_issue-9/40.pdf
Khan, A. G. (2012). The relationship of capital structure decisions with firm performance: A study of the engineering sector of Pakistan. International Journal of Accounting and Financial Reporting,2(1), 245–262. http://doi.org/10.5296/ijafr.v2i1.1825
Long, W. F., & Ravenscraft, D. J. (1984). The Misuse of Accounting Rates of Return: Comment. The American Economic Review,74(3), 494–500.
Manawaduge, A., Zoysa, A. De, & Chowdhury, K. (2011). Capital Structure and Firm Performance in Emerging Economies : an Empirical Analysis of Sri Lankan Firms.
Murphy, G. B., Trailer, J. W., & Hill, R. C. (1996). Measuring performance in entrepreneurship research. Journal of Business Research,36(1), 15–23.
http://doi.org/10.1016/0148-2963(95)00159-X
Olokoyo, F. O. (2013). Capital Structure and Corporate Performance of Nigerian Quoted Firms : A Panel Data Approach. African Development Review,25(3), 358–369.
Opoku, E. F., & Adu, J. K. (2012). The Impact of Capital Structure and Profitability of Listed Banks on the Ghana Stock Exchange. Social and Basic Sciences Research Review,1(2), 74–91.
Pandey, I. . (1999). Financial Management (8th ed.). New Delhi: Vikas Publishing House Pvt. Ltd.
Reece, J. S., & Cool, W. R. (1978). Measuring Investment Center Performance. Harvard Business Review,56(3), 28.
Salim, M., & Yadav, R. (2012). Capital Structure and Firm Performance: Evidence from Malaysian Listed Companies. Procedia - Social and Behavioral Sciences,65(ICIBSoS), 156–166.http://doi.org/10.1016/j.sbspro.2012.11.105
Seetanah, B., Seetah, K., Appadu, K., & Padachi, K. (2014). Capital structure and firm performance : evidence from an emerging economy. The Business {&} Management Review,4(4).
Taani, K. (2013). The Relationship between Capital Structure and Firm Performance: Evidence from Jordan. Global Advanced Research Journal,2(11), 542–546.
Wahba, H. (2013). Capital structure, managerial ownership and firm performance: evidence from Egypt. Journal of Management & Governance,18(4), 1041–1061.
http://doi.org/10.1007/s10997-013-9271-8
Wooldridge, J. (2015). Introductory Econometrics: A Modern Approach (6th ed.). United States: Cengage Learning.