Improved methods of complex estimation of efficiency of
activity of industrial organizations
E.H. 1, Y.V. Lysenko1, and T.N. Myznikova1,* 1
South Ural State University, Chelyabinsk, Russia
Abstract. The article substantiates the need for combined technological, technical, financial and economic indicators that characterize the efficiency of production and economic activity of an industrial enterprise. Stages of performance evaluation: from single to integrated assessment criteria. It named the main drawback of the existing methods of constructing a system of indicators, which leads to subjectivity, to a lack of real understanding of the financial and economic state of the industrial organization. It is shown that multivariate statistical methods of classification can not only minimize their number, but also to detect correlations for each cluster, as well as to build a multi-factor regression models, which are the basis of perfection of a technique of an integrated approach to assessing the results of functioning of the organization. Thus, the algorithm for determining the integral index of evaluating the performance of the company contributes to an objective vision of the ways to improve operational and financial performance of industrial organizations.
1 Introduction
The relevance of this article lies in the fact that the increase of efficiency of functioning of industrial organizations - one of the most important economic problems, the solution of which depends on the level of development of the industrial sector, and hence the rise of living standards of the population. To solve this problem is impossible without substantial investment and development of innovative technologies. Primarily, it refers to a precocious, high technology and high-tech industry, as the industry.
To support the industry and its transition to an innovative path of development it is important to ensure rational use of available resources and internal reserves to increase production, improve the efficiency and competitiveness of the industry's products. An integrated approach to solving a wide range of issues relating to the justification of the priorities of reconstruction and further development of the industry. This approach is based on an objective and comprehensive assessment of the processes, the aim of which is to determine the state of the organization and the potential for their further development.
Modern economics offers a variety of methodology for assessing the effectiveness of using a significant amount of production and financial performance. But, as practice shows, such orientation adversely affect the adoption of the strategic and operational management decisions leaders, which is difficult to navigate in a variety of disparate indicators and their derivatives financial ratios.
Thus, the issue of improving the assessment of efficiency of functioning of industrial organizations in modern conditions becomes relevant.
Hence the purpose of this article is to develop an algorithm for evaluating the performance of industry organizations.
2 Approaches to the assessment of
performance industry organizations
The theoretical analysis of the effectiveness of methods for assessing the activities of industry organizations has identified the following stages: an initial assessment carried out by a single criteria, then was used a system of indicators, at the present stage apply integrated assessment, obtained by the methods of multivariate analysis (Figure 1). [1, 2, 15 ].
In the first stage we have been allocated such individual factors as profit margins. But these figures do not allow to fully and objectively evaluate the effectiveness of the functioning of institutions, as their selection is carried out at random, based on the subjective views and preferences of analysts on the importance of certain criteria. Accordingly, the selected criteria do not reflect the real state of the organization, do not allow to build a reasonable forecast of its development.
have their particular industry. Therefore, evaluation of the effectiveness of activities designed only for a defined range of administrative tasks (identification of credit, drawing up the strategic development plan, receiving the auditor's report, etc.), carried out on the basis of a particular situation.
[image:2.595.57.287.286.596.2]In addition, the main drawback of currently existing methods of constructing a system of indicators is that the selection criteria carried out by experts. Hence, the subjectivity of the results, the lack of real understanding of the situation in the organizations, which complicates the work of the analyst. At the same time the desire of some of the authors included in the measurement of assessing the effectiveness of as many indicators are not always justified, as a number of indicators often duplicate each other, and some of them do not carry the semantic load.
Fig. 1. Classification of methodological approaches to the
assessment of the effectiveness of the industry organizations.
Our studies show that at the present stage to remove all the deficiencies noted: bias, subjectivity and one-sidedness - the procedure allows the calculation of the integral index, the methodological basis for the formation of which is multidimensional analysis. Methods cluster, discriminant, factor, component, and other types of analysis allow you to search and find out unlimited, heterogeneous and dispersed information unobvious and complex patterns, to acquire new knowledge. Thus, the integral value obtained by the methods of multivariate analysis, makes it possible, in contrast to the prior art, not only to assess the effectiveness of the
organization, but also to suggest ways of its development, see the directions of optimization of management and production structures to build a competent marketing and investment politicians.
3 Cluster analysis
The main method to categorize multivariate observations is cluster analysis, with which you can break the set of monitored parameters of the set of industrial organizations into homogeneous subsets [3, 13, 11].
Data territorial body of the Federal Service on the performance of industrial companies within five years of the state statistics of the Chelyabinsk region is used as a source of information. In order to avoid distortion of the results of cluster analysis of the influence of baseline measurement units last were normalized in terms of "revenue from sales of products." Dendrogram conducted multivariate classification is shown in Fig. 2, where it is possible to distinguish three typological groups of industrial organizations of Chelyabinsk region [4, 5, 9].
Fig. 2. Dendrogram multidimensional classification of
industrial organizations: 1 - OJSC "Chelyabinsk Tube Rolling Plant"; 2 - JSC "Trubodetal"; 3 - OJSC "Chelyabinsk Metallurgical Plant"; 4 - OJSC "Chelyabinsk Mechanical Plant"; 5 - JSC "Chelyabinsk Compressor Plant"; 6 - LLC "Chelyabinsk Tractor Plant - URALTRAC"; 7 - OJSC "Chelyabinsk Forging Plant".
Cluster I comprises a single organization, which is one of the major industrial producers in the area: "Chelyabinsk Tube Rolling Plant". This cluster is characterized by high levels of efficiency of its functioning.
Cluster II combines objects traditionally produced in terms of the effectiveness of secondary evaluation and having an average competitiveness. It includes OAO "Chelyabinsk Metallurgical Plant" and OJSC "Chelyabinsk Mechanical Plant".
System Multivariate
analysis Indicators of Performance Assessment
industrial organizations
Single
Profitability of spending for each product
Return on sales
Coefficient of rhythmicity
Capital productivity
The impact of resources
Economy
Component
Factor
Cluster
Discriminant
Neural networks
Decision trees
Self-organizing
maps The complex
coefficient organization of production
The total effect of production
Comprehensiv e performance
indicators of industrial organizations
Gross regional product
7 6 5 4 3 2 1
0,0 0,1 0,2 0,3 0,4 0,5 0,6 0,7 0,8 0,9
cluster III cluster II cluster I
7 6 5 4 3 2 1
Di
st
an
ce
co
m
b
ini
n
g
clu
st
er
s
o
f
u
ni
[image:2.595.309.534.333.570.2]Cluster III concentrates a remaining industrial organizations. This group is characterized by low efficiency of activity: the simple process of reproduction it is not provided.
4 The discriminant analysis of multiple
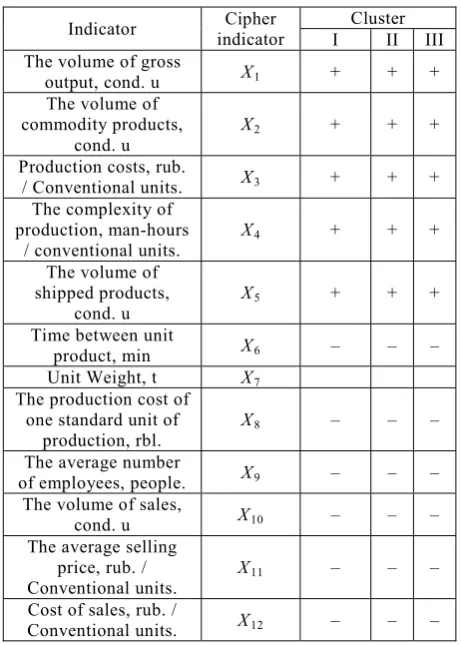
[image:3.595.308.538.151.314.2]The resulting group typical industrial organizations were subjected to further study using the statistical analysis of multiple discriminant, the essence of which is that between the selected variable characteristics and grouping correlation set. Thus, for each cluster we identified five relevant variables (Table 1) which determine the efficiency product [6, 12, 20].
Table 1. Indicators that determine the efficiency of the
industrial organizations on the results of the discriminant analysis.
Indicator Cipher
indicator
Cluster
I II III
The volume of gross
output, cond. u ɏ1 + + +
The volume of commodity products,
cond. u
ɏ2 + + +
Production costs, rub.
/ Conventional units. ɏ3 + + +
The complexity of production, man-hours
/ conventional units.
ɏ4 + + +
The volume of shipped products,
cond. u
ɏ5 + + +
Time between unit
product, min ɏ6 – – –
Unit Weight, t ɏ7
The production cost of one standard unit of
production, rbl.
ɏ8 – – –
The average number
of employees, people. ɏ9 – – –
The volume of sales,
cond. u ɏ10 – – –
The average selling price, rub. / Conventional units.
ɏ11 – – –
Cost of sales, rub. /
Conventional units. ɏ12 – – –
Checking the closeness of the connection between the derived variables (multicollinearity) based on the analysis of the matrix of paired correlation coefficients allowed to exclude from further calculation of a number of indicators: the gross output (X1) and the volume of commodity output (X2), as their simple correlation coefficients were more than 0.8 .
To show the impact of the remaining indicators: production cost (X3), the complexity of production (X4), the volume of products shipped (X5) - the
financial results of activity of the organizations of each cluster (YI, II, III) were constructed multivariate regression models of industrial organizations focused for-profit (Table 2).
Table 2. Regression models of industrial companies focused
on making a profit.
Cluster
number The regression equation
Coeffi cient determi
nation (R2)
I
YI= –0,42 – 0,38ɏ3 + 1,30ɏ4 + 0,74ɏ5 2215 < ɏ3 < 4933; 3 < ɏ4 < 10; 291
< ɏ5 < 421
0.953
II
YII= 2,49 + 0,33ɏ3 – 0,63ɏ4 – 2,28ɏ5 4272 < ɏ3 < 5306; 6 < ɏ4 < 13; 360
< ɏ5 < 419
0.875
III
YIII = –1,25 – 0,65ɏ3 + 1,44ɏ4 – 0,21ɏ5
9716 < ɏ3 < 19167; 75 < ɏ4 < 118; 88 < ɏ5 < 226
0.726
According to Table. 2 You can make the following conclusions.
In a cluster I profit organizations, achieved through a combination of intensive and extensive factors of production. This is evidenced by the fact that the financial result is determined by a decrease in the cost per unit of production and increasing the complexity.
In cluster II the growth of a productive indicator opposite situation cluster I. Algebraic signs with phrases X3 and X5 indicate the extensive nature of production and, moreover, inefficient use of resources.
A characteristic feature of cluster III is a surplus of labor force, as reflected in the resulting regression model. Use in this segment, as compared to other, larger proportion of human labor in conjunction with the inefficient use of resources makes manufacture unprofitable.
In general it can be noted that the industrial organization of the Chelyabinsk region at the moment, except for a few large ones, do not focus on the application of innovative technologies for the reduction of material, energy and labor resources in the production process [7, 14, 19].
5 Algorithm for Integral indicators of
organizational performance
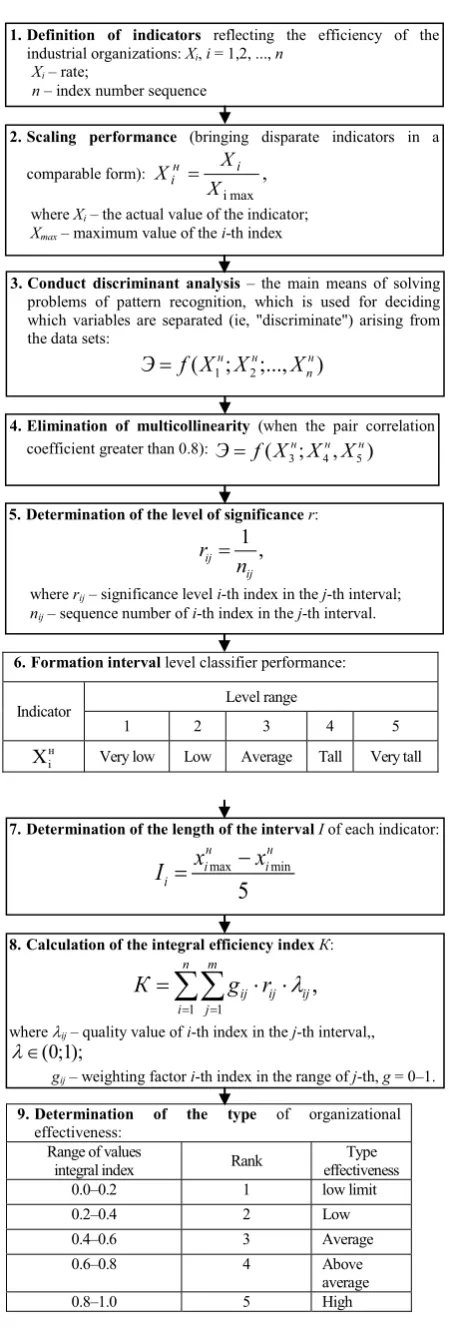
The developed algorithm for estimating the efficiency of organizations in industry involves the following steps (Fig. 3) [8, 16, 18].
[image:3.595.55.286.293.616.2]Table 3. Qualifier detection level range of performance indicators.
Indicator Level range
Very low Low Average Tall Very tall
1 x1<8300 8300<x1<16600 16600<x1<24900 24900<x1<33200 33200<x1
2 2<60 60<x2<120 120<x2<180 180<x2<240 240<x2
Weights levels 0.9 0.7 0.5 0.3 0.1
3 3<102 102< x3<204 204<x3<306 306< x3<408 408<x3
Weights levels 0.1 0.3 0.5 0.7 0.9
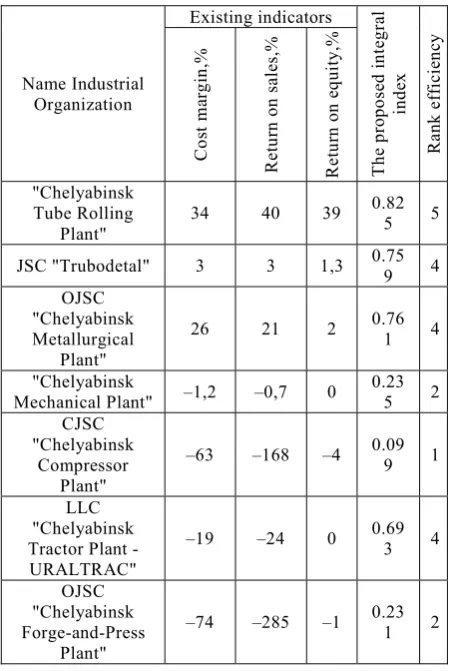
The results of evaluating the performance of industrial enterprises of the Chelyabinsk region are presented in Table 4.
Table 4. Determination of the effectiveness of the type of
Industrial Organizations.
Name Industrial Organization
Existing indicators
The
pr
o
p
o
se
d i
n
te
gr
al
in
de
x
Rank eff
ici
en
cy
Co
st
ma
rg
in
,%
R
e
tu
rn
on
sal
es,%
R
e
tu
rn
on
eq
ui
ty,%
"Chelyabinsk Tube Rolling
Plant"
34 40 39 0.82
5 5
JSC "Trubodetal" 3 3 1,3 0.75
9 4
OJSC "Chelyabinsk Metallurgical
Plant"
26 21 2 0.76
1 4
"Chelyabinsk
Mechanical Plant" –1,2 –0,7 0 0.23
5 2
CJSC "Chelyabinsk
Compressor Plant"
–63 –168 –4 0.09
9 1
LLC "Chelyabinsk Tractor Plant -
URALTRAC"
–19 –24 0 0.69
3 4
OJSC "Chelyabinsk Forge-and-Press
Plant"
–74 –285 –1 0.23
1 2
According to the traditional method of evaluating the performance of only three organizations are positive margins.
In developed algorithm, one industrial organization has a high level of efficiency of functioning - OJSC "Chelyabinsk Tube Rolling Plant". Above average level of efficiency of functioning "Trubodetal", OJSC "Chelyabinsk Metallurgical Plant" and JSC "Chelyabinsk Tractor Plant - URALTRAC". Stragglers - by a combined indicator of efficiency of operation of less than 0.3 - are the three companies within the cluster III: "Chelyabinsk Mechanical Plant", JSC "Chelyabinsk Compressor Plant", OJSC "Chelyabinsk Forging Plant".
This algorithm for determining the integral index of functioning efficiency evaluation reveals the real potential of the organization. The special significance of the proposed algorithm is that it can help managers can see ways of improving operational and financial performance, and potential investors receive a tool to see the investment attractiveness of the interest of their organizations [10, 17].
6 Conclusion
1. The tendency to assess the effectiveness of industrial enterprises shows the transition from the simple use of disparate criteria that describe the technological, technical, economic, financial and other state organizations, to the integral index, obtained by the methods of multivariate analysis, formed taking into account all the characteristics of the variety, typical of large economic systems, under which can be understood as a branch, and individual industry organizations.
2. Conduct a cluster analysis allowed to divide the totality of these objects into three groups, characterized by homogeneity, the presence of common problems and similar disabilities affecting the results of operations.
Using discriminant analysis, combined with a procedure to eliminate the multicollinearity between the indices has made it possible for each cluster to identify those that best meet the objective of increase of productivity of functioning of industrial organization through identified indicators: production cost, labor intensity of production, the volume of products shipped.
3. The use of multivariate analysis has allowed a high degree of reliability of approximation to construct multivariate regression models. The analysis identified the characteristics of combinations made it possible to establish their optimal values that maximize the financial results for each cluster.
Fig. 3. The algorithm for evaluating the performance of industrial organizations.
The work was supported by Act 211 Government of the !#$&$>?!K!?>K?Z\^_`\{_^|_\\||.
References
1. V.V. Joffe, Estimation of economic stability of industrial enterprise (Irkutsk, 2005)
2. V.M. Simchera, Methods of multivariate statistical data analysis (Finance and Statistics, Moscow, 2008) 3. M.V. Bushmanova, T.A. Dubrova, N.A. Mochalkin,
Cluster analysis. Conducting multivariate classification methods of observation of cluster analysis in “Statistica” package (Bauman, Magnitogorsk, 2002)
4. Chelyabinsk region: Statistical Yearbook, the Federal State Statistics Service, the territorial body of the Federal State Statistics Service of the Chelyabinsk region (2008)
5. Scenario conditions for the functioning of the Russian economy, the basic parameters of the forecast of social and economic development of the Russian Federation for 2016 and the planning period of 2017 and 2018 6. S.A. Nedosekin, Audits and financial analysis, 2,
(2000)
7. P. Fishburne, Utility theory for decision-making (Science, Moscow, 1978)
8. S.A. Nedosekin, O.B. Maksimov, The new comprehensive index evaluation of the enterprise
financial condition.
http://sedok.narod.ru/sc_group.html.
9. V.I. Guard, Analysis of economic activity in the industry (High School, Minsk, 2005)
10. I. Prokopenko, K. Nort, Performance management and quality modular program, in 2 hours (Case, Moscow, 2001)
11. A.M. Dubrov, V.S. Mkhitaryan, L.I. Troshin, Multivariate statistical methods (Moscow, Finance and Statistics, 1998).
12. A. Khalafyan, Industrial Statistics. Quality control, process analysis, design of experiments in the package STATISTICA (LIBROKOM, Moscow, 2013)
13. R. Kaplan, D. Norton, The Balanced Scorecard. From strategy to action (Business Olympus, Moscow, 2008) 14. A.M. Pearls, M.K. Pearls, Russian Entrepreneurship, 6,
2, (2010)
15. I.V. Matyas, Math. ASU, 2-1(66), 253-262 (2010) 16. A. Vasiliev, Integral indicator of the efficiency of
economic activity of the enterprise. http // ekonomika.ru.
17. E.M. Panevina, Russian Entrepreneurship, 11, 2(147), 56-62 (2009)
18. T. Copeland, T. Koller, D. Murrin, The cost of companies. Assessment and Management (Business Olympus, Moscow, 2008)
19. EVA & Strategy. Stern Stewart & Co. Research. The Americas, 4, (2000).
20. Rappaport, Creating shareholder value: a guide for managers and investors (Free Press, New York, 1998) 1.Definition of indicators reflecting the efficiency of the
industrial organizations: Xi, i = 1,2, ..., n
Xi – rate;
n – index number sequence
2.Scaling performance (bringing disparate indicators in a
comparable form): ,
max i X
X Xiɧ i
where Xi – the actual value of the indicator;
Xmax – maximum value of the i-th index
3.Conduct discriminant analysis – the main means of solving problems of pattern recognition, which is used for deciding which variables are separated (ie, "discriminate") arising from the data sets:
1 2
(
ɧ;
ɧ;...,
nɧ)
ɗ I ɏ ɏ
ɏ
4.Elimination of multicollinearity (when the pair correlation coefficient greater than 0.8):
3 4 5
( ɧ; ɧ, ɧ) ɗ I ɏ ɏ ɏ
5.Determination of the level of significance r: 1
,
ij ij
r n
where rij – significance level i-th index in the j-th interval;
nij – sequence number of i-th index in the j-th interval.
7.Determination of the length of the interval I of each indicator:
max min
5
ɧ ɧ
i i
i
x
x
I
8.Calculation of the integral efficiency index Ʉ:
1 1
,
O
¦¦
n m ij ij iji j
Ʉ
J U
where Oij – quality value of i-th index in the j-th interval,,
(0;1);
O
gij– weighting factor i-th index in the range of j-th, g = 0–1.
9.Determination of the type of organizational effectiveness:
Range of values
integral index Rank
Type effectiveness
0.0–0.2 1 low limit
0.2–0.4 2 Low
0.4–0.6 3 Average
0.6–0.8 4 Above
average
0.8–1.0 5 High
6.Formation interval level classifierperformance:
Indicator Level range
1 2 3 4 5
i