2000
Utility of spectrum and wavelet analysis of heart
rate variability as a tool to assess orthostatic
intolerance
Kichang Lee
Iowa State University
Follow this and additional works at:https://lib.dr.iastate.edu/rtd Part of theBiomedical Engineering and Bioengineering Commons
This Dissertation is brought to you for free and open access by the Iowa State University Capstones, Theses and Dissertations at Iowa State University Digital Repository. It has been accepted for inclusion in Retrospective Theses and Dissertations by an authorized administrator of Iowa State University Digital Repository. For more information, please [email protected].
Recommended Citation
Lee, Kichang, "Utility of spectrum and wavelet analysis of heart rate variability as a tool to assess orthostatic intolerance " (2000). Retrospective Theses and Dissertations. 12342.
This manuscript has been reproduced from the microfilm master. UMI films
the text directly from the original or copy submitted. Thus, some thesis and
dissertation copies are in typewriter ^ce, while others may be from any type of
computer printer.
The quality of this reproduction is dependent upon the quality of the
copy submitted. Brol<en or indistinct print, colored or poor quality Illustrations
and photographs, print bleedtiirough, substandard margins, and improper
alignment can adversely affect reproduction.
In the unlikely event that the author did not send UMI a complete manuscript
and there are missing pages, tiiese will be noted. Also, if unautiiorized
copyright material had to be removed, a note will indicate the deletion.
Oversize materials (e.g., maps, drawings, charts) are reproduced by
sectioning the original, beginning at the upper left-hand comer and continuing
from left to right in equal sections witii small overiaps.
Photographs included in tiie original manuscript have been reproduced
xerographically in this copy. Higher quality 6" x 9" black and white
photographic prints are available for any photographs or illusti^tions appearing
in this copy for an additional charge. Contact UMI directiy to order.
Bell & Howell Information and Learning
By
Kichang Lee
A dissertation submitted to the graduate faculty
in partial fulfillment of the requirements for the degree of
DOCTOR OF PHILOSOPHY
Major: Biomedical Engineering
Major professors: Alison B. Flatau and Warren D. Franke
Iowa State University
Ames, Iowa
UMI^
UMI Microfom^9990467
Copyright 2001 by Bell & Howell Infomnation and Learning Company. All rights reserved. This microform edition is protected against
unauthorized copying under Title 17, United States Code.
Bell & Howell Infonnation and Learning Company 300 North Zeeb Road
P.O. Box 1346
Graduate College Iowa State University
This is to certify that the Doctoral dissertation of
Kichang Lee
has met the dissertation requirements of Iowa State University
CommjiteeMetriber
Committee Member
Committee Member
Co-major Professor
Co-major Professor
h^Iajor program
For the Gr
Signature was redacted for privacy.
Signature was redacted for privacy.
Signature was redacted for privacy.
Signature was redacted for privacy.
Signature was redacted for privacy.
Signature was redacted for privacy.
TABLE OF CONTENTS
I. GENERAL INTRODUCTION 1
1.1 Dissertation organization I
1.2 Introduction 1
II. LITERATURE REVIEWS 6
2.1 Cardiovascular physiology 6
2.2 Analysis of heart rate variability signal 22
III. REPRODUCIBILITY OF AUTONOMIC AND CARDIOVASCULAR
RESPONSES TO ORTHOSTATIC STRESS 39
Abstract 39
Introduction 40
Methods 41
Results 46
Discussion 49
References 54
Figure legends 58
IV. GENDER DIFFERENCES IN THE AUTONOMIC RESPONSES
TO ORTHOSTATIC STRESS 66
Abstract 66
Introduction 67
Methods 69
Results 72
Discussion 74
References 78
V. ANALYSIS OF HEART RATE VARIABILITY RESPONSES
USING THE WAVELET TRANSFORMS 87
Abstract 87
Introduction 88
Methods 90
Results and Discussion 95
References 100
Figure legends 103
VI. CONCLUSION 118
1.
GENERAL INTRODUCTION
1.1 Dissertation organization
This dissertation begins with an introduction and a review of pertinent literature
followed by three independent research papers that are to be submitted, and a conclusion.
Each paper has a specific introduction, methods, results, discussion, and references. The
literature review chapter is intended to provide a background on heart rate variability and
heart rate signal analysis. References cited within the introduction and literature review
sections are listed following the conclusion.
1.2 Introduction
Immediately after returning to Earth fi-om space, inadequate cardiovascular
adjustments to a one-gravity environment are not only an annoyance to astronauts but can
lead to flmctional incapacitation in the upright or standing position (Fritsch-Yelle et al.,
1996). This physiological phenomenon, called "orthostatic intolerance", is defined as the
inability of cardiovascular responses to maintain the homeostatic state of the body, primarily
typified by a sudden decrease in arterial pressure and cerebral blood flow, which causes
syncope, in other words, fainting (Convertino, 1984). This is a recognized consequence of
not only space flight but also prolonged standing and sudden standing from lengthened bed
rest (Fritsch-Yelle et al., 1994; Goldberger et al., 1986).
Upon returning to Earth from space, the increased gravitational force (from OG to IG)
results in shifting blood to the lower body. Consequently, venous retxam, stroke voltune,
cardiac output, arterial pressure, and the blood flow to cerebral regions decrease with
genders, and age groups (Hordinsky et al., 1981; Low et al., 1997). Many researchers have
employed a tool called lower body negative pressure (LBNP) to generate orthostatic stress in
humans (Blaber et al., 1995; Hughson et al., 1994; Lawler et al., 1998; Rowell et al., 1973;
Zoller et al., 1972), thereby enabling controlled physiologic response studies of difFerent
individuals subjected to similar orthostatic stress states.
Females and the elderly present higher heart rates and increased susceptibility to
presyncope when subjected to increased levels ofLBNP (El-Bedawi and Hainsworth, 1994;
Hordinsky et al., 1981). However, these findings are not universal since several studies have
indicated no orthostatic stress difference in tolerance between genders or even a higher
tolerance in females than males (Hudson et al., 1987; Ramaekers et al., 1998). Although
many researchers have demonstrated differences in tolerance to orthostatic stress between
gender and age groups (El-Bedawi and Hainsworth, 1994: Lawler et al., 1998; Low et al.,
1997; Ramaekers et al., 1998), no researchers have quantified the gender difference in
tolerance after controlling body size. In most of the previous research, the male groups were
considerably taller and heavier than the female groups (Frey and Hoffler, 1988; White et al.,
1996; White and Montgomery, 1996).
The extensive application of signal processing techniques to the medical field
provides a variety of tools to enable understanding of the biological systems of the body.
Analysis of the electrocardiogram, one of the unique and vital bioelectrical signals produced
in the body, and of heart rate signal fluctuations are the two most commonly used methods
for elucidation of the physiological and clinical condition of the heart.
Due to the enormously cumbersome numerical procedures associated with analysis of
the beat to beat variation in cardiovascular signals had received little attention until the
advent of digital computers (Appel et al., 1989). However, advances in digital processing
techniques and increase in data processing speed have facilitated steps such as feature
recognition, statistical signal analysis, and modem time or frequency domain analysis. As a
result, interest in HRV has increased dramatically over the past decade (Appel et al., 1989;
Kitney and Rompebnan, 1980) with HRV now becoming the accepted tool for describing
variations in consecutive cardiac cycles (Task Force, 1996).
HRV is capable of reflecting the interplay between factors that perturb the
cardiovascular system such as physical, psychological, and/or environmental stimuli (Appel
et al., 1989; Kitney and Rompelman, 1980). Homeostatic adjustments to these perturbations
are made primarily by autonomic modulation of the cardiac conduction system and the
baroreceptor-evoked reflex responses of changes in heart rate, cardiac output, and peripheral
vascular resistance.
The early approach to HRV was to perform simple statistical analysis of heart rate
data. However, since this method shows only the existence of changing physiological
conditions, which is an unspecific characteristic, the analysis of HRV patterns has recently
become of interest. Analysis of patterns and coherent features traced out by heart rate
fluctuations offers the potential for providing detailed structural and behavioral information
about underlying physiological mechanisms (Sayers, 1973).
Power spectral density analysis methods have been adapted to analyze patterns of
heart rate variations (Mathias et al., 1993; Pomeranz et al., 1985). Spectral analysis
decomposes a signal to its frequency components and quantifies the strength of different
interpret underlying patterns of neural control of the heart rate; the low frequency region of
beat to beat interval spectra (0.04 to 0.15 Hz) reflects both parasympathetic and sympathetic
neural activities while the high frequency region (0.15 to 0.4 Hz) reflects only
parasympathetic activity. However, because of the non-deterministic characteristics of PIRV
signal, full understanding and proper interpretation of HRV has not yet matured.
In the last few years, wavelet analysis techniques have been considered as an
alternative pattern analysis technique that more properly addresses the non-stationary nature
of HRV signals (Yang and Liao, 1997). However, wavelet transforms are not yet recognized
as a standard tool for analysis of HRV.
The proposed research is designed to analyze cardiovascular responses to orthostatic
stress using the combined knowledge from engineering (signal analysis), mathematics
(statistical analysis), and physiology (cardiovascular system). The main objectives of this
study are to:
1) Develop a LBNP platform for testing methods of HRV measurement and analysis.
2) Obtain data to test the hypothesis that cardiovascular responses and control mechanisms
of humans under the orthostatic stress conditions are correlated to information contained
in HRV data.
3) Determine the reproducibility of HRV indices and cardiovascular parameters that are
measured in response to a range of LBNP.
4) Implement HRV analysis tools using statistical, power spectral density, and wavelet
analysis techniques and assess the suitability of wavelet techniques as compared to the
other two techniques for characterizing HRV.
This study will demonstrate how knowledge from different fields such as engineering,
mathematics, and physiology can be integrated for analysis of the cardiovascular system
having potential benefits in practical applications related to orthostatic intolerance in patients.
The results of this research will provide: 1) the reproducibility of HRV responses to LBNP,
2) a comparison of wavelet and spectral analysis techniques as tools for assessment of
physiological responses to LBNP, and 3) an increased understanding of gender and body size
II.
LITERATURE REVIEWS
2.1 Cardiovascular physiology
2.1.1 Heart
The heart is often compared to a highly interactive pump that communicates with the
central nervous system to maintain homeostasis of the body. The heart consists of foiu*
chambers - two atria and two ventricles. The atria send blood into the ventricles which send
blood to the lungs and the systemic circulation system. The right side of the heart receives
venous blood from the systemic circulation system (peripheral tissues) and drives this blood
into the pulmonary circulation system to replenish the oxygen content and remove carbon
dioxide from the blood. The left side of the heart receives blood from the lungs and sends
this oxygen-rich blood into the systemic circulation system. The main function of the heart is
to keep blood flowing through die circulatory system in the body.
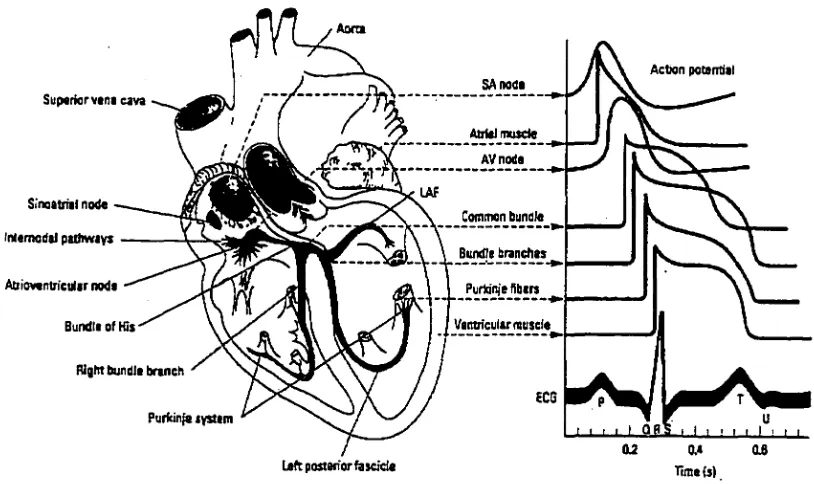
2.1.1.1 Electrical activity of the heart
The heart generates rhythmic electrical impulses to contract the heart muscle
(automaticity of the heart). These impulses are rapidly conducted throughout the heart by
specialized conductive tissues (Figure 1). In normal conditions, an impulse (action potential)
begins in the sinoatrial (SA) node, which has the capability of self-excitation. Impulses are
spread into both atria through three intemodal atrial pathways and eventually converge at the
atrioventricular (AV) node. The AV node and its associated conductive fibers delay the
transmission of the cardiac impulses from the atria into the ventricles. This delay allows time
for the atria to contract and shift their contents into the relaxed ventricles. The action
divided into two major bundle branches that radiate across the inner surfaces of the right and
left ventricles (Martini, 1992). The bundle branches are divided into smaller branches and
spread into the cardiac muscle fibers by way of specialized conducting cells, called "Purkinje
fibers" (Guyton et al., 1973). As a result of this depolarization stimulus, heart muscle
contraction occurs. This electrical activity of the heart can be measured by an
electrocardiograph.
An electrocardiograph is a valuable instrument to analyze the electrical activity of the
heart. As the cardiac impulse passes through the atria and ventricles, electrical currents
spread into the tissue surrounding the heart. The electrocardiograph records the electrical
potentials generated by these currents; fluctuations in potential represent the sum of the
action potentials of myocardial fibers (Figure 1) (Ganong, 1993). The normal
Actign potsffliil SAnodt
Suptriorvana cava
Atiteiinuacl*
Si'naatrfal notf«
Common bundle
imanwdtl padiwavs
Bundle branciias
Adiowntn'culir noda Purta'nie nbara
Vaotrfcularnusdt Bundia of His
RlgMbundla brtneh
Purfcin^tystara
Laftpoitanorbscicta Timds)
[image:14.596.73.480.412.654.2]electrocardiograph consists of a P wave, a QRS complex, and a T wave (Figure 1). The P
wave represents the atrial depolarization preceding atrial contraction, the QRS complex
represents the ventricular depolarization prior to ventricular contraction, and the T wave
represents the ventricular recovery from the ventricular depolarization. Figure 2 illustrates
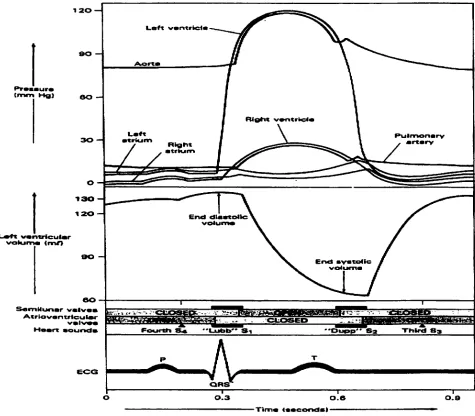
the coupling of the electrical activity of the heart with its mechanical activity.
eo
S«mMunar ~
Atrlovantrieutw sbh ES
FoortH
ORS
O O.a
Tlm«
[image:15.589.72.547.261.677.2]2.1.1.2 Normal heart rate
The average heart rate (HR) of normal adults is about 70 beats per minute (bpm) and
can range from 35 to 190 bpm (Chou and Timothy, 1996; Guyton, 1991). During sleep, the
HR diminishes by 10 to 20 beats (bradycardia) but can be accelerated (tachycardia) by
stimuli such as emotion, exercise, and fever (Berne and Levy, 1997; Ganong, 1993). The
normal HR varies with the respiration. During inspiration, HR increases and decreases
during expiration. This is a normal physiological phenomenon (sinus arrhythmia) as
described in the next section.
The HR of trained athletes is often < 50 bpm at rest suggesting improved performance
of the heart. Athletes have larger hearts and greater stroke volumes (SV) than nonathletes,
but athletes have less HR resulting in relatively similar resting cardiac outputs (CO) at rest
(Guyton, 1991). However, Hudson et al. (1987) have reported no significant difference in
HR between trained females and untrained females. Gender and age also affect the normal
HR. The elderly have faster HR than young adults and women have higher HR then men
(Chou and Timothy, 1996).
2.1.1.3 Neural control of the heart
Though the heart has its own intrinsic control systems, the working effectiveness of
the heart is highly adjusted by regulatory impulses from the central nervous system. The
central nervous system has two divisions of the autonomic nervous system, sympathetic and
parasympathetic, which have antagonistic effects on the heart. Both divisions of the
nodes. However, the SA node is the primary region of vigorous influence by both divisions
of the autonomic nervous system (Beme and Levy, 1997).
In the absence of any neuro-humoral influence, the intrinsic HR in people is about
100 to 120 bpm, e.g. heart transplant recipients. In the intact organism, responses to
perturbation factors are evident in HR changes as the net effect of the parasympathetic
(vagal), which slows HR, and the sympathetic, which accelerates HR. In resting conditions,
the vagal influence is dominant resulting in lower HR than the intrinsic HR. However, the
vagal activity declines and the sympathetic activity increases with increasing levels of
exercise. The HR response to a change in parasympathetic activity is extremely rapid,
occurring within a few milliseconds after vagal stimulation (Beme and Levy, 1997;
Hainsworth, 1995). The response of recovery is a little slower than that of the onset. In
general, HR returns to its previous level in less than 5 seconds after cessation of vagal
stimulation.
The alteration in HR in response to changes in sympathetic activity is much slower
than that of parasympathetic activity. The onset of sympathetic stimulation increases HR
progressively after about a 5-second latency period with HR reaching a steady level in 20 to
30 seconds (Beme and Levy, 1997; Hainsworth, 1995).
The sympathetic stimulation increases not only HR (chronotropic effect) but also
contractility (inotropic effect) of the heart muscle; therefore, the CO and SV increase. By
contrast, parasympathetic stimulation exerts a depressant effect by direct innervation via the
vagus nerve. Parasympathetic stimulation causes delayed impulse initiation (effect on SA
node) and conduction (effect on AV node) within the heart, resulting in a decreased HR and
distribution of vagal fibers on the ventricles, parasympathetic activity will decrease the
strength of heart's contraction by only 20 to 30 per cent, while sympathetic activity can
increase the contractility of the heart by over 100 per cent (Guyton, 1991).
The rhythmical variations in HR occur in normal individuals with the phases of
respiration; HR accelerates during inspiration and decelerates during expiration (Ganong,
1993). During inspiration, not only filling of the heart but also the volume in lungs is
increased, impulses in the vagi fi-om the stretch receptors in the atria and lungs inhibit the
cardioinhibitory area in the medulla oblongata and cause HR to rise (Ganong, 1993). During
expiration, the opposite effects occur.
2.1.2 Circulatory system
2.1.2.1 Blood flow
The human body is composed of trillions of cells which need continuous oxygen,
nutrients, and waste disposal to stay normal. The blood 1) transports dissolved gases such as
oxygen to the tissues and removes carbon dioxide fi-om the tissues, 2) distributes nutrients to
the tissues, 3) transports metabolic wastes firom tissues to excretion sites, and 4) delivers
hormones to target tissues. Consequently, the blood has to be continuously in motion to
maintain homeostasis.
Blood, like other fluids, flows firom high-pressure areas toward the relatively
low-pressiure areas. The flow rate is directly proportional to the difference in pressure (AP) and
inversely proportional to resistance (R) of the circulatory system. The difference in
circulatory pressxire is the difference in the systemic circuit that begins at the left ventricle
arterial pressure, and "peripheral resistance (PR)", which is the resistance of the arterial
system, are commonly used to describe blood flow. Blood flow can be described as:
AP _ A5P
F « or F w
R PR
The overall blood flow in the circulation is approximately 5 liters per minute when an
adult is at rest; it is called the CO since the blood flow per unit time is the amount of blood
pumped by the heart per minute (Guyton, 1991). The change in either HR or SV varies the
CO since
CO = HR X SV
Cardiac output (ml/min) = Heart rate Cpm) x Stroke volume (ml)
2.1.2.2 Regulation of the circulation
Control of peripheral vascular function is accomplished by the interplay between
intrinsic and extrinsic control mechanisms. Intrinsic control is the local regulation of blood
flow based on the inherent physiological attributes of the tissues and organs. Extrinsic control
is by the hormonal or autonomic regulation.
2.1.2.2.1 Local regulation
Most vessels have an intrinsic capacity to regulate their own blood flow
(autoregulation). Two mechanisms have been proposed for this (Ganong, 1993; Guyton,
1) The myogenic theory: This is the intrinsic response of smooth muscle of the blood vessel
to stretch. As the pressure rises, the blood vessels are stretched and this causes the
smooth muscle of vessel wall to contract.
2) The metabolic theory: When blood flow increases, the excessive blood flow washes
vasodilator substances out of the tissue; this will allow the blood vessels to contract.
When blood flow decreases, vasodilator substances accumulate in the tissue. This will
cause the blood vessel to dilate.
In most tissues, the metabolic changes, including decreases in oxygen or pH (increase
in ion concentration), increases carbon dioxide, and local release of nitric oxide, produce
vasodilation. Some endogenous substances such as 5-hydroxytryptamine on certain sites and
prostaglandins (F-series) along with thromboxane A2 are vasoconstrictors (Rowell, 1986).
Temperature is one of the important local influences. Cooling below normal causes
vasoconstriction and vasodilation occurs with warming above normal. Also, some potent
substances released by endothelium may influence local vasomotor control.
2.1.2.2.2 Hormonal regulation
This is the regulation of the blood circulation by substances (hormones) formed by
special glands or local tissue. Hormones are organic chemicals released from endocrine cells
into the bloodstream. These hormones also regulate body systems to maintain homeostasis.
However, many hormones act slowly on specific target organs and tend to be effective for
long-term regulation.
Catecholamines: Since some compounds of special hormones called catecholamines such as
appropriate to describe these compounds as both hormones and neurotransmitters.
Epinephrine comprises about 80 percent of the secretion of the total catecholamines released
from the adrenal medulla into bloodstream, and the rest is norepinephrine (Martini, 1992).
Epinephrine acts on Pi-adrenergic receptors, which are also stimulated by norepinephrine in
the heart, this activation increases HR and contractile force fRowell. 1986). It stimulates 02
receptors on coronary artery to dilate, causing increased blood flow (Ganong, 1993). In
veins, epinephrine causes them to constrict, which forces blood out of the veins toward the
heart (Rowell, 1986).
In contrast to epinephrine, norepinephrine exists in plasma mainly due to leakage
from sympathetic terminals into the bloodstream (Rowell, 1986). Norepinephrine constricts
the blocd vessels in skeletal muscle and some organs via a receptors. Norepinephrine elicits
an arterial baroreflex caused by increased arterial blood pressure.
Other hormones: Other hormones such as aldosterone, angiotensin, antidiuretic hormone
(ADH), atrial natriuretic peptide (ANP), erythropoietin, and renin are important for
regulation of blood pressure and volume. When blood pressure or volume is changed, it
afTects blood flow to the kidneys. Decreased blood pressure or volume causes reduced blood
flow to kidneys. Kidneys are sensitive to blood flow reduction and release an enzyme called
renin and a hormone called erythropoietin which stimulates the production and release of red
blood cells to regulate blood volume (Martini, 1992). Renin acts on angiotensinogen, the
globular protein secreted from the liver, to form the inactive polypeptide angiotensin I. This
compound is converted to its active form called angiotensin II with passage through the
lungs. Angiotensin n constricts arterioles directly and raises vascular resistance indirectly
aldosterone, a mineralocorticoid hormone that causes water retention at the kidneys and
prevents further reductions in blood volume by increases in sodium reabsorption. Also, a fall
in blood volume or pressure causes the posterior pituitary to release ADH or vasopressin.
ADH causes the kidneys to reabsorb the water and decrease the amount of water lost. ADH
also causes vasoconstriction which elevates blood pressure (Martini, 1992).
Stretch of muscle fibers in the atrial wall by increased blood pressiu^e or volume
releases ANP is released. AMP promotes the loss of sodium ions and water at the kidney,
inhibits the secretions of some hormones such as ADH and aldosterone, and dilates blood
vessels (Ganong, 1993). As a result, blood volmne and pressure are returned to the normal.
2.1.2.2.3 Neural regulation
Autonomic control is a powerful control mechanism of the circulation. It primarily
acts by redistributing peripheral blood flow to different areas of the body and by affecting
cardiac activity (Guyton, 1964). The sympathetic nervous system plays a major role in the
regulation of the circulation, while the parasympathetic nervous system has a minor influence
on the peripheral circulation system (Guyton, 1991). The sympathetic nerves innervate the
central and peripheral vascular systems as well as the heart. However, the regulation of the
HR by the vagus nerves is a major role of the parasympathetic nervous system in circulation
(Guyton, 1991). Increases in sympathetic activity on the small arteries and arterioles
2.1.2.3 Baroreceptors
Baroreceptors are stretch receptors that are sensitive to blood pressure. While some
baroreceptors exist in the walls of large arteries of the neck and thoracic regions,
baroreceptors are abundant in the walls of the internal carotid arteries and the aortic arch
(Guyton, 1991). In general, three major baroreceptors are involved in cardiovascular
regulation (Beme and Levy, 1997; Ganong, 1993; Guyton, 1991; Milner, 1990). These are:
Carotid sinus baroreceptors monitor changes in blood pressure at the carotid sinus. These
receptors are extremely important and sensitive because blood pressure at this location
directly affects the blood flow to the brain.
Aortic baroreceptors respond to changes in blood pressure within the ascending aorta.
Stimulation aortic baroreceptor leads to reduced CO and fall in systemic blood pressure.
Atrial baroreceptors respond to the blood pressure at the end of the systemic circuit (the vena
cava and the right atrium). When blood pressure rises at these locations, baroreceptors in
these regions stimulate the cardioacceleratory center, leading to increased CO until atrial
blood pressiure returns to normal.
The blood vessel deformation due to the arterial pressure in the carotid sinus and
aortic arch stimulates baroreceptors in these regions. The firing rate of these baroreceptors
are increased by an elevated blood pressure and decreased by a reduced blood pressure
(Beme and Levy, 1997). In general, the carotid sinus baroreceptors are more sensitive than
the aortic baroreceptors.
Atrial baroreceptors along with baroreceptors in the ventricles and pulmonary vessels
cardiopulmonary regions. Activities of these receptors change peripheral resistance;
stimulation of cardiopulmonary baroreceptors elicit changes in forearm resistance.
Baroreceptors control CO and peripheral resistance to prevent large changes in blood
flow and maintain normal blood pressure. When blood pressure rises, this stretches the
baroreceptors, which transmit the impulse signals to the central nervous system. As the
central nervous system receives the signals, they send "feedback" signals to the circulatory
system via the autonomic nervous system to return blood pressure toward normal.
Conversely, low pressure has opposite effects, causing the blood pressure to rise toward
normal.
When arterial blood pressure rises above the threshold point of the baroreceptors,
increased output from the baroreceptors goes to the nucleus tractus solitarius (NTS) in the
brain's cardiovascular center via the carotid sinus and vagus nerves. The output signal from
the NTS travels to the cardioacceleratory center in the hypothalamus to inhibit cardiac
activity. The signal stimulates the cardioinhibitory center in the medulla to reduce the rate
and strength of the cardiac contractions, thereby lowering CO. The vasomotor center
(paramedian reticular nucleus) also inhibits vasomotor activity, which leads to dilation of
peripheral arterioles. The combination of a reduction in CO and a decrease in peripheral
resistance results in a decrease in blood pressure.
In contrast, if blood pressure becomes abnormally low, the reverse occurs. A
reduction in barorecepor output causes signals to NTS which disinhibits the
cardioacceleratory center, which results in increased afferent output to the SA node, AV
node, and cardiac muscles (myocardium). The stimulation of the cardioacceleratory center
center, resulting in increased HR. The output signal stimulates the vasomotor center which
stimulates sympathetic neurons to produce a rapid vasoconstriction and increased peripheral
resistance. The combined work of increased CO and peripheral resistance elevates blood
pressure.
The blood pressure rises during ventricular systole and falls during ventricular
diastole. The maximum blood pressure measured during ventricular systole is called systolic
blood pressure (SBP) and the minimum blood pressure at the end of ventricular diastole is
called diastolic blood pressure (DBP). The difference between the SBP and DBP is called
pulse pressure (PP). The mean arterial pressure (MAP) is the average pressure and estimated
by adding one-third of the PP to the DBP.
2.1.3 Lower body negative pressure (LBNP)
LBNP has been widely used as a research tool to investigate die cardiovascular
responses to orthostatic stress. LBNP induces the graded blood shifting to the lower body.
This method produces similar cardiovascular effects as those produced during head up tilt
(HUT). However, LBNP stimulates the cardiovascular regulation in a short time compared
to HUT (El-Bedawi and Hainsworth, 1994; Halliwill et al., 1998; Lacolley et al., 1993;
Lipsitz et al., 1990; Low et al., 1997; Rowell, 1986; Zoller et al., 1972). HUT shifts blood
volume toward the lower body with a stationary base with existence of gravitational effect
(hydrostatic pressure). LBNP shifts blood volume from the upper to the lower half of body
with application of a subatmospheric pressure to lower body. The rate of shift of blood
similar cardiovascular reflexes as HUT, but in the absence of gravitational effects (Rowell,
1986; El-Bedawi and Hainsworth, 1994).
LBNP is applied using a small chamber, which encapsulates the lower body, with an
air-tight seal around the waist. Negative pressure within the chamber is generated by a
vacuum. An adjustable seat prevents caudal body movement due to the suction. The subject
is in the supine position and any lower body movement is strongly discouraged since any
muscle movement drives blood upward (blood movement by muscle pump).
2.1.3.1 Cardiovascular responses to LBNP
Many researchers have employed the LBNP technique using many different
protocols. Interstudy differences include different initial negative pressure levels (typically
from -1 to -10 mmHg), length of each stage of LBNP (range from 1 to 30 minutes), and
increment of negative pressure stage (range from -1 to -10 mmHg) (Johnson et al., 1974;
Ahmad et al., 1977; Frey et al., 1986; White and Montgomery, 1996; White et al., 1996).
These different LBNP protocols result in different reflex mechanisms/or activities in
cardiovascular system. Low initial negative pressures with a long interval time and small
graded increments of negative pressure have a lower incidence of syncope because the
cardiovascular system is able to adapt to new slowly changing environment. However, high
initial negative pressure causes a high rate of syncope compared to the other protocols.
At low levels of negative pressure, LBNP progressively decreases central blood
volume and central venous pressure. Also, LBNP leads to reductions in forearm blood flow
initiated by low-presstire baroreceptor activation without significant changes in other
Rowell, 1986). It is believed that lower levels of LBNP cause stimulation of low-pressure
barorecepors in the atria and the aortic arch. Further decreases in negative pressure unload
high-pressure baroreceptors. This unloading is mainly due to further decreases in arterial
pressure and a narrowing of PP. Compensation for the reduction in central blood volume by
splanchnic vasoconstriction, increases in HR and fiirther reductions in forearm blood flow
occurs (Figure 3) (Rowell et al., 1972; Johnson et al., 1974; Rowell, 1986). For example,
Rowell et al., reported a 45% reduction in forearm blood flow, 32% fall in splanchnic blood
flow, 30% increase in splanchnic vascular resistance, 28% fall in CO, and 51% reduction of
SV during about 15 minutes of -50 and -70 mmHg of LBNP. Catecholamines such as
norepinephrine and epinephrine in plasma increase with LBNP and plasma hematocrit and
renin also increase with LBNP (Evance et al., 1999). These are mainly due to increases in
LOWER BODY
SUCTION (nwn Hq>
AORTIC MEAN PRESSURE (mm Hgl
AORTIC NJLSE
PRESSURE tmm Hg)
RIGHT ATRIAU PRESSURE tmm Hg)
HEART RATE (b«oti min"')
SPLANCHNIC BLOOO FLOW fTA of controO
FOREARM 8U3Q0 FLOW
Of conlrol)
lOO-
100-lOOr
CARDIAC OUTPUT eo ^ of conlrol)
eo lOO
STROKE VOLUME 90 dk of conlrol)
60
lOO
LEFT VENTRICULAR ENO-OIAST. 80 VOLUME nb of control)
60
300
RENIN
NOREPINEPHRINE
(% of comroDjog
PRA/
2b
TIME (min) mm Mg
neural-hormonal compensation mechanism in cardiovascular system caused by the blood
shift toward lower body generated by LBNP. These results support the idea that LBNP
induces sympathetic activity.
2.1.3.2 Gender difference to orthostatic tolerance
Studies of orthostatic tolerance have focused primarily on men (Convertino et al.,
1990; Fritsch-Yelle et al., 1996; Lacolley et al., 1993). Lacolley et al. (1993) reported a
significant increase in HR, peripheral resistance, and plasma concentration of norepinephrine
and epinephrine with -40 mmHg LBNP. Frey et al. (1987) evaluated the responses of 45
healthy women to LBNP levels of -30, -40, and -50 mmHg. LBNP induced a significant
increase in HR and peripheral resistance, and a significant decrease in SV, CO, and SBP.
Even though many studies have evaluated the cardiovascular reflexes to LBNP in
both genders, relatively few have compared LBNP tolerance by gender. Orthostatic
tolerance can be determined by increasing the magnitude of LBNP, prolonged standing, or
head up tilt to presyncope which is manifested by a sudden increase in HR (tachycardia),
sudden decrease in blood pressure, nausea, dizziness, and blurred sight (White et al., 1996).
The results of orthostatic tolerance by gender were contradictory. Some studies
reported women having less orthostatic tolerance than men (Hordinsky et al., 1981; Ludwig
et al., 1987; White et al., 1996), women having similar orthostatic tolerance to men (Frey et
al., 1986; Frey and Hoffler, 1988; Rahman et al., 1991), and even women having higher
tolerance than men (Hudson et al., 1987). However, many studies concluded that women
have less tolerance to orthostatic stress induced by LBNP, upright posture, and centrifugation
to men and women having different cardiovascular mechanisms and using different strategies
to maintain blood pressure during an orthostatic challenge. White and Montgomery (1996)
reported that women had an 83 % greater increase in blood volume in the pelvic region
(P<0.05) than men with LBNP exposure. However, some researchers opposed this result and
reported that increases in blood volume in the pelvic region in women was not a critical
determinant of LBNP tolerance (Halliwill et al., 1998). Gotshall et al. (1991) reported a
significantly greater decrease in SV, CO, and PP and greater increases in MAP and total
peripheral resistance in men.
In summary, the cardiovascular responses to maximum orthostatic stress were similar
between genders, but women reached presyncope at lower level of LBNP. However, in the
most reported studies, the women were significantly shorter and lighter than the men.
Consequently, the males had bigger hearts and more blood volume than females. It is still
unclear whether the differences seen in cardiovascular response mechanisms to orthostatic
stress and orthostatic tolerance between genders are due to body size differences rather than
the gender difference.
2.2 Analysis of heart rate variability signal
2.2.1 Heart rate variability (HRV)
Evaluation of HR data, which is the most readily accessible cardiovascular signal, can
yield useful information about cardiac health. HR is regulated by the interplay of neural,
respiratory, circulatory, and hormonal influences. However, since the heart is predominantly
Spectral analysis has been widely used as a tool to study the underlying patterns of
the HR for determining the balance in autonomic nervous system. Early investigators
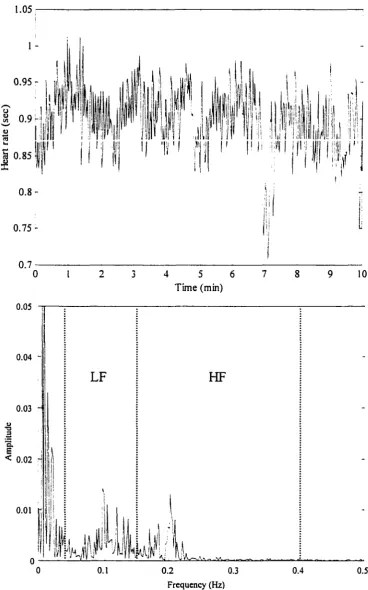
identified peaks in the spectrum of HRV located at approximately 0.10 Hz in a
low-frequency range [LF; 0.04 - 0.15 Hz] and about 0.2 Hz in a high-low-frequency range [HF; 0.15
- 0.4 Hz] (Akselrod et al., 1981; Appel et al., 1989; Mathias et al., 1993; Task Force, 1996).
The low-frequency peak can be described as the response of the baroreceptor reflex, whereas
the high-frequency peak is characterized as the respiratory frequency.
Spectrum data are normalized to minimize the effect of changes in total power [TP;
0.001 - 0.5 Hz] on the interpretation of the relative changes in LF and HF components.
Normalized units are given as the relative value of LF and HF in proportion to the total
power minus the very low frequency component [0.001 - 0.04 Hz] (Pagani et al., 1986; Task
Force, 1996). The Task Force (1996) claimed that the use of normalized frequency
components emphasizes the controlled and balanced behavior of the two branches of the
autonomic nervous system.
Pharmacologic blockade in conscious dogs and humans has been used to demonstrate
the physiologic mechanisms involved in mediating HR fluctuations at these frequencies
(Akselrod et al., 1985; Pagani et al., 1986; Pomeranz et al., 1985). These studies revealed
that parasympathetic blockade abolished all heart rate fluctuations above 0.15 Hz and
substantially reduced lower frequency HR fluctuations. Adding a beta blockade then
removed the residual low frequency fluctuations. Thus, fluctuations at higher frequencies
[above approximately 0.15 Hz] appear to be solely parasympatheticaily mediated, whereas
fluctuations at lower frequencies [below 0.15 Hz] are jointly mediated by the sympathetic
Dozens of studies have used spectral analysis of HRV under various physiological
states. Those studies showed that enhanced sympathetic activity induced by standing,
exercise, hemorrhage, hypotension, and orthostatic stimulus were associated with a marked
increase in the low frequency component and with a decrease in the high frequency
component of the spectra (Bulter et al., 1994; Pomeranz et al., 1985). Diminished areas of
low and high frequency peaks have been seen in elderly people (Shannon et al., 1987).
Patients with heart failure have depressed HRV; diminished power was seen at all
frequencies greater than 0.2 Hz (Appel et al., 1989; Shannon et al., 1987). The HRV in
patients with a transplanted heart exhibited reduced total power and a lack of distinct peaks
in the power spectrum was commonly seen (Sands et al., 1989).
After acute myocardial infarction, the low frequency component was significantly
increased and the high frequency component was significantly decreased compared to those
of normal people (Lombardi et al., 1987). Diminished HRV, assessed from 24-hour
continuous electrocardiographs, was indicative of altered autonomic control and was a strong
predictor of mortality in patients after myocardial infarction. Molgaard et al. (1991)
suggested that low variability of HR (using statistical technique such as the deviation of R-R
intervals) may indicate increased risk of sudden cardiac death, even in apparently healthy
subjects (Mathias et al., 1993). They also proposed spectral analysis of HR may be a usefiil
technique in assessing autonomic ftmction in patients with conditions related to autonomic
2.2.1.1 Sampling theorem
The analysis of HRV begins with recording the electrocardiogram. The analog
electrocardiograph output has to be digitized at a sufficiently high rate to faithfully
reproduce the original analog signal. An inadequate sampling rate can lead to digitization
errors known as "aliasing" (Oppenheim and Schafer, 1994; Orfanidis, 1996). While the
sampling rate has to be high enough to avoid loss of information in the original signal, an
excessively high sampling rate requires high quality instruments, more processing time, and
enormous data storage space.
According to the Nyquist sampling theorem, the sampling rate (/,) should be at least
twice as high as the maximum frequency (/^) of the original signal in order to achieve
adequate precision of the digitized signal,
f > 2f .
J s J max
The minimum sampling rate allowed is called the Nyquist rate and diat is /, = 2 and the
frequency at one-half the sampling frequency is called the Nyquist cutoff frequency
(/max -fsytptist = /j ^ 2) (Orfanidis, 1996). If the Nyquist condition is satisfied in sampling the
original signal, the continuous original signal can theoretically be reconstructed without
aliasing from its sample sequence (Steams and David, 1996).
2.2.2 Spectral analysis
2.2.2.1 Power spectral density
The main purpose of spectral analysis is to represent a signal by a sum of weighted
density of spectral components. The power spectral density (PSD) of a random process X ( t )
or X[n] is defined as
- 2[^.,-(r)] = J" R^(r)ex^{-jcor)dT (Continuous case)
ao
= ^/?^[r]exp(-y<yT) (Discrete case)
where /?.Y-(r) is the autocorrelation function (ACF) of X { t ) or X { n \ with lag T defined as
R , { r ) = s [ X { t ) X ( t + v)]
R^{t\ = e{X{n\X{n + T])
and 3[*] indicates Fourier transform, o) means frequency, and £• is the expectation operator
(Brown and Hwang, 1997). The PSD analysis describes the distribution of energy as a
function of frequency of the signal (Kay, 1988).
Note that in these equations the PSD is represented as either an infinite integral of or
the sum of an infinite set of ACF values. If, however, stationarity of the signal can be
assumed, the PSD of a signal can be based on a finite data set. A process or signal is
stationary when its statistical properties, such as mean, variance, and probability density
functions, do not vary with the time and when its autocorrelation function depends only on
time lag (T) and does not vary in time (Brown and Hwang, 1997) (e.g. a sinusoidal function is
an example of stationary signal). This underlying assumption of signal stationarity allows
proper application of PSD methods for analysis of a signals of finite duration.
Alternatively, an estimation of a PSD can be achieved using what are known as
2.2.2.2 Non-paxametric method
The classical (non-parametric) method is based on a direct decomposition of the data
to be analyzed into spectral components using Fourier analysis. Its processing speed is
higher than the modern (parametric) method. The periodogram, which is the most popular
way to estimate PSD, is a typical model of a non-parametric spectral estimator. The
periodogram of a signal is defined by
and the PSD estimation based on the periodogram is
1 1 1 ^
Hm £ [—|3{X(0}| " ] = h m s [— ^X{t) Q\^{-jcot)dt
(Continuous case) j" R^iT)ex^{-jcoT)dT
= lim
£[-^-,v-.« "• jv
s-\
2] Z[n] exp(-ycOT)
n s 0
5^/2.,.[r]exp(-yiyr)
]
(Discrete case)
(Brown and Hwang, 1997; Kay, 1988).
However, due to the characteristic of periodogram that its variance does not decrease with
data length even though the mean value of their data converges to the true PSD, the averaged
periodogram is sometimes used to overcome this limitation (Kay, 1988).
Many researchers employ the averaged periodogram (non-parametric method) to
analyze the heart rate variability due to the simplicity of this method, (Akselrod et al., 1985;
Baharav et al., 1995; Lipsitz et al., 1990; Ramaekers et al., 1998; Shin et al., 1997; Weise et
2.2.2.3 Parametric method
The parametric method requires the rather onerous tasks compared to the
non-parametric method. The first step is to identify an appropriate model to be fit to the data.
The second step is to estimate the parameters of the model using the data. The third step is to
obtain the spectrum estimate of that model by substituting the parameter values into the
theoretical PSD formula (Kay, 1988). The parametric method can yield I) improved
resolution - smoother spectral components, 2) an accurate estimation of PSD even with a
small number of data, and 3) easy postprocessing of the spectrum to evaluate distribution of
sequence energy (Task force, 1996).
The parametric method requires careful attention be used to verify tbe suitability of
the selected model, because the accuracy of the model being applied to the data is quite
important. An ideal model should have as few parameters as possible. The autoregressive
(AR) model, the moving average (MA) model, and the autoregressive-moving average
(ARMA) model are the three most common models used when implementing parameter
estimation methods. The spectral estimate is based on one of these models. Consequently,
the accuracy of the spectral estimates will be coarse if the model is inappropriate. Since
there is no absolute right way to choose a model for a given signal, finding an adequate
model is often troublesome.
Autoresressive method: The AR spectral estimator, which is based on estimation of the AR
parameters, is the most popular modeling approach to spectral estimation because it provides
1) accurate estimation of spectrum and 2) better computational efficiency than other
parametric methods. The AR parameters can be optimally predicted by solving the
AR parameters. Once a valid AR model is chosen, the spectral estimator can be obtained
with less bias and a lower variability than non-parametric spectral estimate method (Kay,
1988). The AR process of order p is
A R { p ) : z, = ^0 + + • • • + + s ,
or
= - 2 a[k]x[n - /:] + \ \ { n \
k=\
where, £-,and vv(n] are noise terms with variance a'.
The term "autoregressive" is used since a present value for the signal is expressed as a
fimction of past values (weighted sum of past values) plus a noise term. The true PSD is
^a[k]Qxp(-Jwk) I"
and the estimate of the PSD is
*=.0
A 2
S a r U ^ ) = ^
^ d [ k ] Q \ ^ { - j w k ) I"
*=0
where, the (hats)" denote estimated values.
A few researchers have studied the activity of the autonomic nervous system by means of AR
frequency analysis of the HRV signal (Barbieri et al., 1997; Laitinen et al., 1998).
Movim-Averase method: A MA model of order q can be expressed as:
2, = ^ + dx^t-x - - • • • - 9^s,.^
4 n ] =
*=0
The true PSD of a MA model is
= o"'
= a"
]£6[A:]exp(-yM/A:) i=0
1 + 2]6[A:]exp(-yw^) *=i
and the estimate of its PSD is
l + 2^i[^]exp(-yw^) t=i
MA spectral estimation is valuable when the PSD is characterized by broad peaks (Kay,
1988). The MA spectral estimator is generally not of sufficiently high spectral resolution for
processes with narrowband spectral features. However, when the underlying process is
wideband, the MA spectral estimator will be more accurate than Fourier based spectral
estimator. None of the researchers have reported results based on use of MA spectral
estimation techniques for the HRV, which is probably because HRV peaks do tend to be
narrowband.
Autoresressive - Movins - Average Model: The model
is called a mixed autoregressive-Moving-Average model of order ( p , q ) and it can be
expressed as
t=l lfc=Q
^ b [ k ] t x ^ { - j w k ) k=Q
= £T"
J]a[^]exp(-yw^)
k=Q
1 +J]6[A:]exp(-ywA:) *=i
l + X 4 ^ J e x p ( - y w ^ )
i = l
ARMA model is a pole-zero model. This model is able to represent spectra with both sharp
peaks and deep valleys. The estimate of the ARMA PSD is
'AJiMA (Jw) = a ' 9 ^
5^6[A:]exp(-ywA:)
*=0
1
= CT"
^a[A:]exp(-yw^)
M
\ + Y , b [ k ] Q x p { - j w k )
y
l + Y . ^ [ k ] Q \ v { - j y v k )
The main drawback associated with ARMA models, as with the other two parametric
methods, is the difficulty associated with model selection. A very limited number of
researchers have reported on the application of ARMA models to HRV (Triedman et al.,
1995).
2.2.3 Wavelets analysis
Even though Fourier transform based methods have been widely used in medical
signal processing, these methods are not appropriate for analysis of signals containing
because most of the statistical characteristics of medical signals are non-stationary although
this technique is commonly used in this field. This is justified mathematically by dividing
non-stationary signals into several blocks of short signal segments that do satisfy stationarity
conditions. However, due to computation limitations that impose fixed size windows over
the entire time-fi-equency plane, low spectral resolution tends to result, and ultimately this
method fails to properly represent the signal of interest (Akay, 1995).
Wavelets analysis techniques provide an alternative tool for analysis of non-stationary
signals as well as stationary signals. Unlike a Fourier transform which provides only
one-dimensional description, a wavelet transform presents two-one-dimensional (time-fi-equency)
description. Wavelets analysis is a windowing technique with variable-sized regions; short
time intervals at high frequencies resulting in good time resolution and long time intervals at
low frequencies resulting in good frequency resolution (Akay, 1995).
The wavelet is mathematical tool for representing signal by a set of basis fimctions
and all basis fimctions can be generated by a single scaling fimction, ^{x), and wavelet,
y/{x), by scaling and translation (Bumis et al., 1998):
= V " v { V x - k )
where j and k are integers.
A set of basis fimctions is generated from the basic scaling function by scaling and
translation:
(p{x) = Y , S i k ) ( p { 2 x - k ) k
where g(A:)=(-l)*A(l-A:) is a scaling coefficient and h { k ) is the wavelet coefficient.
i{/ (.r) is called a mother wavelet if it satisfies the following two properties:
= 0
—FLO
30
\\y/{t)\'dt <
-<e
The wavelet transform produces coefficients representing the correlation between the
wavelet and small sections of the input signal, as a function of scale and translation.
Continuous wavelet transforms operate every scale and translation whereas discrete wavelet
transforms operate on scale and translation based on powers of two, called the dyadic
sampling process. The wavelet coefficients of a signal /(.r) are:
ao
K.b = ¥a.b(^)
—as
with corresponding synthesis formula
1
where 'a.b^ = ^ x - b ^ '\a\
in CWT \ a /
r..tM = 2-''"-i^i2-''x-b) inDWT
A uniquely attractive attribute of wavelet transforms is that at higher frequency since
dilation of the base wavelet is small, wavelet transforms possess good time resolution but
relatively poor frequency resolution. Conversely, at low frequencies where there is large
This variability of time-frequency resolution is a distinct merit of the wavelet transform
(Burrus etal., 1998).
The data can be decomposed into two components, approximations and details.
/W = /l(/(x)) + D(/(x))
Consider an Z.-level decomposition, which can be written as
f i x ) = W + W
t k
coefficients and dj,^ are
m m
where, 0 < J < L.
Similarly, a recursive algorithm for synthesizing function can be derived based on its wavelet
coefficients , and djj^
- 2 m ) + - I m )
m m
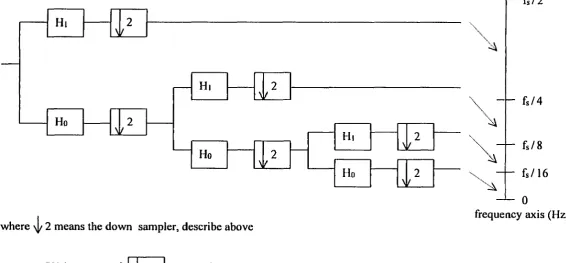
The wavelet decomposition is an iterative process with successive slicing
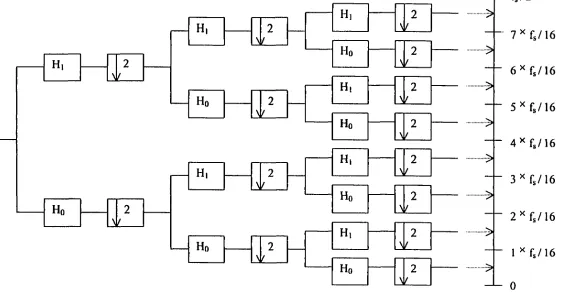
approximations into the desired lower resolution components. The wavelet packet is one
method of wavelet decomposition. However, unlike general decomposition, which provides
adjustable resolution of frequencies only at low frequencies, wavelet packets offer a richer
range of the signal by decomposing both approximations (low frequencies) and details (high
frequencies) into the next-level approximations and details (Figure 4 and 5).
In practical application, when the input signal [Xin)] passes through two filters; one
and D { n ) ]. This procedure results that the total output signal [ Y { n ) = A { n ) + D { n ) ] will have
twice data size of the original input signal ]. To correct this problem, wavelet analysis
techniques use the operation of reducing the sampling rate called "downsampling" and is
denoted by \1/ 2. This process keeps alternate samples by a factor of two; only the even
indexed output samples are retained while the odd indexed output samples are discarded and
mathematically e x p r e s s e d b y X ^ , ( n ) = X ( 2 n ) .
Wavelet analysis conventionally provides a scale description instead of a
time-frequency description. However, the scale can be converted to the time-frequency easily since the
scale is inversely related to the frequency; the wavelet becomes finer or compressed when the
scale is lower and this corresponds to the high frequency on spectrum. In wavelet
decomposition, the signal to be analyzed is decomposed into two signals in the first level; the
low frequency component (0 - Hz) signal and the high frequency
(fsyquist / 2 - fsyquui ^z) compouent signal. If signal has to be broken down tluther, each
frequency component of signal is slice to the lower resolution of the low frequency
components and the high frequency components of the decomposed signal in higher level.
For example, at 2 level decomposition, 4 frequency component signal exists: [0 - /(4)
HZ]J/v^^,/(4)-2X/^^„,,/(4) HZ],[2X/^^,,/(4)-3X/^^^,/(4) HZ], and
[ 3X fuy^iuis,/(4) - 4X /(4) HZ] (Figure 4 and 5).
Even though the number of applications using wavelets analysis on biomedical
signals is rapidly growing, only a limited number of studies have reported the application of
Wiklimd et al., 1997; Yang and Liao, 1997). Clinical interpretation of HRV based on
wavelets analysis is not yet available.
This study will be a pioneering study on the application of wavelet transforms to
HRV with clinical interpretation. This study will provide results that allow diagnosis of the
Ho 2 Ho
N
Ho
Hi 2
Hi
\
where \|/ 2 means the down sampler, describe above
X(n) •! 2 • X(2n)
Hi
Ho
Hi 2
Hi 2
[ - f s / 4
f s / 8
f s / 1 6
0
frequency axis (Hz)
[image:44.812.99.666.109.372.2]Ho 2
/
- H, 2
N H, H, Hr 2 2
>
2 N H, Ho H, Hr H, Ho H, Ho M.- 7 ^ f J \ 6
- 6 ^ f , / 1 6
- 5 ^ f s / 1 6
- 4 ^ f s / 1 6
- 3 ^ { 3 / 1 6
- 2 ^ f s / 1 6
- 1 ^ f s / 1 6
- 0
frequency axis (Hz)
•>
•••>
[image:45.817.106.671.104.402.2]III.
REPRODUCIBILITY OF AUTONOMIC AND
CARDIOVASCULAR RESPONSES TO ORTHOSTATIC STRESS
A paper to be submitted to the Journal of Applied Physiology
Kichang Lee, Dwayne Buchanan, Alison B. Flatau, and Warren D. Franke
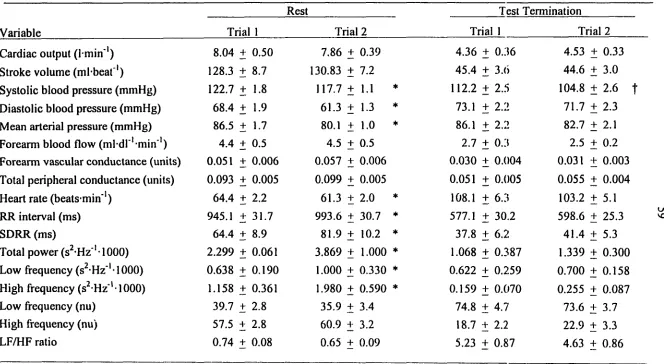
ABSTRACT
The reproducibility of the autonomic and cardiovascular responses to lower body
negative pressure (LBNP) is surprisingly limited. We postulated that LBNP tolerance,
autonomic, and cardiovascular responses to LBNP would be reproducible. To test this, 14
active college age men underwent an orientation exposure and 2 trials of graded LBNP to
presyncope or -100 mmHg, separated by 1 week. Heart rate, stroke volume, cardiac output,
blood pressure and forearm blood flow were assessed, as was heart rate variability in both
time and frequency domains. LBNP tolerance was lower in trial 1 than trial 2 (Cumulative
stress index [CSI]: 1698 ± 171 vs 1938 ± 139 mmHg-min; P<0.05) but the CSI rehability
estimate was high (0.87). The trial-to-trial responses to LBNP common to all subjects
(LBNP < -60 mmHg and at test termination) did not differ between trials although systolic
blood pressure was lower in trial 2 at test termination (105 + 3 vs 112 + 3 mmHg, P<0.05).
Relatively high reliability estimates were found for the resting data (lowest: 0.60 for low
frequency/high frequency ratio; highest: 0.94 for standard deviation of R-to-R intervals).
Reliability estimates varied by parameter measured and LBNP stage but were generally
similar to that seen at rest although they were lower at test termination [lowest: 0.23 for high
frequency (abs) power, highest: 0.87 for cardiac output]. These data suggest that mean
individual LBNP tolerance appears reproducible but individual responses at test termination
are variable.
INTRODUCTION
Lower body negative pressure (LBNP) is a common tool to induce orthostatic stress
via graded central hypovolemia. The physiological responses to LBNP have been
extensively studied and reviewed (2, 18,26). However, investigations of the reproducibility
of the cardiovascular and autonomic responses to this stress have been surprisingly limited.
In the previous two studies found in the literattire, reproducibility of LBNP tolerance ranged
from r = .64 to .93 with greater familiarization to LBNP testing associated with greater
reproducibility (6, 15). However, reproducibility of the cardiovascular responses was either
not reported (6) or limited to blood pressure and heart rate at LBNP of < -40 mmHg (15).
In recent years, the engineering technique of power spectral density (PSD) analysis of
heart rate variability (HRV) has become increasingly used to analyze autonomic nervous
system responses to orthostatic stress (4, 7, 8). Increases in sympathetic nervous system
activity and decreases in parasympathetic activity seen with graded LBNP can be reflected
by changes in PSD of HRV (4, 8). Analysis of HRV via PSD is an attractive tool because it
can provide insight into the autonomic modulation of the heart using data collected in a
noninvasive and unobtrusive manner. The reproducibility of HRV has, in some contexts,
been evaluated. Healthy resting subjects displayed acceptable reproducibility of HRV in
both time and frequency domains (5, 19). Similar observations were reported with tilt table
testing (5, 12,13,24, 25, 31). However, the reproducibility of the PIRV responses to LBNP
table, have been shown to be reproducible, it is uncertain whether these findings can be used
as evidence of reproducibility for another form of orthostatic stress, LBNP. Moreover, in
the cited tilt table studies, breathing frequency of the subjects was not controlled. Breathing
frequency can have profound effects on HRV (3); not controlling for this variable necessarily
limits comparisons. Lastly, while the cardiovascular responses to tilt testing and LBNP can
be qualitatively similar, these different modalities should not be considered
"interchangeable." For example, LBNP avoids use of anti-gravity muscles that are almost
invariably activated during tilt table testing (2). The degree of venous pooling is proportional
to the LBNP while it is proportional to the sine of the angle of tilt used with the other
modality (2). Consequently, good reproducibility with tilt table tests may not be reflective of
LBNP testing.
Because data on the reproducibility of the cardiovascular responses to sub- and
maximal LBNP are sparse and data on the reproducibility of the HRV responses to this
stressor have not been reported at all, we performed the present investigation in order to
determine the reliability of these tools commonly seen in hemodynamic laboratories.
METHODS
Subjects
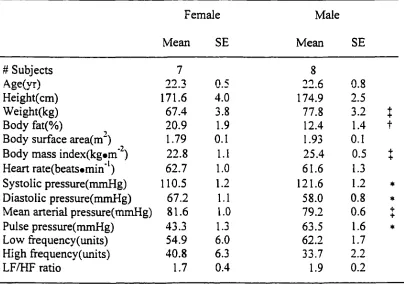
Healthy college-age men (n = 15) volunteered to participate as subjects in this study.
All subjects were verbally informed of the intent and procedures of the study with written
consent obtained prior to data collection. All protocols and procedures were approved by the
Subjects visited the laboratory three times. The first session included completion of a
medical history questionnaire, a physical activity questionnaire to estimate VOamax
(correlation coefficient = 0.85; [9]) and determination of anthropometrics, including body
composition estimated from the sum of three skinfold thickness measurements (10). They
were also oriented to the LBNP chamber. Subjects were placed in the LBNP chamber and,
following a 6 minute resting period, were exposed to 10 mmHg reductions in pressure every
2 minute until completion of-50 mmHg. Throughout this period, they practiced breathing at
the desired fi-equency of 0.2 Hz. The second and third sessions entailed the administration of
graded LBNP to presyncope or -100 mmHg. Each session was separated by one week and
administered at the same time of day. Subjects were instructed to refi-ain from consuming
caffeine and alcohol containing products and from performing vigorous exercise 24 hours
prior to each maximal LBNP test.
Maximal LBNP testing protocol
Following instrumentation, each subject was placed supine in the LBNP chamber,
sealed at the level of the iliac crest, and supported with an adjustable bicycle saddle for
stabilization. After a 15 minute resting control period at ambient barometric pressure (0
mmHg), negative pressure was imposed in 10 mmHg increments every 6 minutes imtil either
completion of the test at -100 mmHg or the onset of signs and symptoms of presyncope.
Indicators of impending presyncope included a drop in systolic blood pressure (>25
mmHg-min'), progressive reduction in systolic blood pressure (to <80 mmHg), a sudden
decrease in heart rate (>15 beats-min"') or subject symptoms such as light-headedness,