
High Performance, Federated,
Service-Oriented Geographic Information
Systems
Ahmet Sayar
Submitted to the faculty of the University Graduate School in partial fulfillment of the requirements
for the degree Doctor of Philosophy
Accepted by the Graduate Faculty, Indiana University, in partial fulfillment of the requirements for the degree of Doctor of Philosophy.
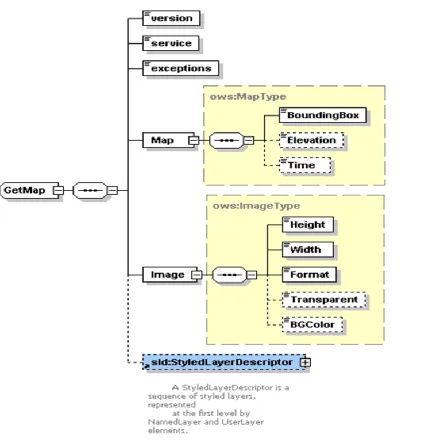
Doctoral Committee ________________________________
Prof. Geoffrey C. Fox (Principal Advisor)
________________________________ Prof. Randall Bramley
________________________________ Prof. Kay Connelly
________________________________ Prof. Yuqing (Melanie) Wu
© 2009
AHMET SAYAR
Acknowledgements
This dissertation has been achieved with the encouragement, support, and assistance I received from many remarkable people. I would like to offer my sincere gratitude to them.
First of all, I would like to thank my advisor Prof. Geoffrey C. Fox for his support, guidance and an exceptional research environment provided by him along the way of this endeavor. I deeply appreciate how much he contributed with his keen insight and extensive experience. His advice was always invaluable contribution to my academic life.
I would also like to thank the members of the research committee for generously offering time, support, guidance and good will throughout the preparation and review of this dissertation. I am very thankful to Prof. Randall Bramley for his suggestions and remarkable inspiration, Prof. Kay Connelly and Prof. Yuqing (Melanie) Wu for their constructive comments, kindnesses and keen intellects.
I want to thank all members of Community Grids Lab for the priceless moments that we shared together. I have had great pleasure of working with these wonderful people. I particularly thank Dr. Marlon Pierce for his supports and productive discussions on various aspects of my research.
Abstract
TABLE OF CONTENTS
CHAPTER 1 INTRODUCTION ... 1
1.1. Motivation ... 2
1.2. Why Federation ... 4
1.3. Research Issues ... 7
1.4. Organization of Dissertation ... 11
CHAPTER 2 LITERATURE SURVEY ... 13
2.1. Background ... 13
2.1.1. Geographic Information Systems (GIS) ... 13
2.1.2. Open GIS Standards and GIS Web Services ... 16
2.2. Related Works ... 20
2.2.1. Linked Environments for Atmospheric Discovery (LEAD) ... 20
2.2.2. Geosciences Network (GEON) ... 21
2.2.3. Laboratory for Advanced Information Technology and Standards (LAITS): 22 CHAPTER 3 GIS WEB SERVICE DATA-GRID COMPONENTS ... 25
3.1. Geo-data and Common Data Models ... 26
3.2. Web Service Extensions to Standard Service Definitions ... 29
3.3. System Framework and Web-Service Components ... 32
3.3.1. Web Feature Service ... 33
3.3.2. Web Map Service ... 38
3.3.2.1. GetCapabilities Services... 39
3.3.2.2. GetMap Services ... 41
3.3.2.3. GetFeatureInfo Services ... 47
3.3.3. Browser event-based Interactive Map Client Tools... 53
3.3.3.1. Integration of AJAX approach to GIS Web Service Invocations ... 59
3.3.3.2. AJAX & Web Services Synchronization Framework ... 61
CHAPTER 4 FINE-GRAINED FEDERATION OF GIS WEB-SERVICE
COMPONENTS ... 68
4.1. Geo-Data and integrated data views... 70
4.1.1. Hierarchical Data Definition and Multi-layer Maps ... 74
4.2. Federation Framework ... 75
4.3. Service Federation through Capability Aggregation ... 79
4.3.1. Extending WMS as a Federator Service ... 80
4.3.1.1. Federating through Context Document:... 81
4.3.1.2. Federating through Aggregated WMS capability ... 83
CHAPTER 5 APPLICATIONS OF THE FEDERATION FRAMEWORK... 88
5.1. The National Infrastructure Simulation and Analysis Center (NISAC) ... 89
5.2. Pattern Informatics (PI), Earthquake Science ... 96
5.3. Virtual California (VC), Earthquake Science ... 103
CHAPTER 6 HIGH-PERFORMANCE SUPPORT IN INTEROPERABLE GEO-DATA RENDERING ... 108
6.1. General Performance Issues ... 109
6.1.1. Distributed Nature of Data ... 109
6.1.2. Interoperability Cost – Common Data Model ... 110
6.1.3. Tough Data Characteristics ... 111
6.2. Extending OGC Standards with Streaming Data Transfer Capabilities ... 112
6.3. Application of Pull Technique for GML Parsing and Rendering ... 118
6.4. Adaptive load-balancing and Parallel Query Optimization ... 122
6.4.1. Problem Definition... 124
6.4.2. Workload Estimation Table for Two-dim Range Queries ... 125
6.4.3. Utilizing WT for Range Query Optimization ... 130
6.4.4. Performance Evaluation ... 134
6.5. Just-in-time Map Rendering ... 139
6.6. Overall System Evaluation ... 143
6.6.1. Data and Process Flow ... 143
6.6.3. Base-line System Test ... 147
6.6.4. Performance Enhancement with Federation and Parallel Query Optimization through WT tables ... 149
CHAPTER 7 ABSTRACTION OF THE FRAMEWORK FOR THE GENERAL DOMAINS ... 157
7.1. Generalization Framework ... 158
7.2. Standard Service Interfaces and Mediators ... 161
7.3. Components Abstraction – ASFS and ASVS ... 162
CHAPTER 8 CONCLUSION AND FUTURE WORK ... 165
8.1. Summary and Conclusions ... 165
8.2. Summary of Answers to Research Questions ... 168
8.3. Future Research Directions ... 173
APPENDICES APPENDIX A: Sample Request Instances to standard WMS Service Interfaces .... 176
i. GetCapability Request Instance ... 176
ii. GetMap Request Instance... 177
iii. GetFeatureInfo Request Instance ... 178
APPENDIX B: A Template Capabilities.xml File for WMS. ... 179
APPENDIX C: A Sample WMS Capabilities.xml Instance ... 180
APPENDIX D: A Sample Instance of WFS Capabilities file ... 183
APPENDIX E: A Simplified WMS Web Services Service Definition file (WSDL) 186 APPENDIX F: A Simplified WFS Web Services Service Definition file (WSDL) . 188 APPENDIX G: Sample GetFeature Request for WFS - for earthquake fault data .. 191
APPENDIX H: Sample Simplified GML Document for Earthquake Fault data. ... 192
APPENDIX I: Sample GetFeature Response ... 193
REFERENCES 194
LIST OF FIGURES
Figure 1: Layered display – a map is composed of a set of multiple, distributed layers. Figure is from (Koontz, 2003). ... 16 Figure 2: GIS framework with the proposed Web Service components and data flow. See also Figure 3. ... 33 Figure 3: Illustration of client (WMS)-WFS interaction steps to get feature data... 35 Figure 4: GetCapabilities operation steps. See Appendix C for a sample WMS
capabilities file instance ... 40 Figure 5: GetCapabilities Request Schema. See Appendix A for an instance of this
request schema. ... 40 Figure 6: GetMap operation steps. ... 42 Figure 7 : GetMap Request Schema. See Appendix A for an instance of this request schema... 44 Figure 8: Sample output of the above map images generating code ... 46 Figure 9: A snapshot of response to getFeatureInfo. It is actually an attribute querying of earthquake seismic data layer shown on the map image. ... 49 Figure 10: Creating getFeatureInfo reponse by using a stylesheet and XSLT processor. See Figure 10 for generic stylesheet for GML. ... 49 Figure 11: GetFeatureInfo operation steps ... 50 Figure 12: GetFeatureInfo Request Schema. See Appendix-A for an instance of this request schema. ... 51 Figure 13: Generic XSL file for HTML creation from the GML in order to create
Figure 14: Illustration of major event types ... 56
Figure 15: Event-based interactive map tools capable of interacting with any map server developed in Open Geographic Standards. ... 57
Figure 16: Standard interactive map tools extended with capabilities of integrating map images with outputs of Geo-science grid applications. ... 58
Figure 17: (A) Pure AJAX Approach, (B) Web Services Approach, and (C) Hybrid (AJAX + Web Services) Approach... 62
Figure 18: Integration of Google Maps with OGC WMS by using architecture defined in Figure 16. ... 65
Figure 19: Data life-cycle and integrated data-view creation. ... 72
Figure 20: Federated GIS framework. ... 76
Figure 21: Federator's aggregated capability metadata. ... 85
Figure 22: Example federated data sets defined in federator‟s metadata. ... 87
Figure 23: NISAC SOA Demonstration Architectural Diagram and Data Flow. ... 92
Figure 24: Sample Florida State Electric Power (red lines) and Natural Gas Components (blue lines) as overlays on a Satellite images provided by NASA WMS. ... 96
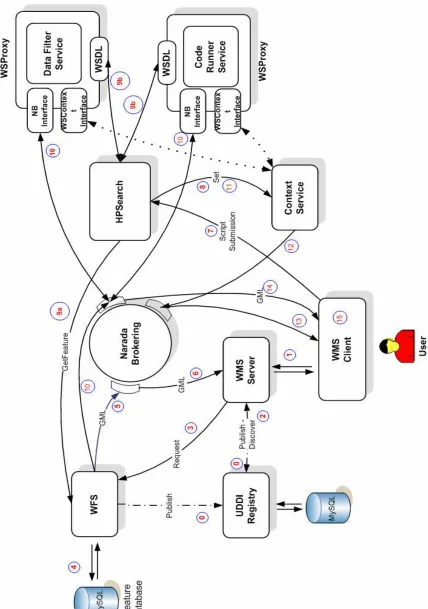
Figure 25: A general GIS Grid orchestration scenario involves the coordination of GIS services, data filters, and code execution services. These are coordinated by HPSearch . 99 Figure 26: WMS Client or so called event-based interactive map tools. Google Map layer is superimposed by the plotting of the PI outputs. It shows probability of earthquake happenings. Red ones show high probabilities. ... 102
Figure 28: Event-based interactive user interface extended for Virtual California needs. It enables creating map movies by playing framework (created from time-series data) successively. Each framework is actually a map image. ... 107 Figure 29: Problem illustration with two different types of data sets ... 112 Figure 30: Streaming data transfer using NaradaBrokering publish-subscribe topic based messaging middleware. ... 114 Figure 31: Comparisons of Streaming vs. Non-Streaming data response timings from source to federator or WMS. ... 117 Figure 32: Performance comparison of two XML data processors, pull parsing and
Document Object Model by using dom4j. ... 122 Figure 33: Architectural comparisons of parallel fetching with straightforward single thread fetching ... 123 Figure 34: The recursive binary partitioning routine ... 127 Figure 35: The routine to find out the best partition cut point according to given error rate ... 128 Figure 36: Sample query and corresponding partitions in WT. total query size 32MB and threshold data size 5MB, and error rate .20 ... 129 Figure 37; Illustration of query decomposition with a sample scenario ... 130 Figure 38: Example scenario of the partitioning a region into 5 sub-regions ... 131 Figure 39: A sample “GetFeature‟ query for global hotspot (earthquake seismic data) sent
to WFS for a specific range defined in bbox-i. ... 132 Figure 40: Streaming Data fetching through publish/subscribe based messaging
Figure 41: Parallel query optimization performance results ... 136
Figure 42: Overhead times coming from parallel query optimization ... 139
Figure 43: Map rendering process steps ... 140
Figure 44: Average timings for map-image creation steps ... 141
Figure 45: Image conversion timings based-on pixel resolution values ... 143
Figure 46: Test setup for Federator-oriented enhancement analysis and evaluations .... 144
Figure 47: Test-case scenario - test setup ... 146
Figure 48: The overall (end-to-end) average response times - straightforward sequential data access to data sources. ... 148
Figure 49: Average response times - parallel data access through the federator ... 151
Figure 50: Average response times - parallel data access through the federator and WT tables ... 154
Figure 51: Comparison of the average response times of the straightforward and optimized parallel query approaches. ... 156
LIST OF TABLES
Table 1: Data access times (from federator or WMS) while using (1) streaming and (2)
non-streaming data transfer techniques. ... 116
Table 2: The performance values of DOM and Pull parsing (Xpp) over GML data. Dashed-line values imply memory exception. ... 120
Table 3: Standard deviations of average timings for total rendering ... 121
Table 4: Parallel data access/query times based on (1) changing threshold query size used for building WT and (2) the #of worker nodes -WFS. ... 135
Table 5: Overhead times based on number of partitions to be applied ... 138
Table 6: Average timing values for map image processing steps ... 140
Table 7: Average timings and standard deviation values of object to image/JPEG conversion ... 142
Table 8: The average response times for straightforward sequential data access ... 147
Table 9: The standard deviations for the average response times given in Table 8 ... 147
Table 10: Average Response times - parallel data access through the federator. ... 150
Table 11: Standard deviations for the average values given in Table 10 ... 150
Table 12: Average Response times - parallel data access through the federator and WT tables ... 153
Table 13: Standard deviations for the values given in Table 12 ... 153
Table 14: Comparison of average response times - optimized parallel data access with sequential access ... 155
CHAPTER 1
INTRODUCTION
Geospatial information is critical to effective and collaborative decision-making in earth-related geo-science applications such as disaster planning, crisis management, early-warning systems and urban planning. Decision making in Geographic Information Systems (GIS) (Delaney, 2007) increasingly relies on analyses of spatial data in map-based formats. Maps are complex structures composed of layers created from distributed heterogeneous data and computational resources belonging to separate virtual organizations from various expert skill levels.
and analysis through integrated data-views in the form of multi-layered map images (Chapter 4). Our proposed distributed infrastructure is based on a common data model, standard GIS Web-Service components, and a federator component. The federator federates standard GIS data services and enables unified data access/query and display/analysis over integrated data-views through event-based interactive display tools (Section 3.3.3). Integrated data-views are defined in the federator‟s capability metadata as composition of layers provided by standard GIS Web-Services. Our grid approach is based on the WS-I+ Interoperability standards ("WS-I," 2002).
1.1.
Motivation
Geographic Information Systems (GIS) are systems for creating, storing, sharing, analyzing, manipulating and displaying spatial data and associated attributes. The general purpose of GIS is extracting information/knowledge from the raw geo-data. The raw data is collected from sensors, satellites or other sources and stored in databases or file systems. The data goes through the filtering and rendering services and is presented to the end-users in human recognizable formats such as images, graphs, charts, etc. GIS is used in a wide variety of tasks such as urban planning, resource management, emergency response planning in case of disasters, crisis management and rapid responses, to name a few.
processing/rendering services. On the other hand, the distributed systems are composed of geographically distributed and loosely coupled autonomous hosts that are connected through a computer network. They aim to share data and computation resources collaborating on large scale applications.
Modern collaborative GIS requires data and computation resources from distributed virtual organizations to be composed based on application requirements, and accessed and queried from a single uniform access point over the refined data with interactive display tools. This requires seamless integration and interaction of data and computation resources. The resources span over organizational disciplinary and technical boundaries and use different client-server models, data archiving systems and heterogeneous message transfer protocols.
Furthermore, GIS is particularly used in emergency early-warning systems like homeland security and natural disasters (earthquake, floods, etc), and crisis management applications require quick responses. However, because of the characteristics of geo-data (large and unevenly distributed data such as the distribution of human population and earthquake seismic events), time-consuming rendering processes and limited network bandwidth, the increasing and optimizing performance and responsiveness stand as the toughest challenges in distributed modern GIS (Peng & Tsou, 2003).
1.2.
Why Federation
The compassable nature of the standard GIS data services (Web Map Service and Web Feature Service) (Chapter 3) inspired us to develope a federated information system framework enabling both application-based hierarchical data definitions (architectural features) (Chapter 4) and high performance designs based on load-balancing and parallel processing (high performance features) (Chapter 6).
Our proposed federated service-oriented information system framework (Chapter 4) must support collaborative decision making over integrated data views, described in a layer-structured hierarchical data provided by a federator. The users access the system as though all the data and functions come from one site. The data distribution and connection paths stay hidden and formulated as hierarchical data defined in federator‟s capability metadata (see Section 4.1.1). The users access the system through integrated data-views (maps) with the event-based interactive mapping display tools. Tools create abstract queries from the users‟ actions through action listeners and communicate with
the system through the federator.
Creating such a federated design has some advantages in data sharing, performance and system expansion (interoperability and extensibility). It also removes the burdens of accessing heterogeneous data sources with resource specific client tools and enables attribute based unified querying over federated data sources from a single access point.
Architectural Design Features
A federated, service-oriented GIS framework is composed of two parts. One part consists of interoperable GIS component services. These services should be compliant with existing standards such as Open Geospatial Consortium. , The other part is the federator, which composes the component services according to the application requirements by providing integrated data-views in its aggregated capability metadata.
We have developed a federator that federates the standard GIS Web Services components through aggregation of their capabilities metadata. This effectively presents a single database image to the user defined in its aggregated capability metadata. This enables application-based data sets to be composed (which is defined in capability metadata) and unifies data access/query/display from a single access point.
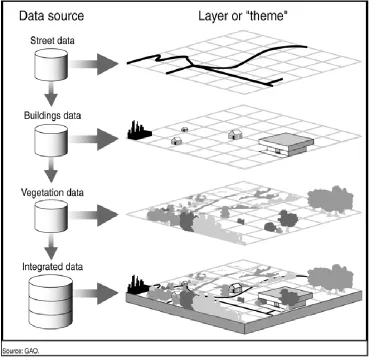
A map is an application-based, human-recognizable, integrated data display composed of layers. A layer is a data rendering of a single homogeneous data source. Data sources are standard Web Map Services (WMS) and Web Feature Services (WFS) defined by Open GIS Standards. Layers are created from the structured XML-encoded common data model (GML) or binary map images (raster data). Heterogeneous data source are integrated to the system through the WFS in the form of GML and through WMS in the form of binary map images. WFS and WMS serve these data with standard service programming interfaces and capability metadata describing their data and resources to enable clients to make valid queries.
High-performance Design Features
The high-performance design issues addressed in our proposed framework can be grouped into two types: extending the service specifications of open geographic standards (Chapter 6.2 and 6.3) and federation (Chapter 6.4).
The first group of design issues is related to the extension and enhancements of Open Geospatial Consortium (OGC) ("OGC," 1994) standards. We extended the OGC‟s online service descriptions with the streaming data transfer capabilities. At the service programming interface level, these services provide standard functionalities and interfaces, but the data payloads are transferred using topic-based, publish/subscribe messaging middleware.
partitioning of geo-data is difficult to achieve because the data (polygons, line-strings, points) are neither distributed uniformly nor of similar sizes. The load they impose varies depending on query range attributes (the geographic location or bounding box of the query). It is difficult to develop a fair partitioning strategy that is optimal for all range queries.
Federating services can provide stateful access to stateless GIS Web Services and also optimize the load balancing and parallel queries by taking the regions of data density or sparsity into consideration (Chapter 6). The federator‟s aim is to turn OGC compliance requirements into competitiveness and to provide high-performance responsive services that still meet the interoperability and extensibility requirements.
Extending the Architecture to other Science Domains
Our experience with GIS systems has shown that our federated, service-oriented service model can be generalized to apply to other application areas such chemistry and astronomy. We call this generalized framework Application Specific Information System (ASIS) and give blueprint architecture in terms of principles and requirements (Chapter 7). Developing such a framework requires first defining a core language (such as GML – Geographic Markup Language) expressing the primitives of the domain, second, key service components, service interfaces and message formats defining services interactions, and third, the capability file requirements (based on core-language) enabling inter-service communications to link the services for the federation.
1.3.
Research Issues
Interoperability and extensibility: We first investigate the adoption of open geographic standards from the OGC to create an interoperable Geographic Information System with standard data models, service descriptions, service programming interfaces, and service capability metadata. Second, we investigate the application of Web-Service and service-oriented Architecture (SOA) principles (Newcomer & Lomow, 2005) to our GIS data-grid (Chapter 3).
We also propose standard event-based interactive query and display tools enhanced with “Asynchronous JavaScript and XML” (AJAX) technologies for the users to interact with the standard GIS Web services seamlessly.
Research Questions:
How to integrate Web Service principles with features (data and rendering
services) of GIS to enable fine-grained dynamic information presentation? o Incorporating widely accepted Open GIS Standards with Web Services
How to merge Asynchronous JavaScript and XML (AJAX) with Web
Services clients for event-driven, browser-based interactive map tools?
o Mediating HTTP-based AJAX tools with Simple Object Access
Protocol (SOAP)-based GIS Web Services
Federation: We propose a framework for federation of standard GIS data services enabling unified data access/query/display through event-based interactive tools over integrated data-views (Chapter 4). Federation is achieved by aggregating GIS services‟ capability metadata in to federating service.
Web Services and their service programming interfaces to allow inter-service communication through capability metadata exchange and then define a aggregating service that enabling federation through the combined capability metadata of its constituent services.
We also investigate the principles for generalizing the proposed federated GIS system for general science domains such as chemistry and astronomy in terms of components and framework requirements.
Research Questions:
How to make attribute based federated query over distributed heterogeneous
geo-data sources?
o Capability metadata aggregation of standard GIS Web Services
o Unified data access/query from a single access point (with the help of federator‟s aggregated capability metadata)
How to generalize the domain-specific federation framework (proposed for
GIS) to other science domains such as astronomy and chemistry? o Defining architectural requirements
o Analyzing constraints and limitations
significantly larger than binary representations of the same data. The larger document size means that the greater bandwidth is required to transfer the data, as compared to the equivalent binary representations.
In addition, due to the architectural features (integration of autonomous resources), the system spends a lot of time on query/response transformations for relational-database to XML-encoded data model mappings.
We first investigated the performance efficient designs for XML structured data transfer and processing (parsing and rendering). Second, we research federation-oriented design features to enable better performance for Geographic Information Systems (Chapter 4). A federator inherently provides workload sharing by fetching the different data sets from separate resources to create multi-layered map image. On the other hand, a layer itself can also be split into smaller bounding box (ranges) tiles and each tile can be farmed out to a worker feature and map services.
The spatial data is defined in location (range) attribute and is unevenly distributed and variably sized. Because of these stringent characteristics and dynamic nature of data, it is not easy to perform efficient load balancing and parallel processing. In order to solve this, we propose and adaptive workload estimation algorithm to optimize the range queries (Chapter 6.4).
Research Questions:
How to make responsive data access/query over the data defined and queried
by range attributes?
o Sharing an unpredictable workload (whose load changes by range
o Adaptive load balancing and unpredictable workload estimation o Parallel data access/query via attribute-based query decomposition
How to apply pull-parsing technique to GML data rendering, and analyzing
the limitations of the other parsing techniques.
1.4.
Organization of Dissertation
This introduction consists of an overview of the Geographic Information Systems, architectural and high-performance design features of the federated services, a summary of the outstanding issues that relate to the research outlined in this thesis, and a discussion on the contribution of the thesis. The remaining of the thesis is organized as follows.
Chapter 2 consists of two parts. The first part gives background information about Geographic Information Systems, Open GIS Standards and Web Services architectures. The second part reviews of the related projects.
Chapter 3 describes the design principles and components of the federated information Grid architecture. The components are developed in accordance with Open GIS Standards and integrated with Web Service principles at both the data and application level.
Chapter 4 investigates a fine-grained service federation architecture built over the GIS Web Service components. It enables unified data access/query and display over integrated data views.
Virtual California (VC) and the National Infrastructure Simulation and Analysis Center (NISAC) projects.
Chapter 6 first introduces common performance issues and then presents general and federator-oriented performance enhancing techniques. The chapter ends with overall system evaluations based on applications to a real Geo-science application.
Chapter 7 examines the design principle and requirements of the proposed framework for the general science domains and gives a blueprint architecture.
CHAPTER 2
LITERATURE SURVEY
2.1.
Background
2.1.1.
Geographic Information Systems (GIS)
The general purpose of GIS is modeling, accessing, extracting and representing information and knowledge from the raw geo-data. The raw data is collected from sources ranging from sensors to satellites and stored in databases or file systems. The data goes through the filtering and rendering services and is ultimately presented to the end-users in human recognizable formats such as images, graphs, and charts. GIS is used in a wide variety of tasks such as urban planning, resource management, emergency response planning in case of disasters, crisis management, and rapid response.
Over the past two decades, GIS has evolved from traditional centralized mainframe and desktop systems to collaborative distributed systems. Centralized systems provide an environment for stand-alone applications in which data sources, rendering services, and processing services are all tightly coupled and application specific. Therefore, they are not capable of allowing seamless interaction with the other data or processing/rendering services. On the other hand, the distributed systems are composed of autonomous hosts (or geographically distributed virtual organizations) that are connected through a computer network. They aim to share data and computation resources collaborating on large scale applications.
Figure 1: Layered display – a map is composed of a set of multiple, distributed layers. Figure is from (Koontz, 2003).
2.1.2.
Open GIS Standards and GIS Web Services
Standards Organization (ISO/TC211) ("ISO," 2008). The standards bodies‟ aims are to make the geographic information and services neutral and available across any network, application, or platform by defining common data models and online service descriptions.
The standards bodies specify methods, tools and services for data management, accessing, processing, analyzing, presenting and transferring such data in digital form between different users and systems. ISO/TC211 defines a high-level data model for public sectors, such as governments, federal agencies, and professional organizations (Peng & Tsou, 2003). On the other hand, OGC is interested in developing both abstract definitions of Open GIS frameworks and technical implementation details of data models and to a lesser extent services. They are compatible with each other. ("JAG," 1999)
OGC‟s standards definition for data model (Geographic Markup Language
-GML) (Cox, Daisey, Lake, Portele, & Whiteside, 2003) and online data services are well-known and widely adopted. As more GIS vendors are releasing compatible products and more institutions use OGC standards in their research and implementations, OGC specifications are becoming de facto standards in GIS community, and GML is rapidly emerging as the standard XML encoding for geographic information.
SkyServers (Gray et al., 2002) defined by the National Virtual Observatory community. OGC‟s WFS implementation specification defines interfaces for data access and
manipulation operations on geographic features. Geographic features are basically earth-related data definitions such as rivers, lakes, earthquake seismic records etc. Via its standard service interfaces, a web client can combine, use and manage geo-data from different sources by invoking several standard operations (Vretanos, 2002). By adopting interoperable Open GIS Standards (that is, using GML and standard online services WMS and WFS) for our distributed computing research infrastructure, we open the door of interoperability to this growing community.
In addition to the domain-level interoperability and extensibility, information systems need cross-language, operating system, and platform interoperability to enable data sharing/federating and analysis over autonomous heterogeneous resources provided by various organizations. Web Service standards (Booth et al., 2004) are a common implementation of Service Oriented Architectures (SOA) ideas, giving us a means of interoperability between different software applications running on a variety of platforms. Grid computing (Foster & Kesselman, 2004; Fox, 2004) (Berman, Fox, & Hey, 2003) has a converging Web Service-based architecture. By implementing Web Service versions of GIS services, we can integrate them directly with scientific application Grids (Atkinson et al., 2005; Aydin et al., 2008).
machine-processable format called the Web Service Description language (WSDL) (Christensen, Curbera, Meredith, & Weerawarana, 2001). Other systems interact with the Web Services in a manner prescribed by its description using SOAP-messages (Simple Object Access Protocol), typically conveyed using HTTP with an XML serialization in conjunction with other Web-related standards. Representational State Transfer (REST) (Fielding & Taylor, 2002; Khare & Taylor, 2004) is a variation of this architecture that replaces WSDL with standard HTTP operations (GET, POST, PUT, DELETE). REST can be used to transmit SOAP messages as well as other formatted transmissions such as RSS (Melamed & Keidar, 2004), ATOM, or JSON (Crockford, 2006).
The major difference between Web Services and other component technologies is that Web Services are accessed via the ubiquitous Web protocols such as HTTP using Extensible Markup Language (XML)-encoded messages instead of object-model-specific protocols such as Distributed Component Object Model (DCOM) (Redmond, 1997), Remote Method Invocation (RMI) ("RMI," 2004), or Internet Inter-Orb Protocol (IIOP) (Kirtland, 2001). One typically builds services to be stateless and places the distributed system state in a single state machine that aggregates clients to services. This simplifies several well-known problems in distributed object systems (such as fault tolerance), enabling Web Service-based systems to have better scalability.
applications easily. Also, it allows us to potentially leverage the more general Web Service-based tools such as workflow engines in GIS problems.
2.2.
Related Works
2.2.1.
Linked Environments for Atmospheric Discovery (LEAD)
Linked Environments for Atmospheric Discovery (LEAD) is a large scale project funded by an NSF Large Information Technology Research grant. LEAD‟s goal is to address fundamental IT and meteorology research challenges to create an integrated framework for analyzing and predicting weather at a finer grained resolution than is currently possible. The proposed framework helps researchers to identify and access, prepare, manage, analyze or visualize a broad array of meteorological data and model output independent of format and physical location (Ramamurthy & Droegemeier, 2008).
LEAD is developing the middleware for adaptive utilization of distributed resources, sensors and workflows. The LEAD distributed computing infrastructure is constructed as a service-oriented architecture and decomposes into services which communicate via well-defined interfaces and protocols (Plale, Gannon et al., 2006).
meteorological events. To provide such features LEAD data subsystem supports three important capabilities: automated data discovery by replacing the manual data management tasks with automated ones; a highly scalable data archiving system which allows transfer of large scale data products between resources, metadata descriptions of the available information and protected storage facilities; and easy search and access interfaces for the data via a search GUI and underlying ontology (Plale, Ramachandran et al., 2006).
2.2.2.
Geosciences Network (GEON)
The Geosciences Network (GEON) (Zaslavsky & Memon, 2004) is a multi-university project funded by the National Science Foundation (NSF) to develop cyber infrastructure to enable sharing of data sets and services in a distributed environment for the Earth Sciences. The GEON Grid is a distributed network of GEON nodes, each of which runs a GEON software stack that includes Web and Grid services to enable users to register data sets, register services, issue queries across multiple information sources, using spatiotemporal search conditions and ontologies, download data into personal spaces, invoke analysis services, visualize output of queries, and perform analysis. The architecture includes data mediation services, workflow services, and a portal. Much of the data is geospatial and spatiotemporal in nature and provides appropriate search interfaces, and efficient mapping interfaces for such data is an important requirement. The GEON Grid software stack includes ArcIMS (Esri, 2004) as one of its components to provide GIS and mapping functionality.
(Bhata, Menon, Zaslavsky, Seber, & Baru, 2003). They also have the myGEON (Youn et al., 2007) concept functioning similarly as in the LEAD, and they have data display tools in a portal implemented by GridSphere (Novotny, Russell, & Wehrens, 2004).
GEON is based on a “Service-Oriented Architecture (SOA)”. Advanced
information technologies are being developed in the project to support “intelligent” searching, semantic integration, and visualization of multidisciplinary information spaces as well as four-dimensional scientific datasets and geospatial data. The project also plans to provide access to high performance computing platforms for data analysis and model execution. The GEON Portal also provides a Web-based interface to access the various resources.
2.2.3.
Laboratory for Advanced Information Technology and Standards
(LAITS):
GIS services using OGC WCS, WMS and WFS. Currently they have WCS services to demonstrate their work.
They also have a demo to access GIS data kept in the form of coverage in different databases connected to different WCS instances. These OGC compatible WCS are implemented and wrapped as Grid services and called GWCS (Grid Web Coverage Services) (Committee, 2001). LAITS enhanced the WCS to process four dimensional HDF-EOS data, which is in the network Common Data Format (netCDF) (Rew & Davis, 1990). In their proposed architecture, data providers are deployed as WCS in NASA Ames, in LLNL and in LAITS hosts. In their GCSW (Grid Catalog Services for Web), they store and serve information about the available coverage servers. They use OGC‟s CSW (Catalog Services for Web) services to search for a user-specified data server. Data transfer is achieved by using GridFTP (Allcock, 2003).
The brain of the system is iGSM (Intelligent Grid Service mediator). iGSM (Chu, Di, & Thornton, 2006) dispatches user requests from a WCS/WMS portal to the most appropriate GWCS/GWMS in the Virtual Organization. Portals tasks are implemented at iGSM. Portals instances and data-service providers meet at the iGSM. iGSM also does request conversion. Geospatial-data access requests from OGC WCS portal are transferred to an appropriate format for the Grid enabled WCS (GWCS). Catalog Service search is also done in iGSM.
LAITS‟s grid approach is based on Globus toolkit ("GT4," 2008). In contrast, our
CHAPTER 3
GIS WEB SERVICE DATA-GRID COMPONENTS
A Geographic Information System (GIS) is a primarily a collection of data is driven by observations, yet a mechanism to share collected data and developed software tools has not been widely established. The data collected are stored in several different formats on different platforms. Software developed in the community employs a variety of mechanisms for accessing such data and conduct analysis on them, with little or no collaboration and standards.
schemes, topological organization (or lack of it), and the set of transformation and analysis services implemented in the source.
Our proposed information system Grid framework is based on common data models, GIS Web Service components, and a service-oriented architecture implemented with “WS-I” Web Service principles. In this chapter we first present the requirements for the common data models and their advantages of usage in such a framework (Chapter 3.1). Next, we present motivations and advantages of extending and enhancing service components as Web Services to develop a SOA framework for GIS (Chapter 3.2). Finally, we present the system‟s general architectural features in terms of its components, interactions and data-flow from the archived data stores to the end users (Chapter 3.3)
3.1.
Geo-data and Common Data Models
Geospatial data, in general, refers to a class of data that has a geographic or spatial nature, e.g., the information that identifies the geographic location and characteristics of natural or constructed features and boundaries on the earth.
Geospatial data represents real world objects and properties (roads, land use, elevation) with digital data. Real world objects can be divided into two abstractions: discrete objects (a house) and continuous fields (rain fall amount or elevation). There are two broad methods used to store data in a GIS for both abstractions: Raster and Vector.
no data is available. Raster data is stored in various formats ranging from a standard file-based structure such as TIFF and JPEG to Binary Long Object (BLOB) data stored directly in a relational database management system.
Common data format for the raster data in our system: In our GIS system we use image formats such as JPEG or TIFF to represent the raster data provided by third party OGC compatible Web Map Services or Coverage Portrayal Services (CPS) (Lansing, 2002).
The vector data type uses geometrical constructions such as points, lines (series of point coordinates), or polygons (shapes bounded by lines), to represent objects on the Earth‟s surface. Examples include property boundaries for a housing subdivision
(represented as polygons) and water well locations (represented as points). Vector features can be made to respect spatial integrity through the application of topology rules such as 'polygons must not overlap'. Vector data can also be used to represent continuously varying phenomena.
Just as XML helps the Web by separating content from presentation, GML does the same thing specifically for geography. GML allows the data providers to deliver geographic information as distinct features. Using the latest Web technologies, users can process these features without having to purchase proprietary GIS software. By leveraging related XML technologies such as XML Schema, XML Data Binding Frameworks, XSLT (Clark, 1999), XPath (Clark & DeRose, 1999), XQuery (Boag et al., 2007) etc. a GML dataset becomes easier to process in heterogeneous environments.
By incorporating GML in our systems as common data format we gain several advantages:
1. It allows us to unify different data formats. For instance, various organizations offer different formats for position information collected from GPS stations. GML provides suitable geospatial and temporal types for this information, and by using these types a common GML schema can be produced. See Appendix H for a sample GML.
2. As more GIS vendors are releasing compatible products and more institutions use OGC standards in their research and implementations, OGC specifications are increasingly becoming de facto standards in GIS community. GML is rapidly emerging as the standard XML encoding for geographic information. By using GML we open the door of interoperability to this growing community.
4. One approach to achieve machine-to-machine communications and autonomous computations.
5. It enables separating data‟s representation from the context.
6. Since it is XML based, it can be used in other XML based systems and communication protocols such as XMLHttpProtocol (in other words AJAX) and Web Services (Sayar, Pierce, & Fox, 2006).
7. It is an approach to achieving cross-language interoperability.
Due to the numerous advantages of using semi-structured data representation, other science domains also have adopted similar approaches. For example, chemistry uses CML (Chemistry Markup Language) (G. L. Holliday, Murray-Rust, & Rzepa, 2006), Astronomy domain uses VOTable (Virtual Observatory Tables) (Williams et al., 2002) and Mathematic science domain uses MathML (Mathematic Markup Language) (Buswell et al., 1999).
3.2.
Web Service Extensions to Standard Service Definitions
The proposed GIS framework is service-oriented and has components as Web Services. These Web Services provide standard service interfaces and communicate with common messages formats defined in standard specifications. By integrating Web Services with Open Geographic Standards, we support interoperability at both data and application level and have the common advantages of SOA architectures listed below:
neutral. Web services can be used on different platforms than those on which they were implemented.
Integration: It will be easier for application developers to integrate geospatial functionality and data into their custom applications. For example, there are many tools in various programming languages that can create client stubs from WSDL files that can be used to invoke the services. Web Service-based frameworks are loosely coupled and component oriented. Because of the standard interfaces and messaging protocols the Web Services can easily be assembled to solve more complex problems.
Infrastructure: We can take advantage of the huge amount of infrastructure that is being built to enable the Web Services architecture – including development tools, application servers, messaging protocols, security infrastructure, workflow definitions, etc.
message formats. Furthermore, sometimes we need to access several data sources and run several services for solving complex problems. This is extremely difficult in HTTP services, but rapidly developing workflow technologies for Web and Grid Services may help us combine several services into composite applications. For these reasons we have based our implementation of standard GIS services on Web Services principals.
Moreover, complex scientific applications require access to various data sources and run several services consecutively or at the same time. Since this is not in the scope of HTTP but can be supported using rapidly developing workflow technologies for Web and Grid Services, we have based our implementations on Web Services principals. Our goal is to make seamless coupling of GIS Data sources with other applications possible in a Grid environment.
GIS systems are supposed to provide data access tools to the users as well as manipulation tools to the administrators. In principle the process of serving data in a particular format is simple when it is made accessible as files on an HTTP or FTP server. But additional features like query capabilities on data or real-time, push-style access in a streaming fashion require more complicated approaches. As the complexity of the services grows, the client‟s chance of easily accessing data products decreases, because
every proprietary application developed for some type of data require its own specialized clients. Web Services help us overcome this difficulty by providing standard interfaces to the tools or applications we develop.
methods for invoking the service and receiving the results. This method allows providers to make their applications available to others in a standard way.
Most scientific applications that couple high performance computing, simulation or visualization codes with databases or real-time data sources require more than simplistic remote procedure call message patterns. These applications are sometimes composite systems where some of the components require output from others. If they are asynchronous, it may take hours or days to complete. Such properties require additional layers of control and capabilities from Web Services, which introduces the necessity for a messaging substrate that can provide these extra features.
3.3.
System Framework and Web-Service Components
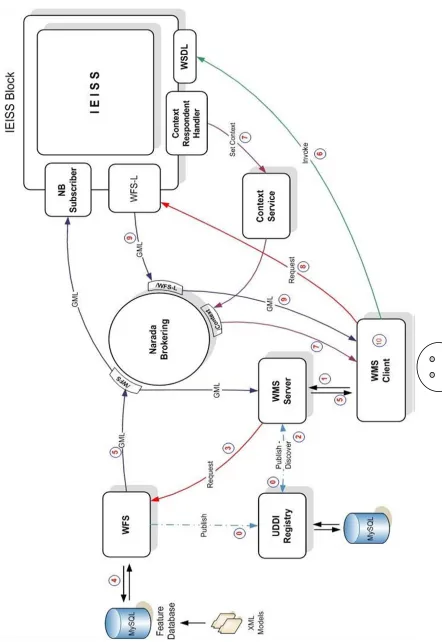
The proposed service-oriented GIS is illustrated in Figure 2. It is composed of two major types of GIS Web Services (see Chapter 3.3.1). These are Web Map Services and Web Feature Services. Optionally, in order to find and bind services in service-oriented architecture, system can also be extended with catalog and registry services.
Figure 2: GIS framework with the proposed Web Service components and data flow. See also Figure
3.
In the system there are also two types of common data model. The first one is provided by WFS in XML-encoded GML data format, and the second one is provided by WMS in binary map images. For more detail about the common data models and their usage advantages see Section 3.1.
3.3.1.
Web Feature Service
these interfaces, a web user or service can combine, use and manage geo-data from different sources by invoking several standard operations (Vretanos, 2002).
OGC specifications describe the state of a geographic feature by a set of properties, where each property can be thought of as a [name, type, value] tuple. Geographic features are those that may have at least one property that is geometry-valued. This also implies that features can be defined with no geometric properties at all. According to the Open Geographic Standard‟s definition, WFS must minimally provide
three operations: getCapabilities, describeFeatureType and getFeature. The more advanced transactional WFS must provide two more service interfaces, transaction and lockFeature. In our research framework, we assume that the WFS instances are provided. However, to understand the relationships of the WFS instances to WMS and federataotr instances, we summarize the WFS standard operations below (Vretanos, 2002):
- GetCapabilities: A Web Feature Service must be able to describe its capabilities. Specifically, it must indicate which feature types it can service and what operations are supported on each feature type.
- DescribeFeatureType: A Web Feature Service must be able, upon request, to describe the structure of any feature type it can serve.
- GetFeature: A Web Feature Service must be able to service a request to retrieve feature instances. In addition, the client should be able to specify which feature properties to fetch and should be able to constrain the query spatially and non-spatially. Features are instances of Feature types.
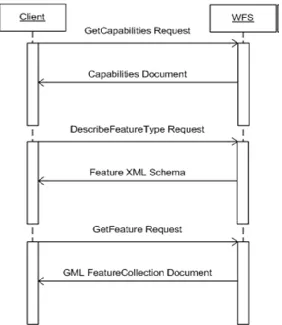
involves retrieving the capabilities document. A client first sends a getCapabilities request to the WFS server to learn which feature types are provided and what operations are supported on each feature type, along with any constraints. Upon receiving the list of available feature data available with their specific properties (given in capability file of WFS), client sends a describeFeatureType request to get the structure information of the interested feature type. Finally, client makes a getFeature request with appropriate request created based on client‟s purpose and WFS server‟s capability metadata. The
[image:49.612.185.467.301.626.2]most common queries used are GetFeature requests to retrieve particular features.
Figure 3 illustrates three groups of coupled bars representing client and WFS interactions.
The first group of request/response messages at the top illustrates capability exchange between client and server. This is done with WFS‟s GetCapabilities service
interface. The clients (Web Map Server or users) start with requesting a capabilities document from WFS. When a GetCapabilities request arrives, the server may choose to dynamically create a capabilities document and returns this, or simply return a previously created XML document.
The second group of request/response messages in the middle explains requesting structured information (schema) about the interested feature data listed in capability metadata of WFS. This is achieved by using WFS‟s describeFeatureType service
interface. After the client receives the capabilities document, it can request a more detailed description for any of the features listed in the WFS capabilities document. Upon invocation of this service interface, WFS returns an XML Schema that describes the requested feature as the response.
The third group of request/response messages at the bottom of Figure 3 illustrates a request for feature data based on user-defined constraints in an appropriate request format. This is done through WFS‟s getFeature service interface. After the first two steps
obtained from the DB query are converted to that particular feature‟s GML format and returned to the client as a FeatureCollection object.
A WFS allows clients to access and manipulate the geographic features without having to consider the underlying data stores. The clients‟ only view of the data is through the WFS interface, which allows the data providers to integrate various types of data stores with one WFS instance. Figure 2 displays this instances where the WFS server is accessed by different types of clients and has access to various types of spatial databases, file systems and any-type of storages. Clients interact with WFS by submitting database queries encoded in OGC Filter Encoding Implementation (Vretanos, 2001) and in compliance with the Common Query Language (Rao, Percivall, & Enloe, 2000). The query results are returned as GML FeatureCollection documents. In this context, WFS also behaves as mediator services to provide feature data in a common data model (Geographic Markup Language) through standard service interfaces. For the technical details about implementing Web Service based WFS see (Aydin, 2007).
3.3.2.
Web Map Service
Web Map Service (WMS) (Beaujardiere, 2004) (Kolodziej, 2004) is the key service for information visualization in the GIS domain. WMS produces maps from both vector-encoded and binary data. The vector data is GML and is obtained from requests to WFS instances. Binary data can be obtained from Coverage Portrayal Services (CPS) (Lansing, 2002) and other Web Map Servers.
A map is not the data itself. Maps create information from raw geographic data, vector data, or coverage data. Maps are generally rendered in pictorial formats such as JPEG (Joint Photographic Expert Group), GIF (Graphics Interchange Format), or PNG (Potable Network Graphics) (Adler et al., 2003). WMS also produces maps from vector-based graphical elements in Scalable Vector Graphics (SVG) (Andersson & others, 2003).
Web Map Service (WMS) enables visualizing, manipulating and analyzing geospatial data through maps displayed on browser based interactive GUI (see Chapter 3.3.3). Map Servers typically compose maps in the layers. The layers may come from distributed sources: Web Feature Services provide abstract feature representations that can be converted to images, and other Map Servers may contribute map images. NASA‟s OnEarth WMS is an example ("OnEarth," 2007). WMSs can be federated and cascaded to create more detailed and comprehensible map images. We discuss this in greater depth in Chapter 4.
an optional service. The implementation details and service interfaces are given in the following two sub-sections.
3.3.2.1. GetCapabilities Services
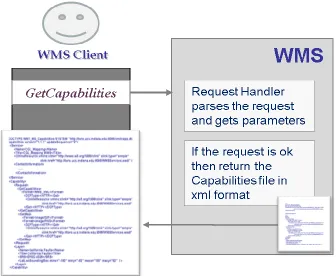
The purpose of the getCapabilities operation is to obtain service metadata, which is a machine and human readable description of the server‟s information content and acceptable request parameter values. Figure 5 presets the getCapabilities request schema.
[image:54.612.163.499.73.349.2]
Figure 4: GetCapabilities operation steps. See Appendix C for a sample WMS capabilities file
instance
[image:54.612.121.519.383.667.2]3.3.2.2. GetMap Services
The getMap service interface allows the retrieval of maps. Maps are provided in different various formats based on user-defined parameters and layer attributes. All the supported formats for map-image layers and corresponding layer specific attributes and constraints are defined in WMS Capabilities document. Before invoking getMap service interface, clients first obtain capabilities document by invoking getCapabilities service interfaces (see Chapter 3.3.2.1). The image is returned back to the WMS Client as an attachment to SOAP message. If the WMS encounters any problem during handling of the request, it sends an exception message in SOAP back to the WMS Client.
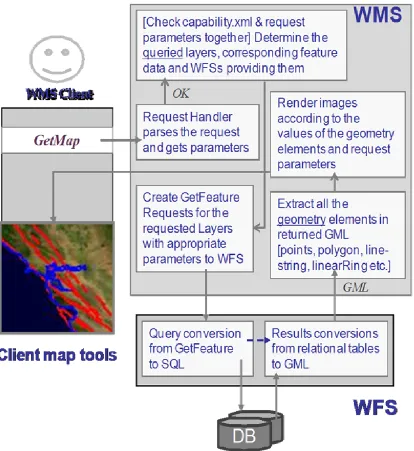
Figure 6: GetMap operation steps.
getMap request is Scalable Vector Graphics (SVG) (Bowler et al., 2001), then WMS creates SVG from returned feature data by using its geometry elements. If the requested image is not in SVG format, we first create the SVG image and then convert it into the desired image formats (such as PNG, GIF, or JPEG). Apache Batik provides libraries for this conversion. Batik is a Java(tm) technology based toolkit for applications or applets that use images in the SVG format for various purposes, such as viewing, generation or manipulation. By using these schema files we derive geometry elements from the GML file to visualize the feature data. These geometry elements in GML are basically Point, Polygon, LineString, LinearRing, MultiPoint, MultiPolygon, MultiGeometry, etc.
To create the images from the features returned from the WFS, we have used Java Graphics2D and Java AWT libraries. For each layer we create a different graphics object. If you assign each layer to different graphics object than Java libraries allow you to overlay these graphic objects in various combinations.
Figure 7 : GetMap Request Schema. See Appendix A for an instance of this request schema
known as cascading. WMS behaving as a client to another WMS is called cascading WMS, and the layer used is called cascaded layer. We will exploit and extend cascading in our federation approach.
URL url = new URL(
Wmsaddress+”?request=GetMap&width=" + width + "&height=" + heigth +
"&layers="+layername+
”&styles=&srs=EPSG:4326&format=”+format+”&bbox=" + bbox);
BufferedImage im = ImageIO.read(url); Graphics2D g = im.createGraphics(); …
if(istherePoint)
String[] points = getPointsFromFeatureData(); if(isthereLineString)
String [] LineStrings = getLineStringFromFeatureData(); if(isthereLineRing)
String [] LineRings = getLineRingFromFeatureData(); if(istherePolygon)
String [] polygons = getPolygonsFromFeatureData(); …
if(polygons!=NULL){
for(int i=0; i<polygons. length; i++){
int [][] xypoints = wm.getXYpoints(polygons[i]); g.setColor(Color.darkGray);
g.drawPolygon(xypoints[0], xypoints[1], xypoints[0].length); }
}
if(LineRings!=NULL){
for(int i=0; i< LineStrings. length; i++){
int [][] xypoints = wm.getLinesInStr(LineStrings[i]); g.setColor(Color.darkGray);
g.drawPolyline(xypoints[0], xypoints[1], xypoints[0].length); }
}
Check all the geometry
elements in GML for a queried region of the map .Point, LineString Polygon etc.
g.dispose();
Figure 8: Sample output of the above map images generating code
How to send binary map images with SOAP messages (in JAVA):
1. Server side:
Sample JAVA client code below shows how to attach a map image to SOAP message in response to getMap request. We assume map image name is maimage.jpeg. The WMS server first creates a data handler from the image and casts it as an object, and then returns.
Object map = file2DataHandlerObject (APPLPATH+"/mapimage.jpeg"); public Object file2DataHandlerObject(String filePath) {
try {
DataHandler dhSource = new DataHandler(new FileDataSource(filePath));
return (Object) dhSource; } catch (Exception ex) { ex.printStackTrace(); return null;
}
2. Client side:
to SOAP message. It first extracts the attachment and then data handler from the attachment. It created map images as byte array through data handler.
java.lang.Object value = null; value = binding.getMap(request);
byte[] bs = null;
Object[] attachments = binding.getAttachments();
for (int i = 0; i < attachments.length; i++) {
AttachmentPart att = (AttachmentPart) attachments[i]; DataHandler dh = att.getActivationDataHandler();
BufferedInputStream bis = new BufferedInputStream(dh.getInputStream());
bs = new byte[bis.available()]; bis.read(bs, 0, bs.length); bis.close();
3.3.2.3. GetFeatureInfo Services
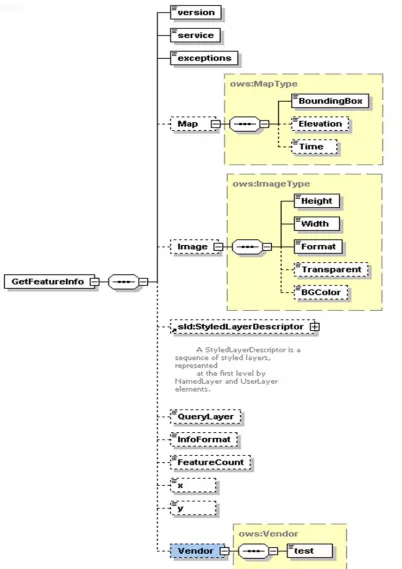
The GetFeatureInfo operation is designed to provide clients of a WMS with more information about features over the map images that were returned by previous Map requests. GetFeatureInfo is used when a user needs further information about any feature data on the map. Its return type is human readable text or HTML, which is defined as request parameter. See Figure 7 for general schema for creation of getFeatureInfo query instances.
The GetFeatureInfo works as follows (see also Figure 11):
The basic operation provides the ability for a client to specify which pixel is being asked about, which layer(s) should be investigated, and what format the information should be returned in. Because the WMS protocol is stateless, the GetFeatureInfo request indicates to the WMS what map the user is viewing by including most of the original GetMap request parameters (all but VERSION and REQUEST). From the spatial context information (BBOX, CRS, WIDTH, HEIGHT) in that GetMap request, along with the x, y position the user chose, the WMS can (possibly) return additional information about that position. The actual semantics of how a WMS decides what to return more information about, or what exactly to return, are left up to the WMS provider.
Figure 11 illustrates the successive process steps done by the WMS to respond to getFeatureInfo requests. After checking the request parameters with the capability metadata, WMS creates appropriate getFeature queries to fetch the GML data from WFSs. After getting the feature collections data from the WFS, WMS extracts all the non-geometry elements and attributes in the returned GML files and create another text or HTML file based on request parameter and create the response to getFeatureInfo query in accordance with the return parameter defined by the client in the query. The parameter called “INFO_FORMAT” defines the return format whose possible values are plain text files, HTML and GML.
non-geo elements, WMS creates HTML file from newly created XML file by using generic XSL ("XSL," 1999) file and XSLT transformation machine. Figure 10 explains the general architecture of creating a response from the GML file through generic XSL stylesheet file given in Figure 13.
Figure 9: A snapshot of response to getFeatureInfo. It is actually an attribute querying of earthquake seismic data layer shown on the map image.
Figure 10: Creating getFeatureInfo reponse by using a stylesheet and XSLT processor. See Figure 10 (Figure-13)
Figure 13: Generic XSL file for HTML creation from the GML in order to create responses for the
getFeatureInfo.
3.3.3.
Browser event-based Interactive Map Client Tools
(see Appendix C). For WFS, the data sets are defined as feature collections (see Appendix D). Client tools enable users and decision makers to interact with the system through interactive event-based maps seamlessly and easily by hiding the system complexity. These tools also enable querying of the vector data in the multi-layered structured map images shown on the screen (see Figure 9). They do so by using WMS‟s standard getFeatureInfo service interface.
Several capabilities are implemented for the user to access and display geospatial data. The client tools enable the user to zoom in, zoom out, measure distance between two points on the map for different coordinate reference systems, to get further information by making getFeatureInfo requests for the attributes of the features on the map, and drag and drop the map to display different bounding boxes. Users can also request maps for the area of interest by selecting predefined options by clicking the down list. The user interface also allows the user to change the map sizes from the drop-down lists. Users can also give specific dimensions for the desired map size. Zoom-in and zoom-out features let the user change the bounding box values to display the map in more or less details. Each time a user changes the bounding box values, the user interface shows the updated bounding box values at the each side of the map.
Java Server Pages (JSP), Java-Script, and Cascading Style Sheets (CSS) (E. A. Meyer, 2006).
Figure 15 shows the portal‟s interactive map tools and user interface enabling interactive data access, query, and display over integrated data views (map images). The sample map in the figure shows California earthquake seismic data superimposed over a Google Map ("Google Map," 2005) image.
Figure 16 shows application-based decision-making tools extended from generic map tools. Our client interface system is modular and can be updated according to the application requirements in terms of parameters and output results. The sample project in the figure superimposes earthquake forecasts generated by the Pattern Informatics (Nanjo, Holliday, Chen, Rundle, & Turcotte, 2006) application over Google maps.

![Programmable Controllers Theory and Implementation [L A Bryan & E A Bryan] pdf](data:image/gif;base64,R0lGODlhAQABAIAAAP///wAAACH5BAEAAAAALAAAAAABAAEAAAICRAEAOw==)